Inspiration
It started with a question we couldn't shake: how do professional lenders, with entire teams of analysts, still get blindsided by problems that were sitting in public filings the whole time? The more we read about credit blowups, the more the same story repeated itself. The warning sign was never hidden. It was disclosed on page 187 of a quarterly report, in a footnote about a guarantee or a financing program, and nobody had the hours to find it.
A single credit analyst covers 50 to 70 companies, each filing hundreds of pages every quarter. Even the best analyst can't read all of it. And once a memo says a loan looks safe, there's a natural pull to explain away anything that disagrees. We realized AI tools could make that worse, since most of them just generate a confident summary and stop there. So we set out to build something different: a tool that reads every footnote, proves every claim it makes, and then turns around and argues against its own conclusion.
What it does
Signal Watch turns a ticker into a complete, sourced credit analysis in about a minute, laid out in the same seven step process credit analysts are trained on.
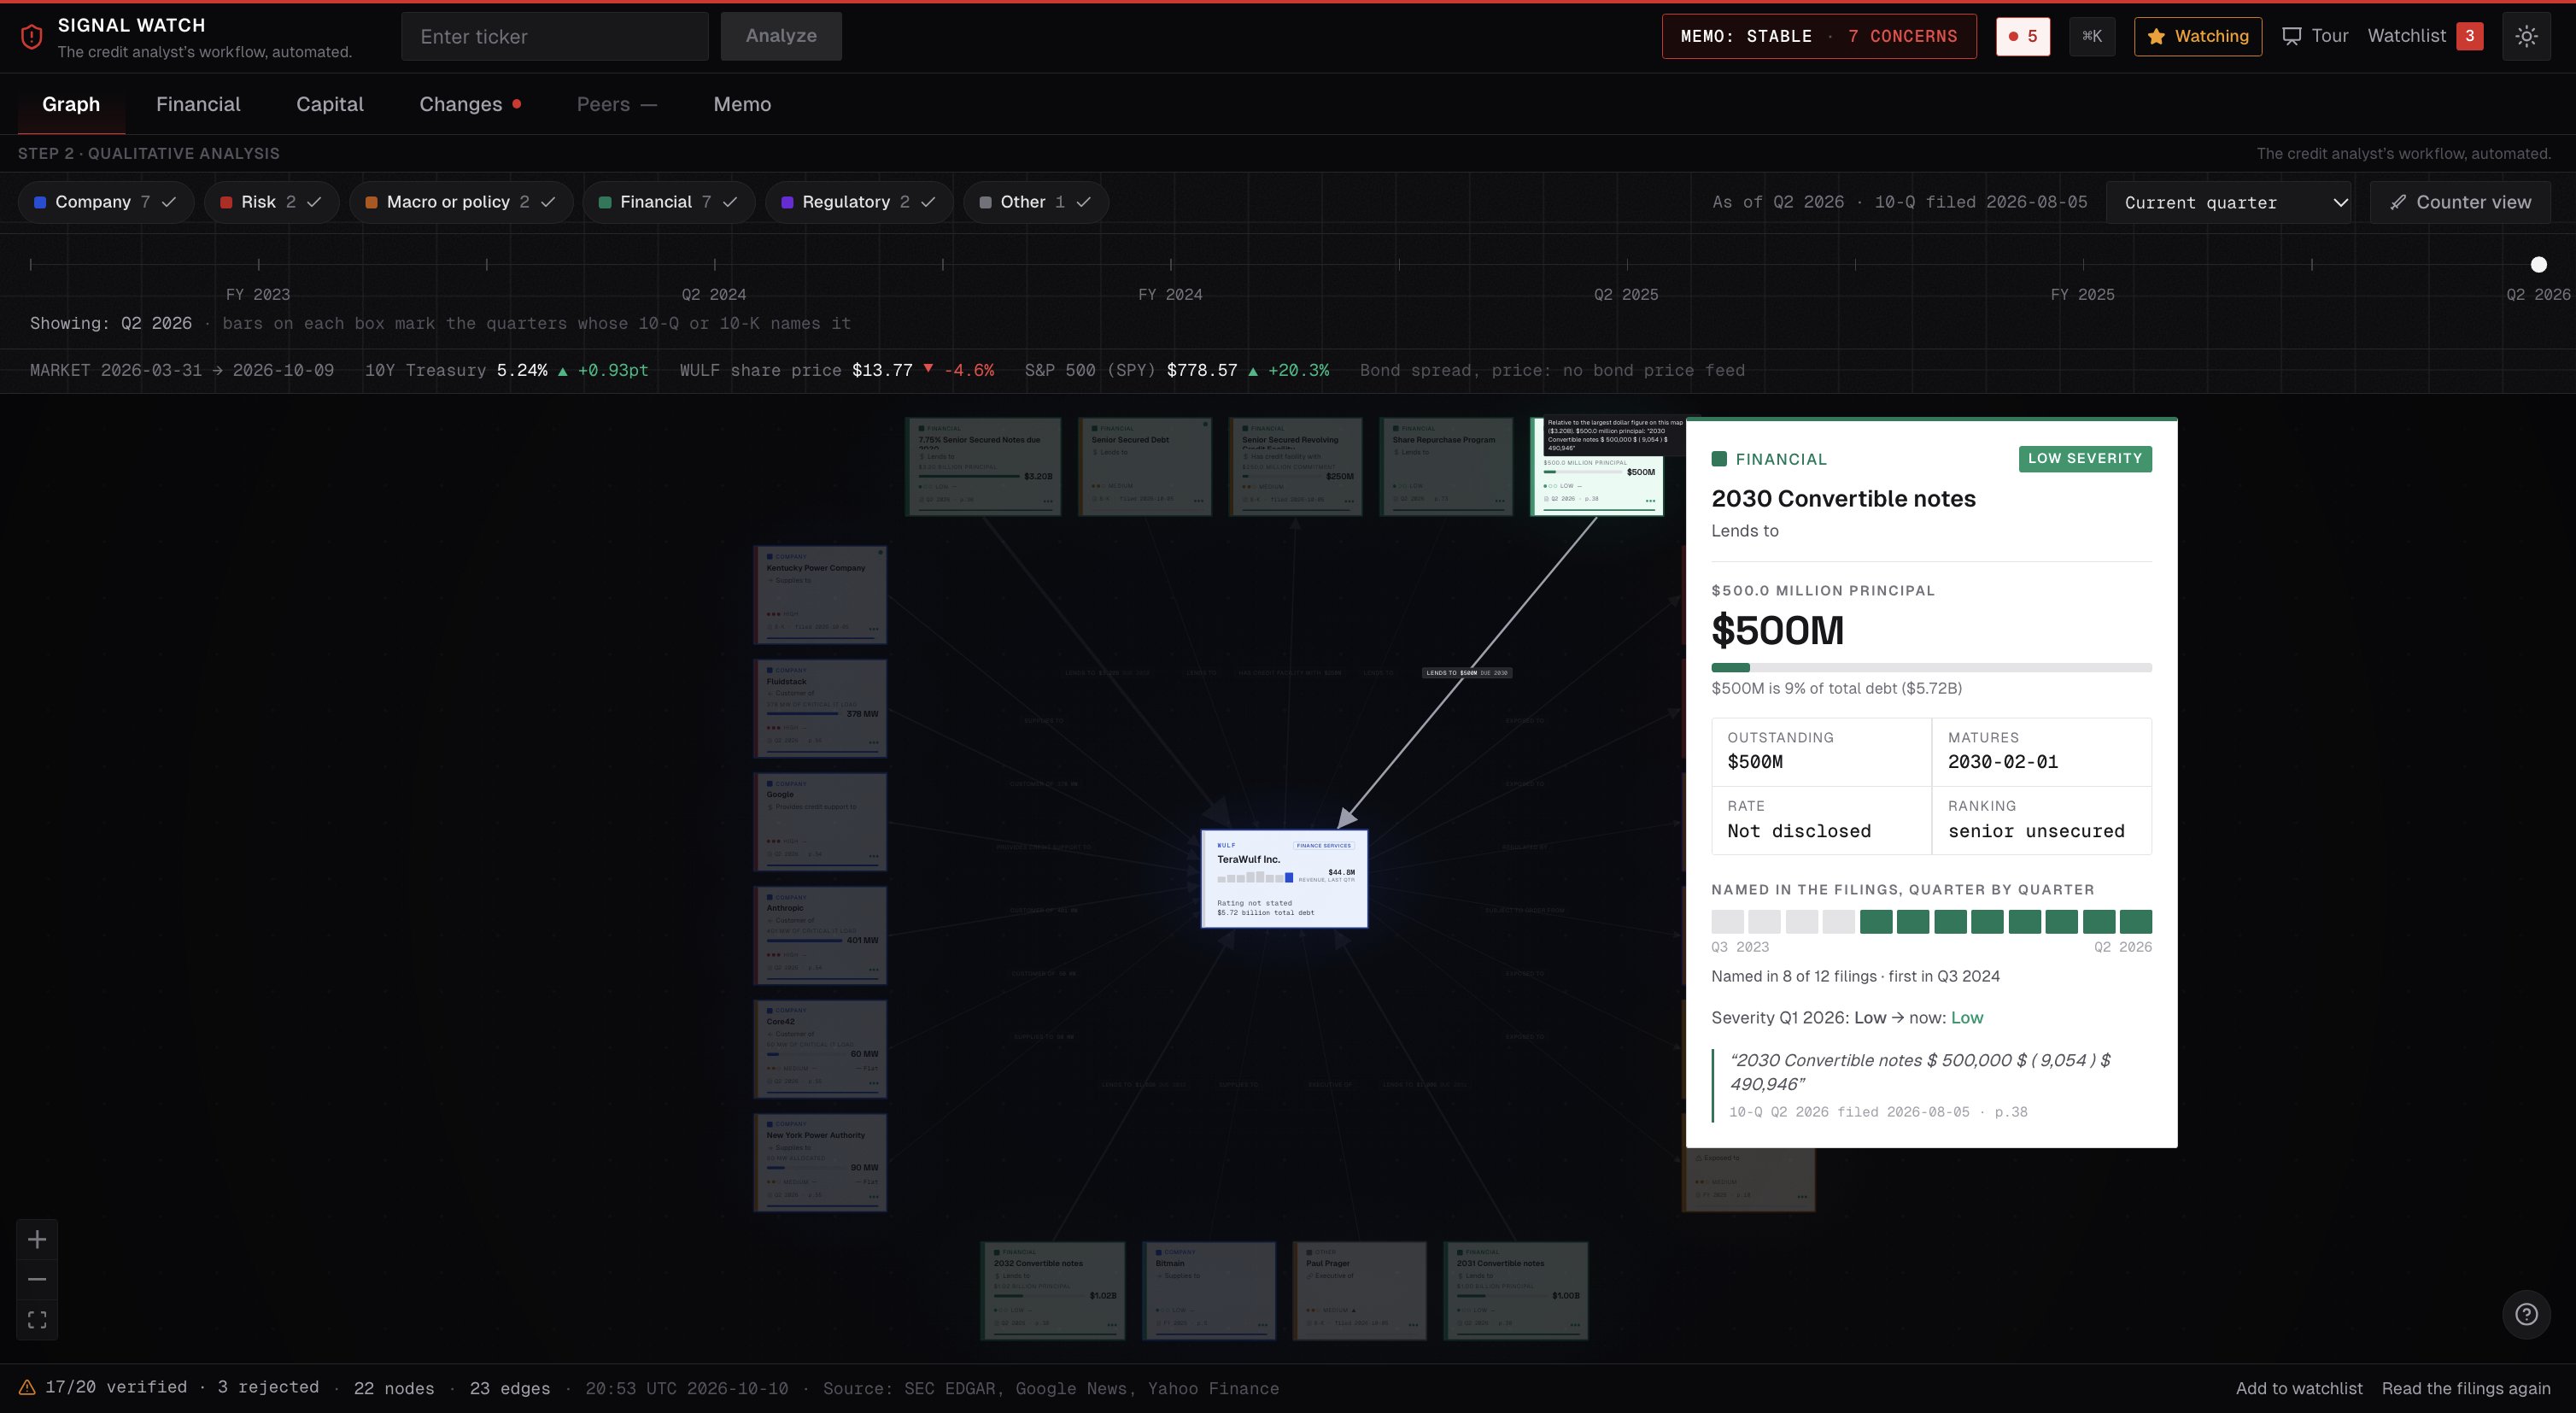
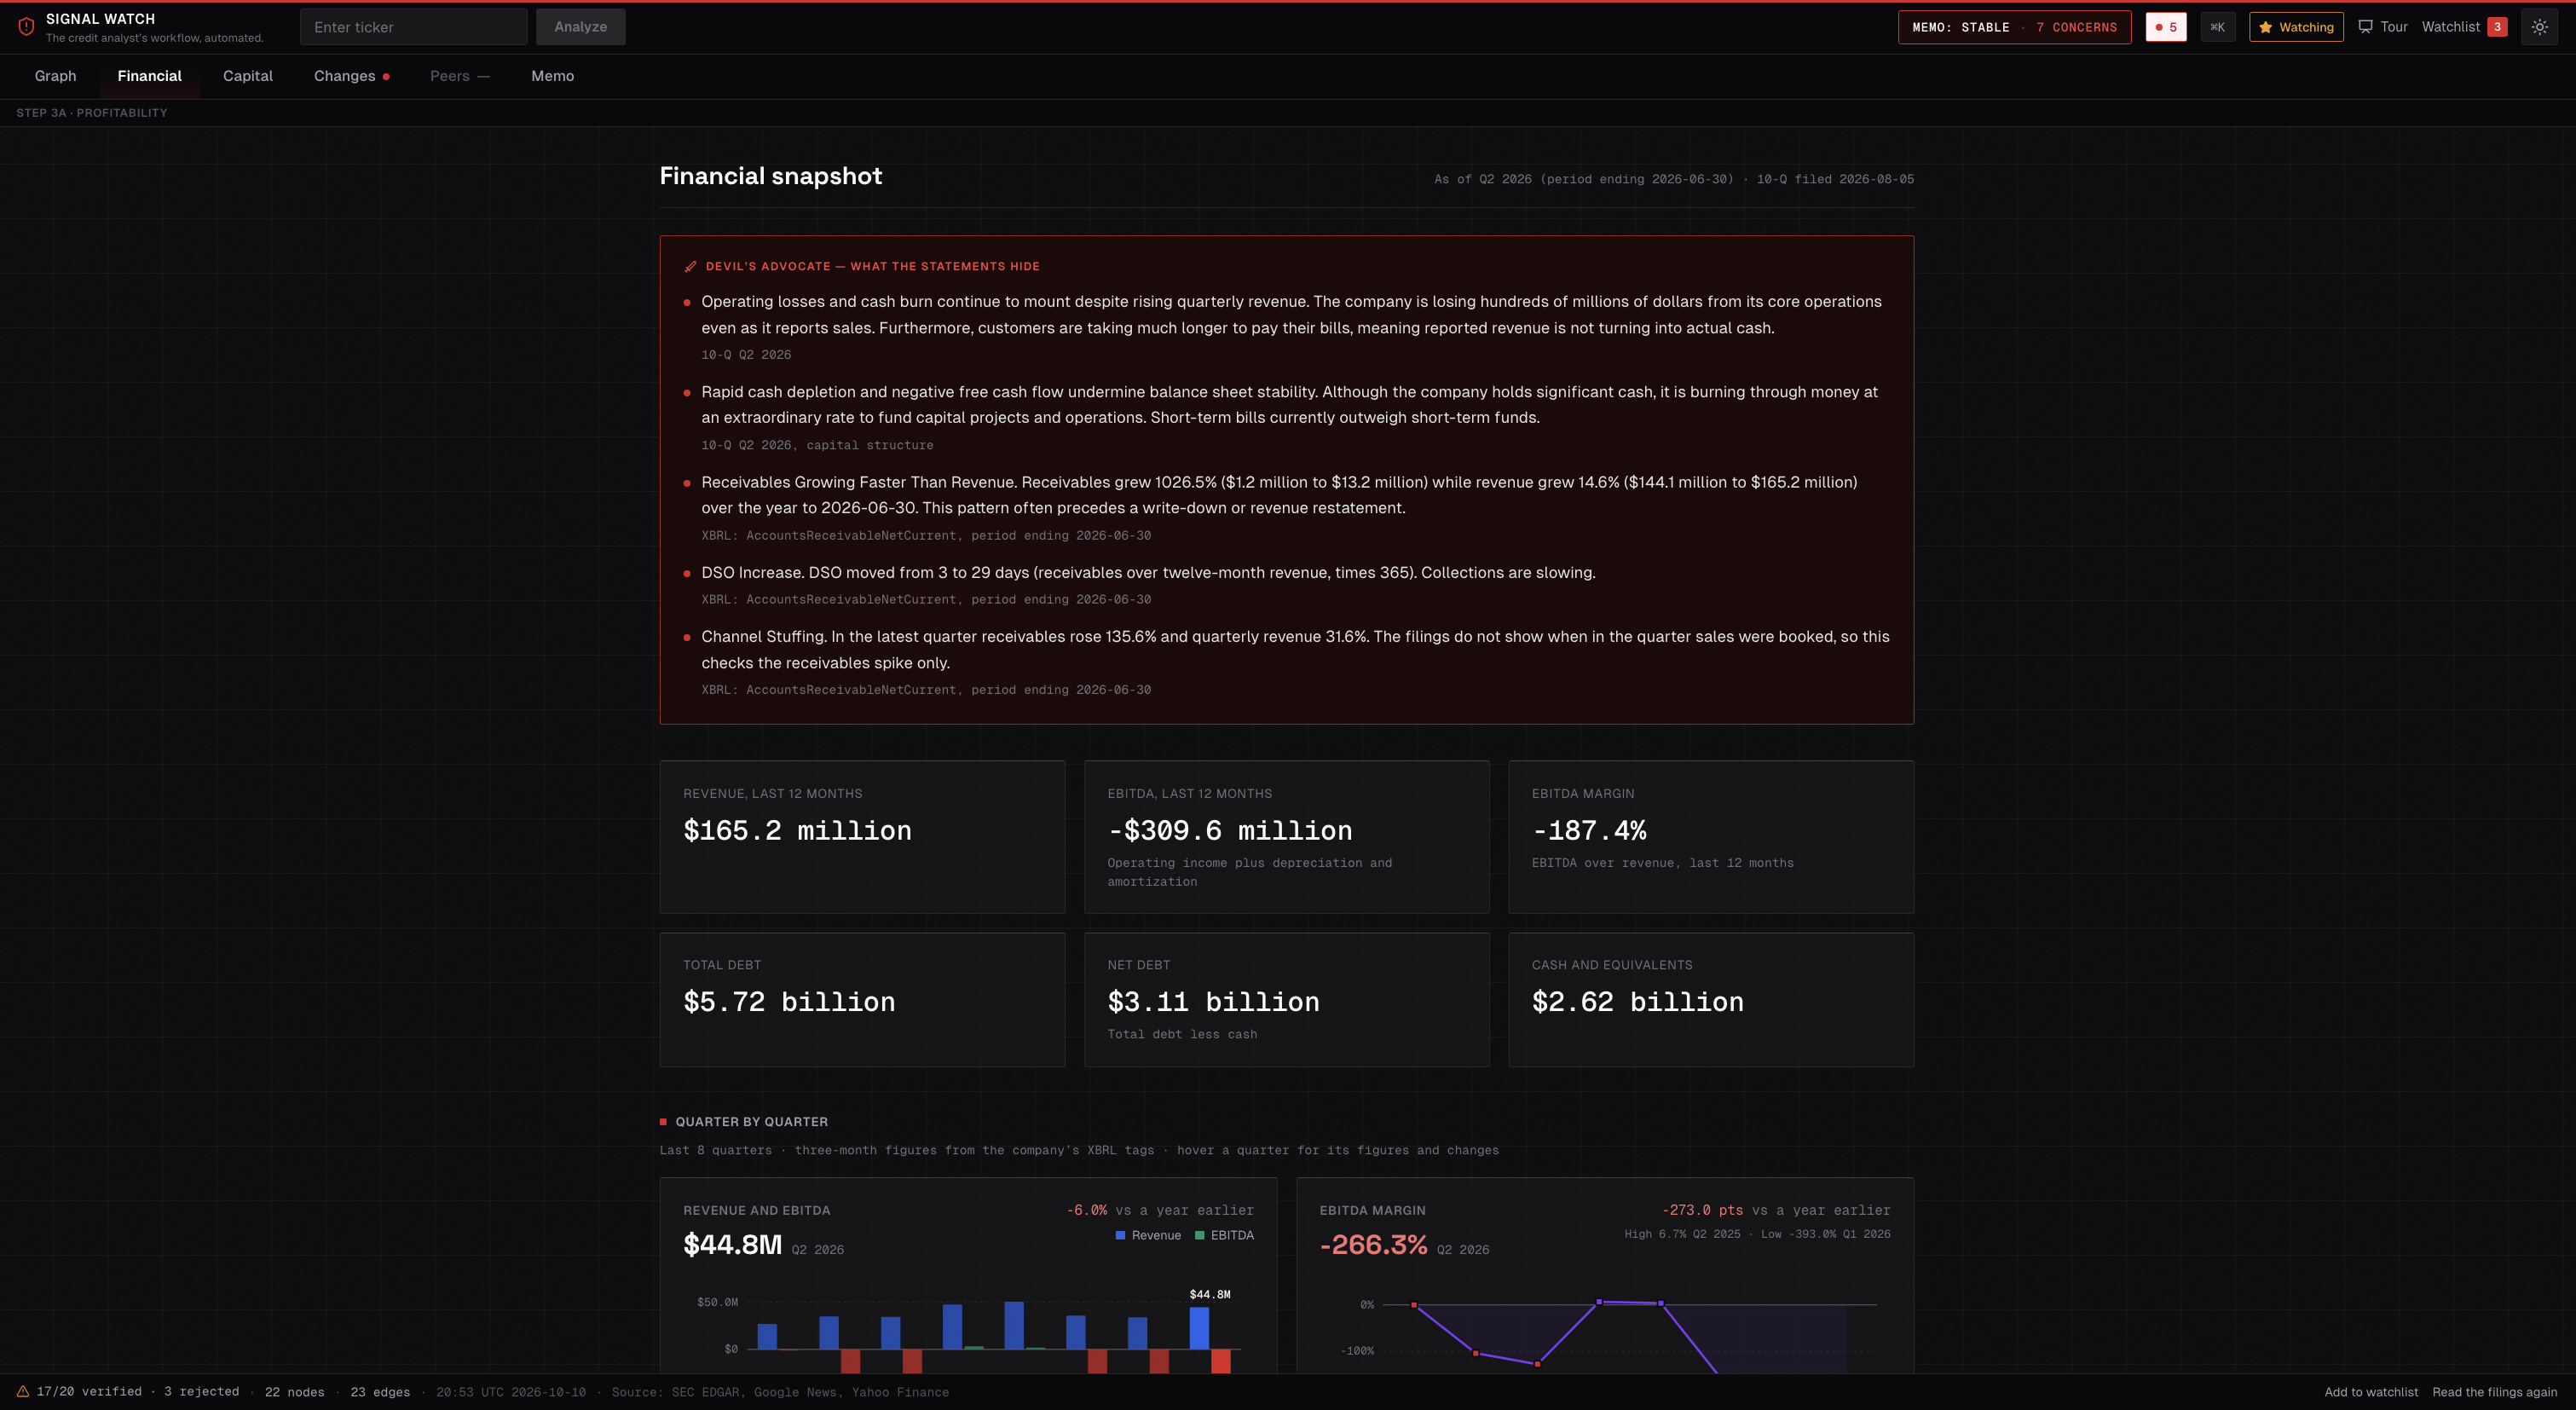
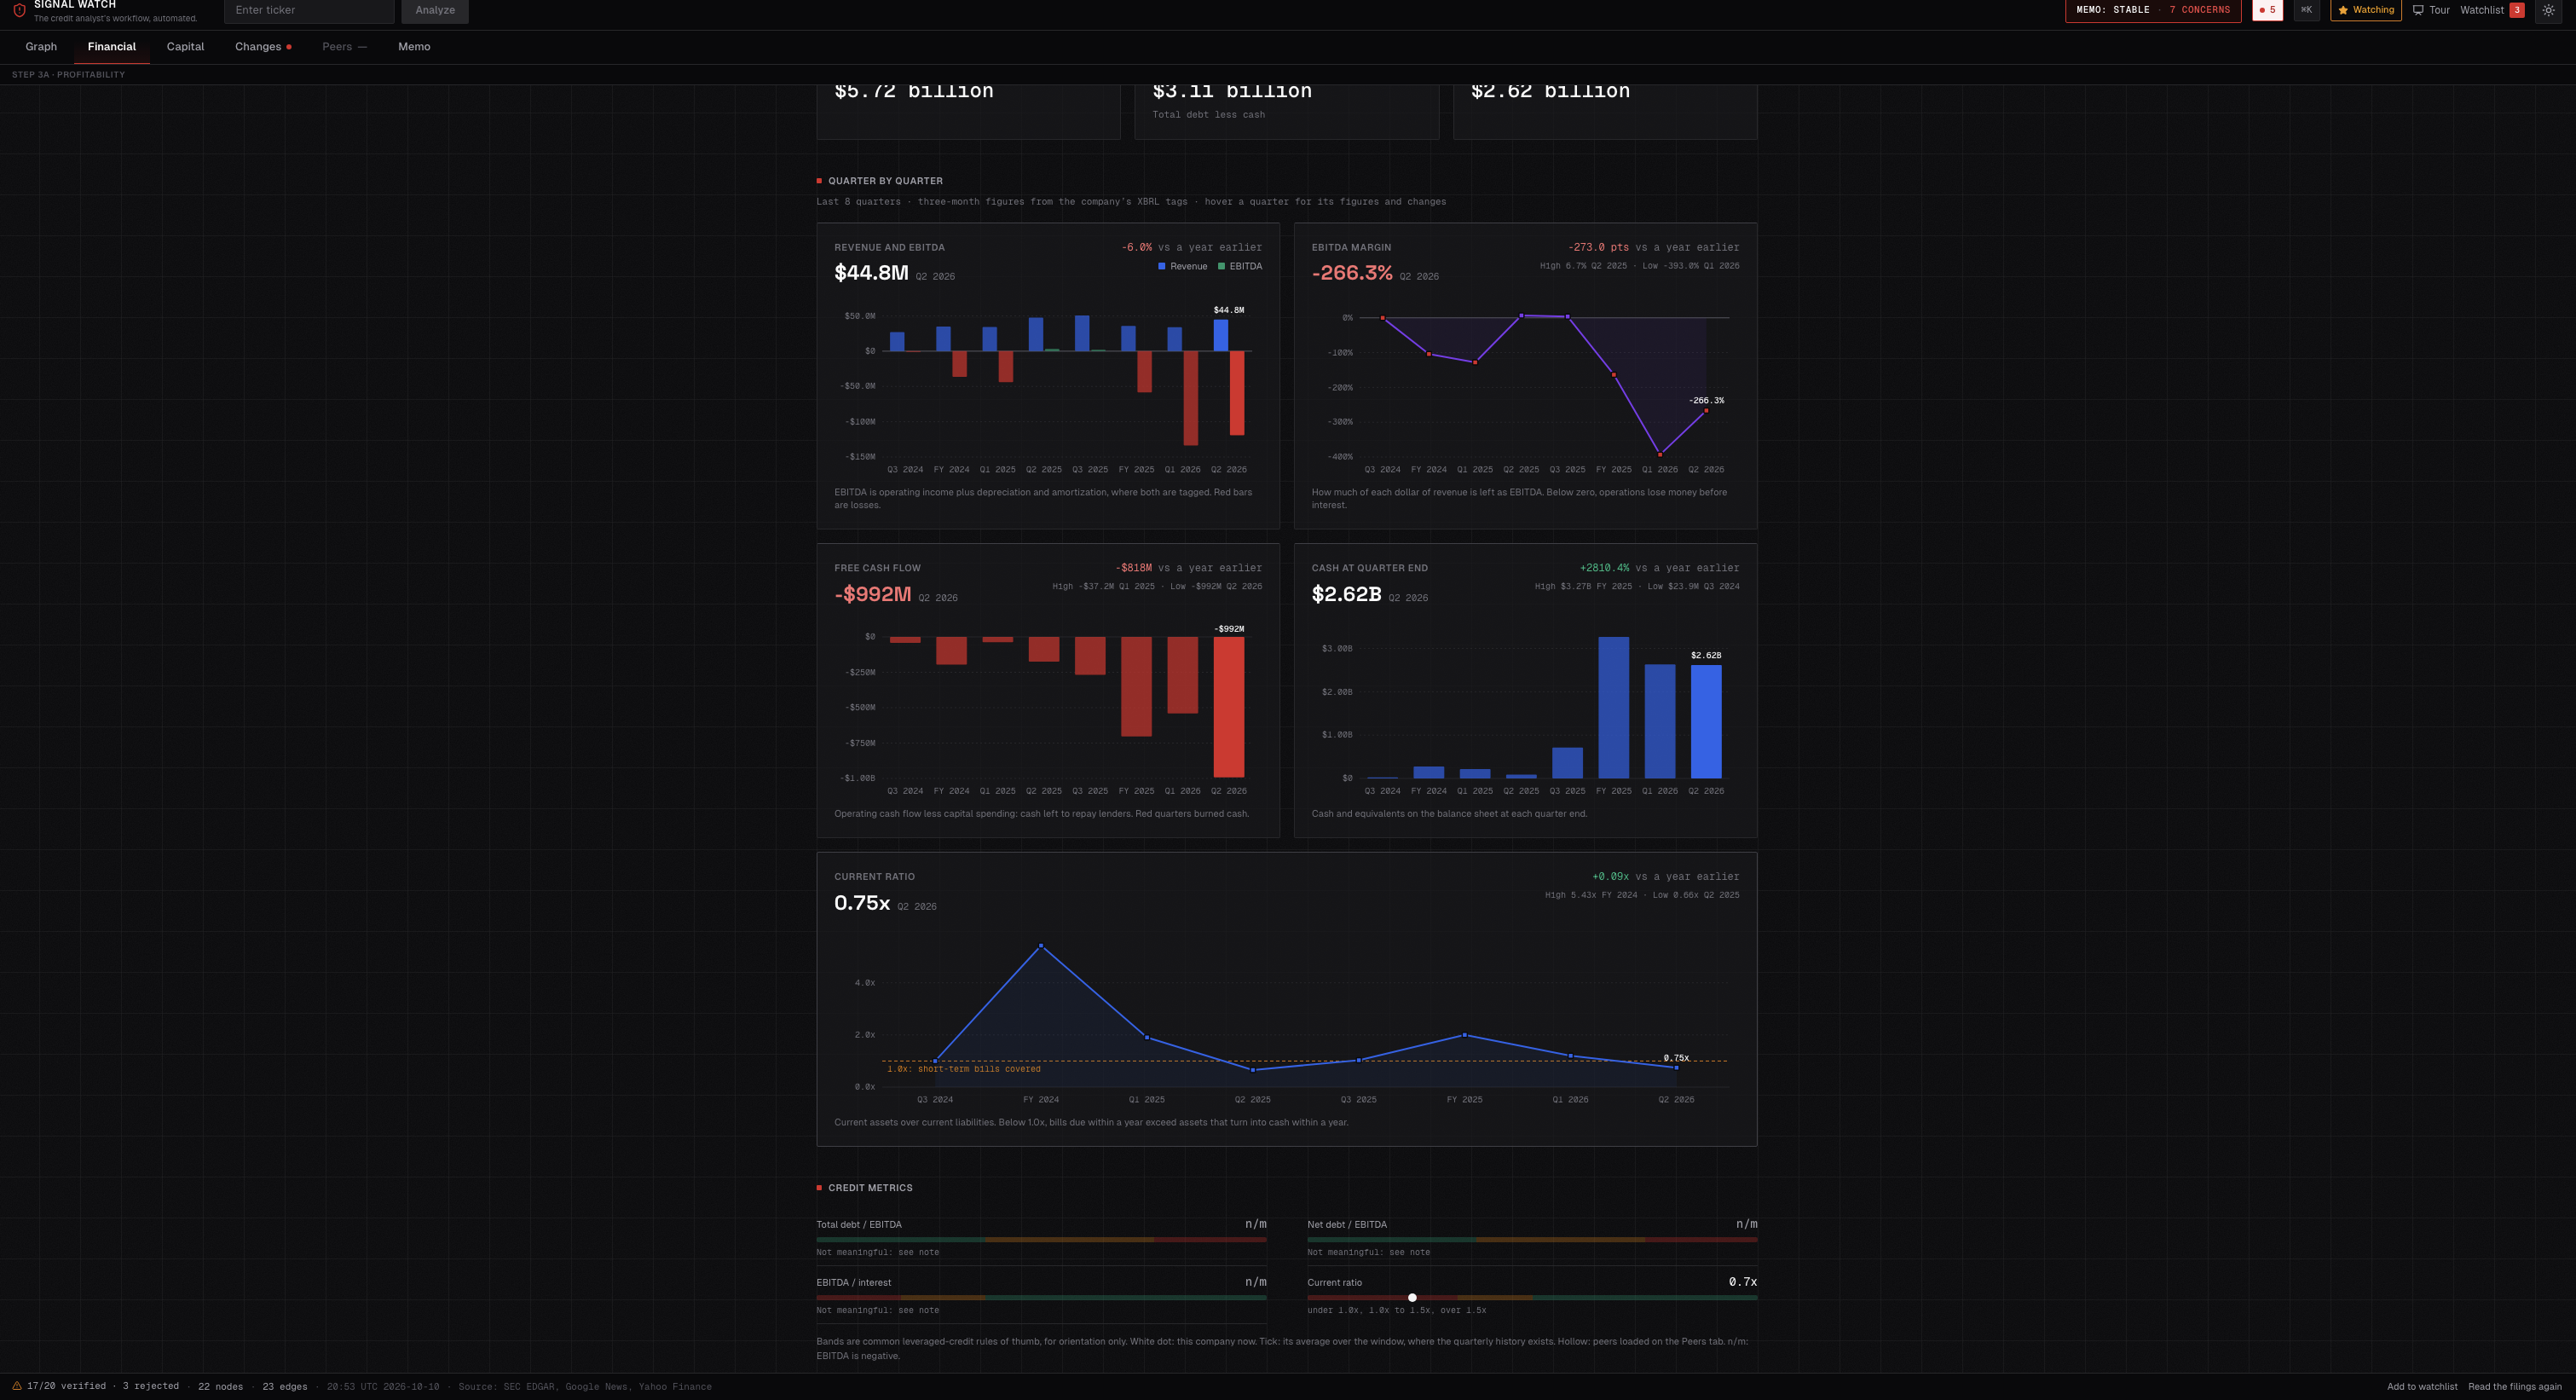
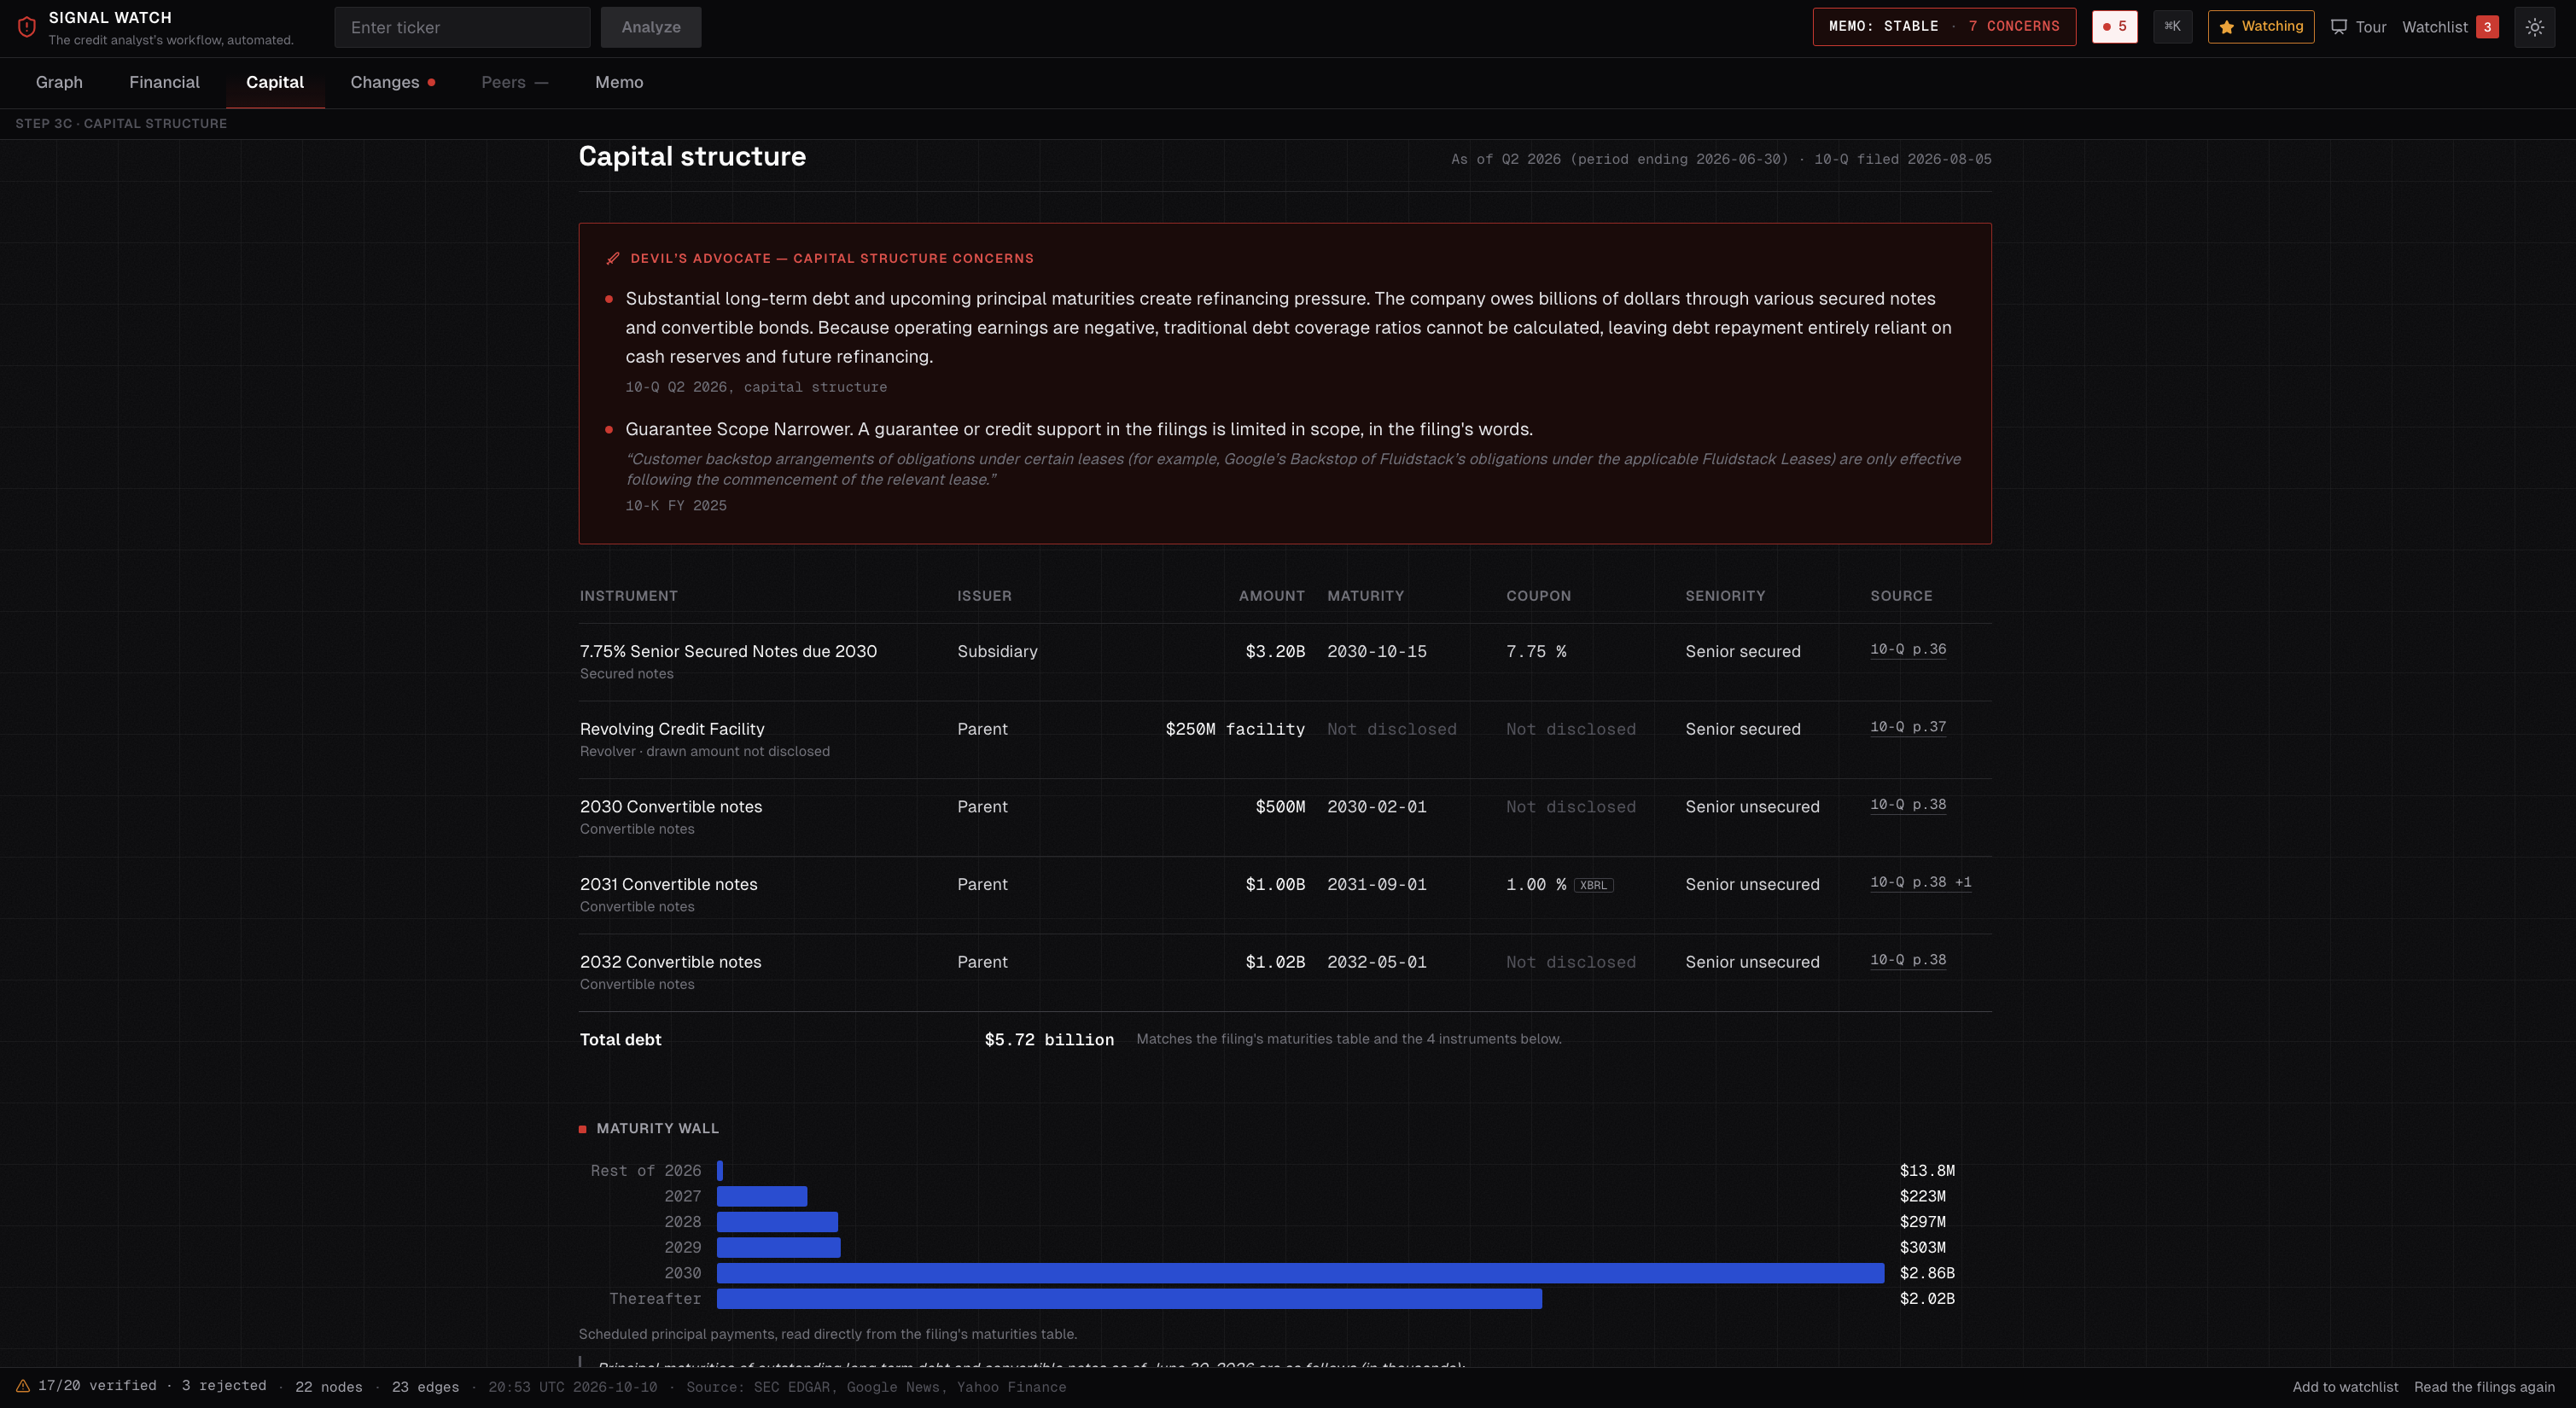
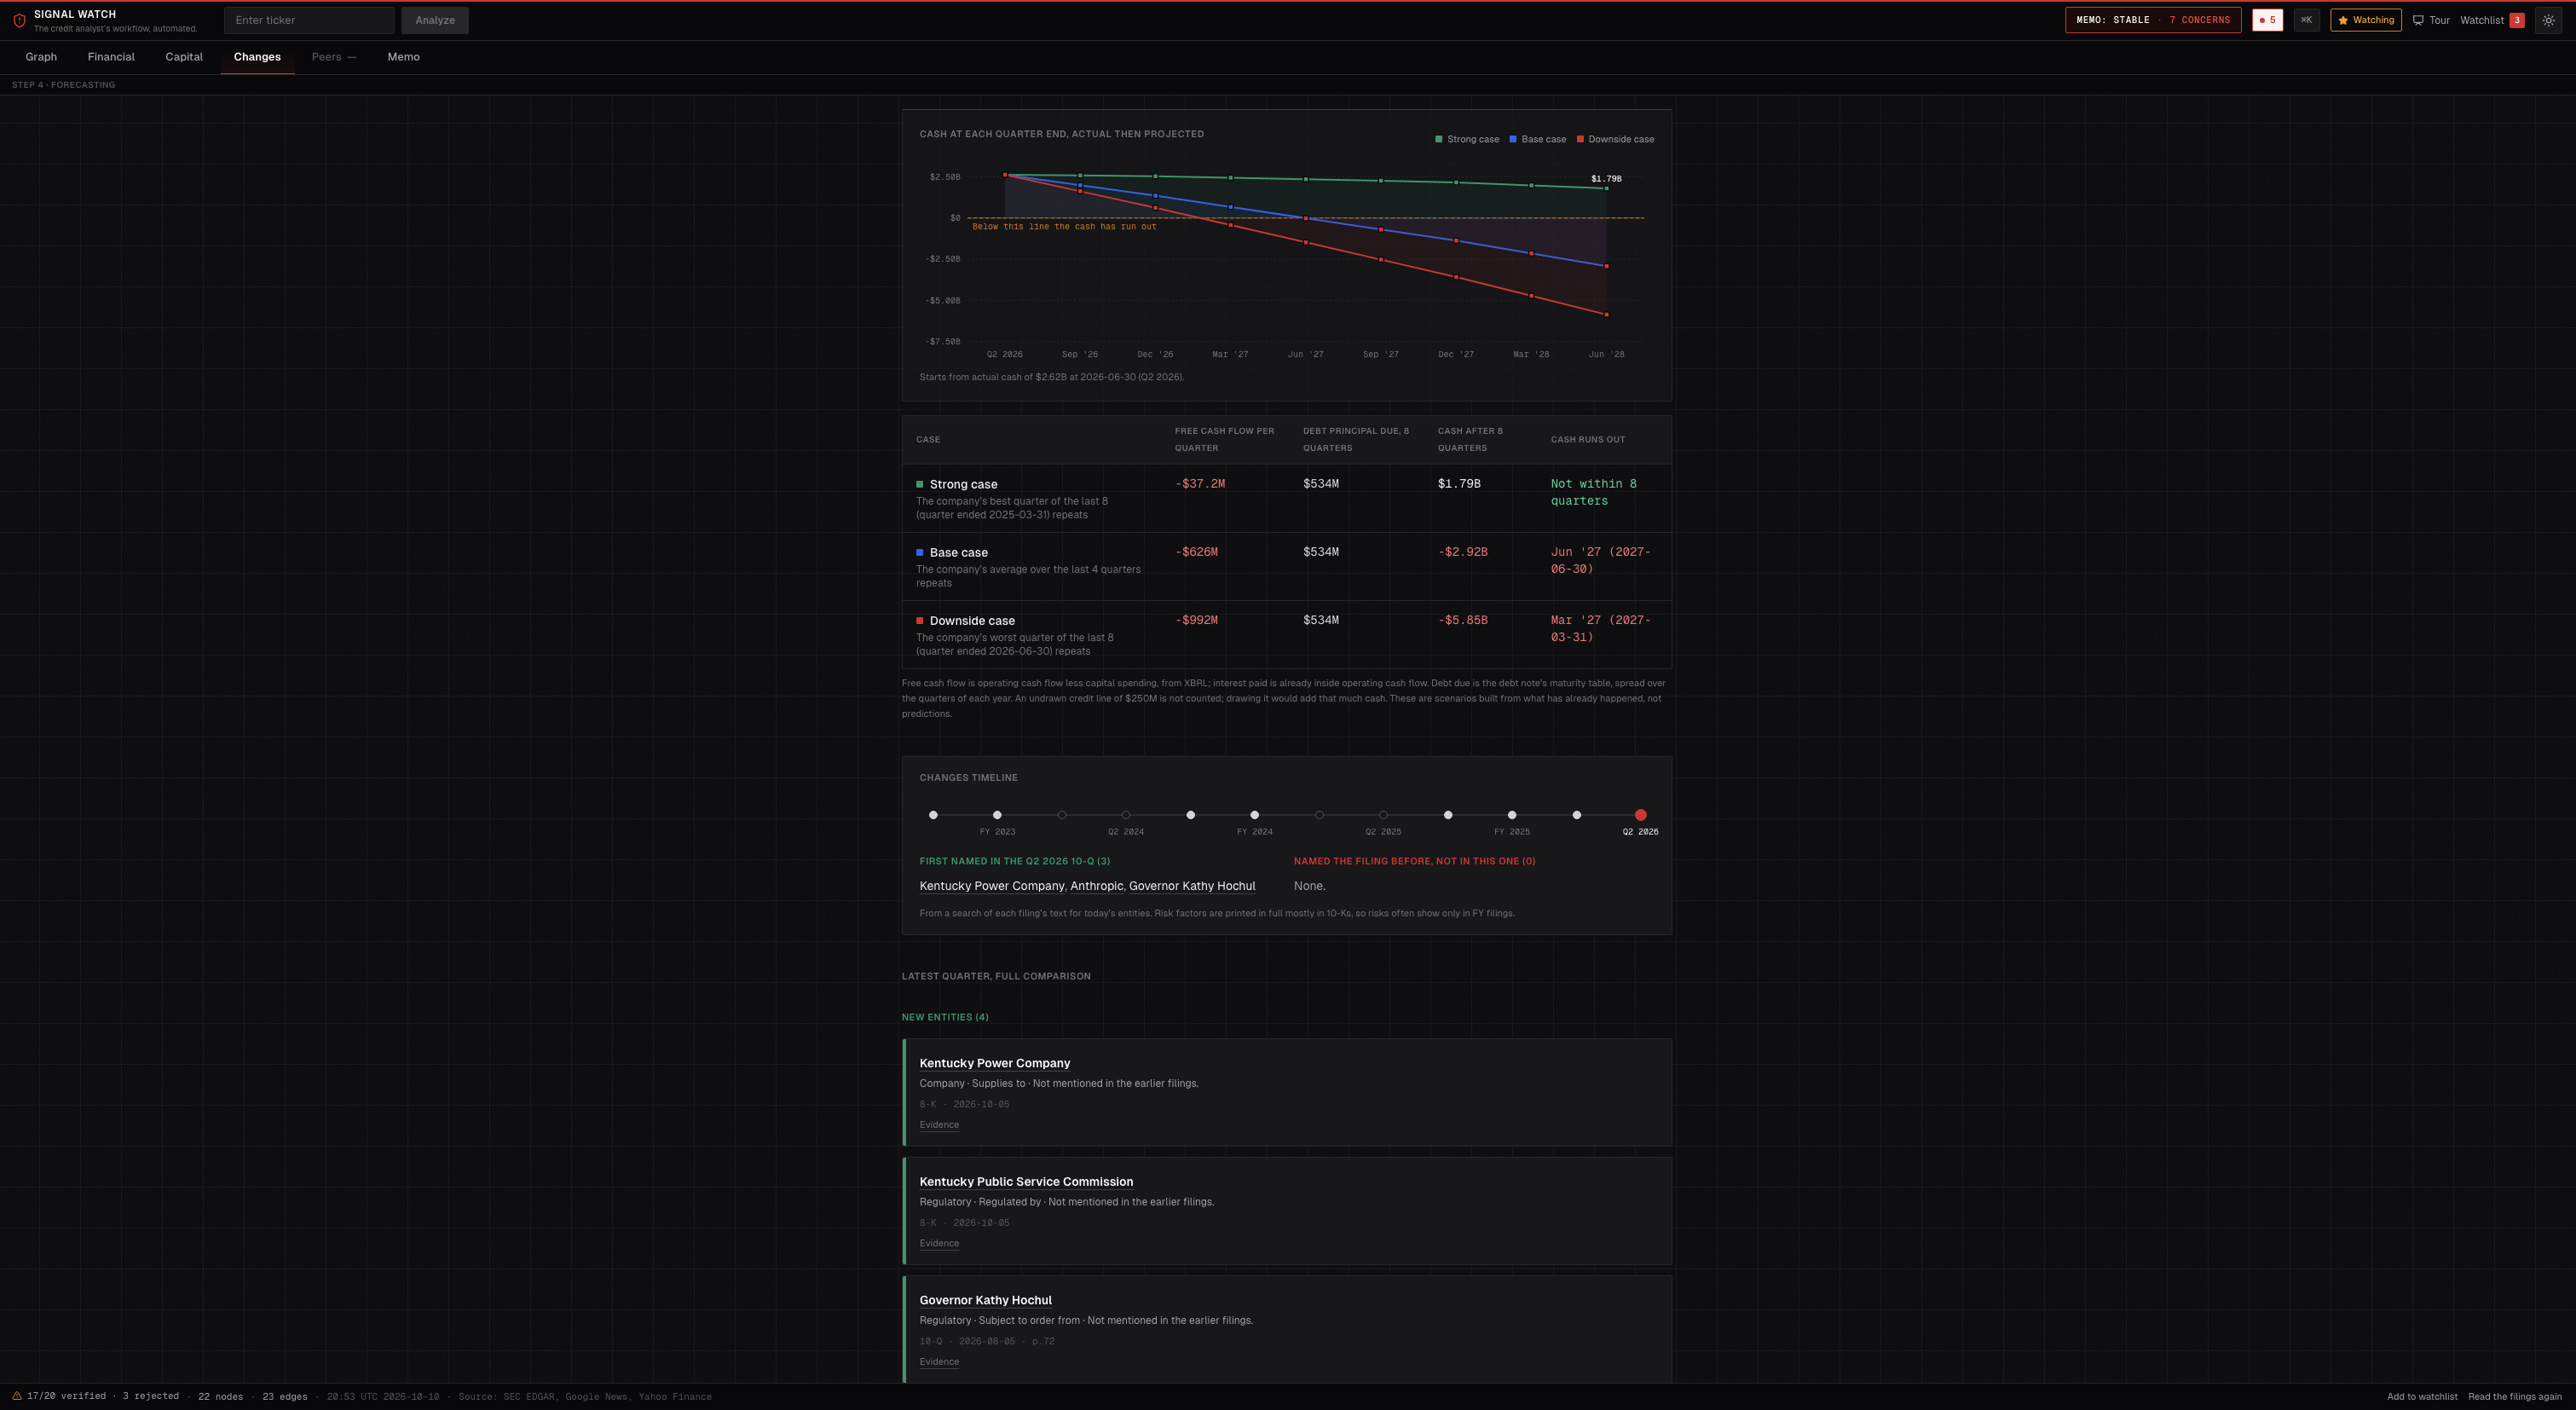
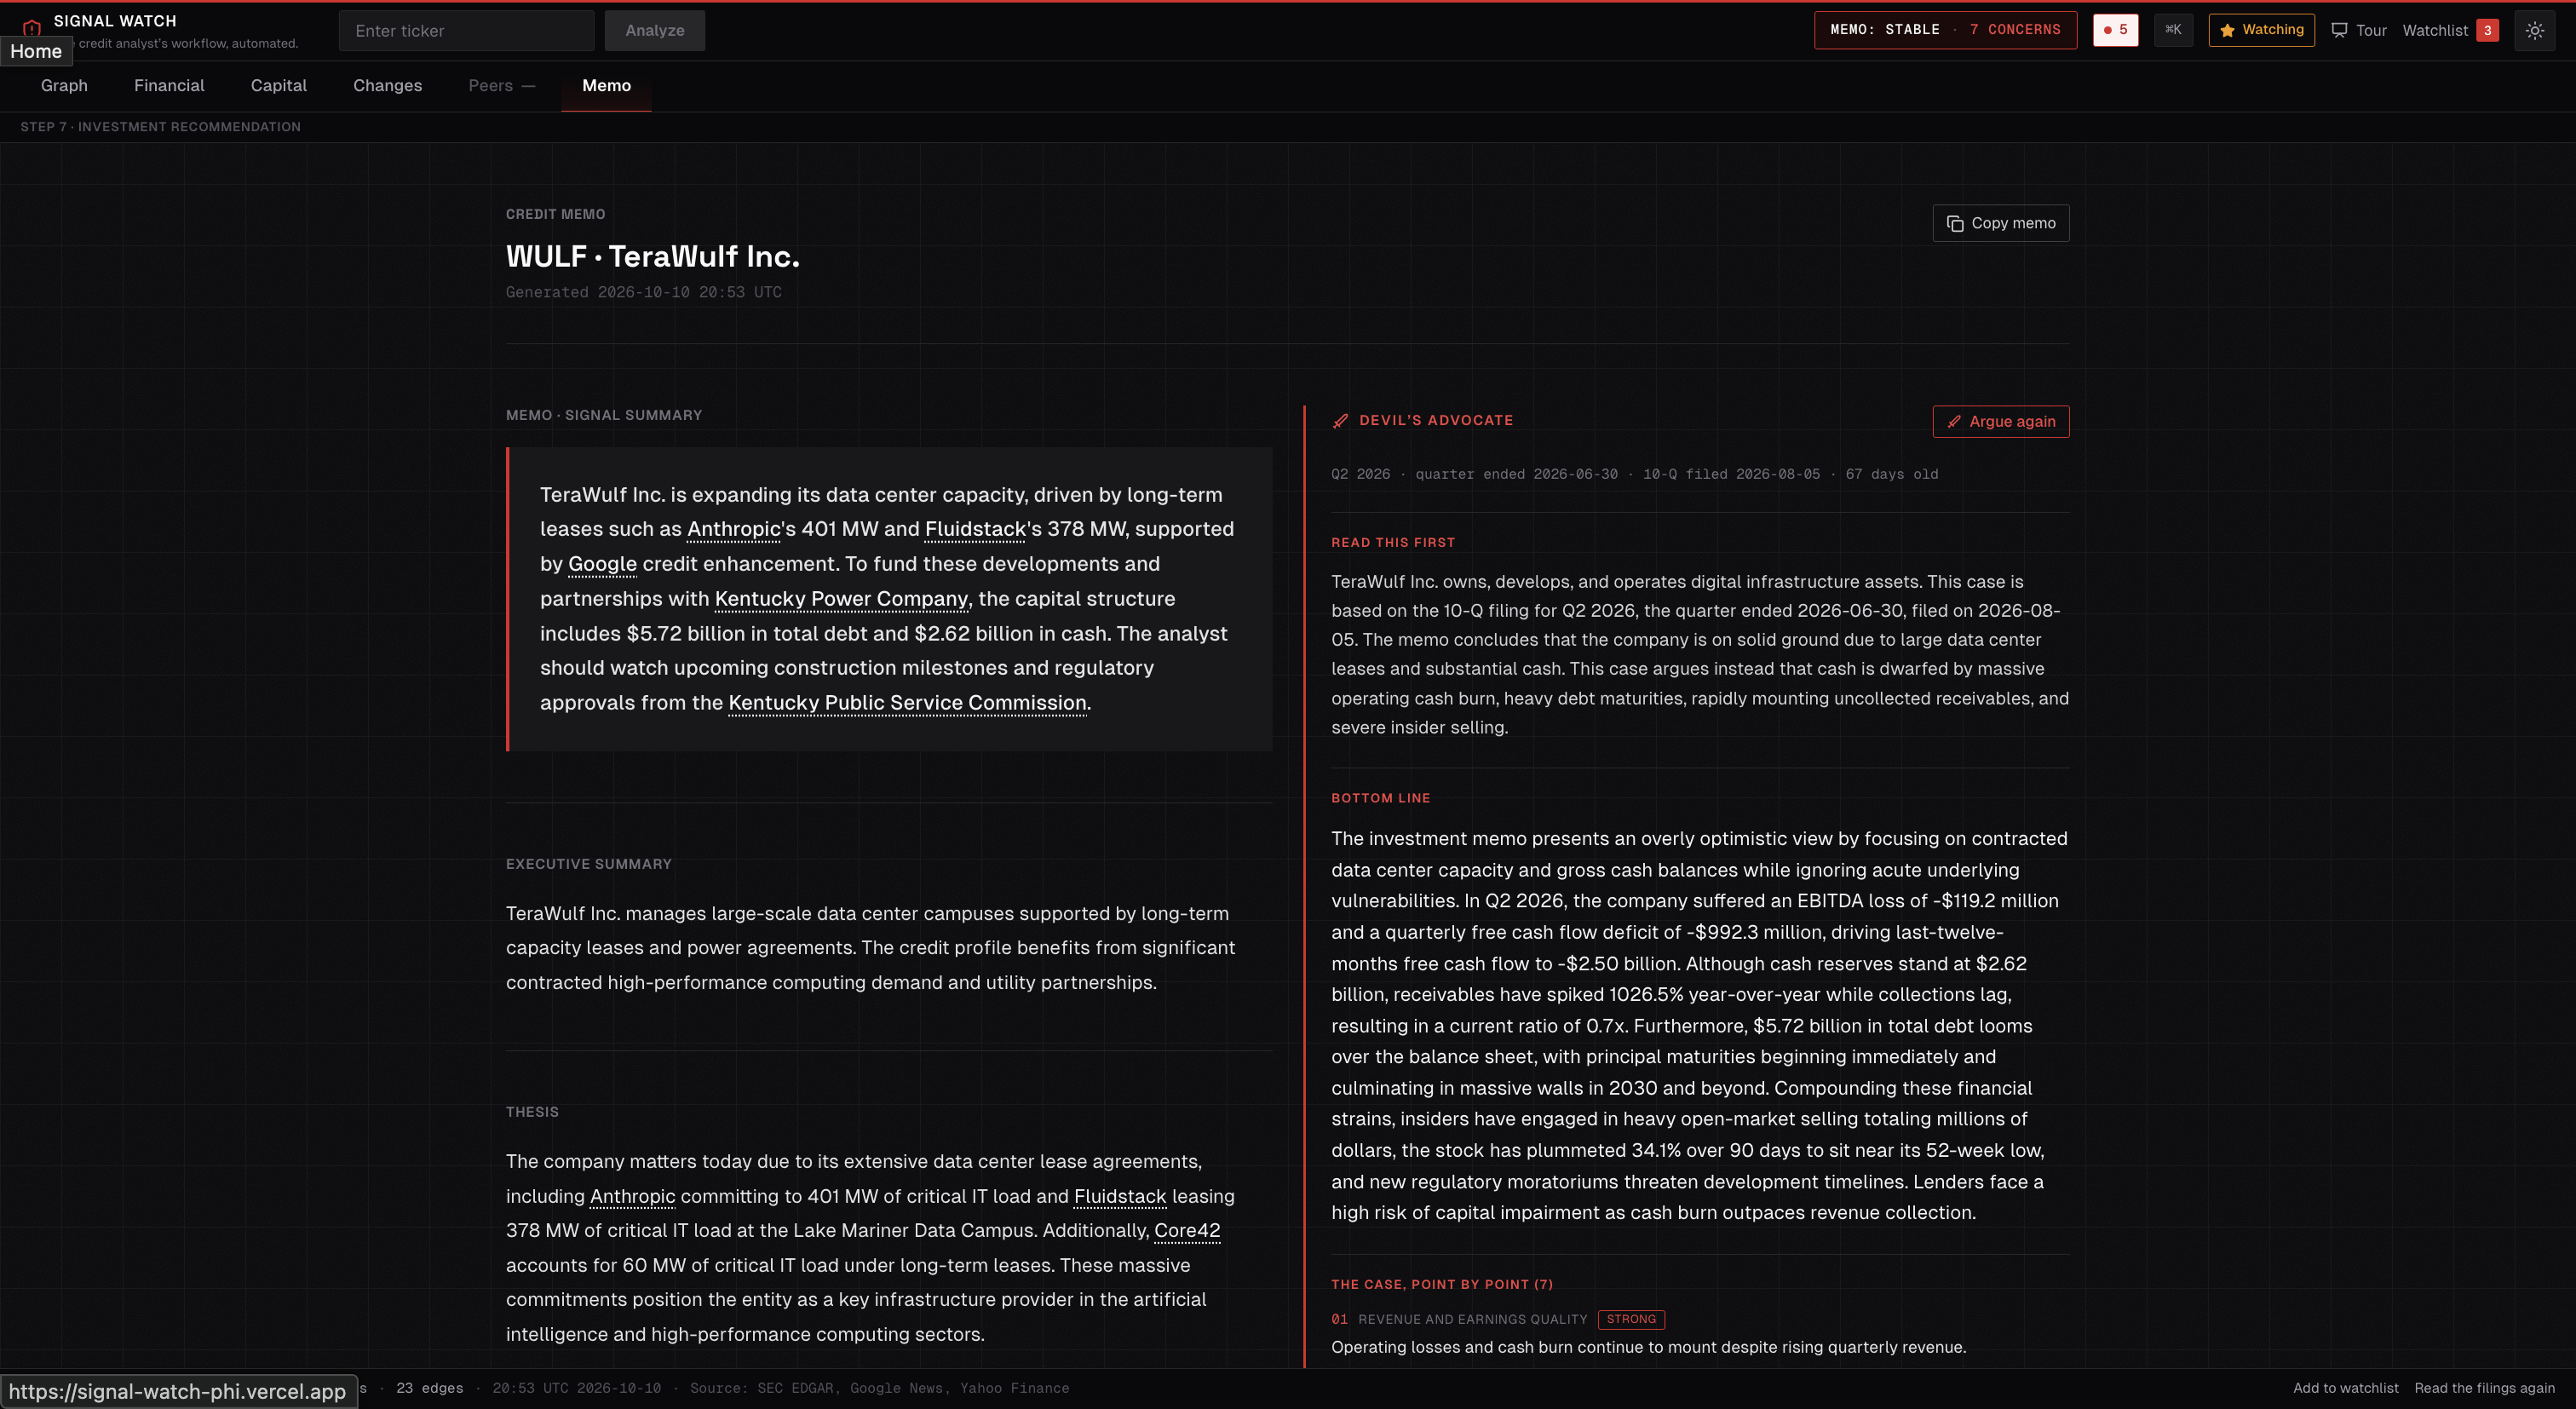
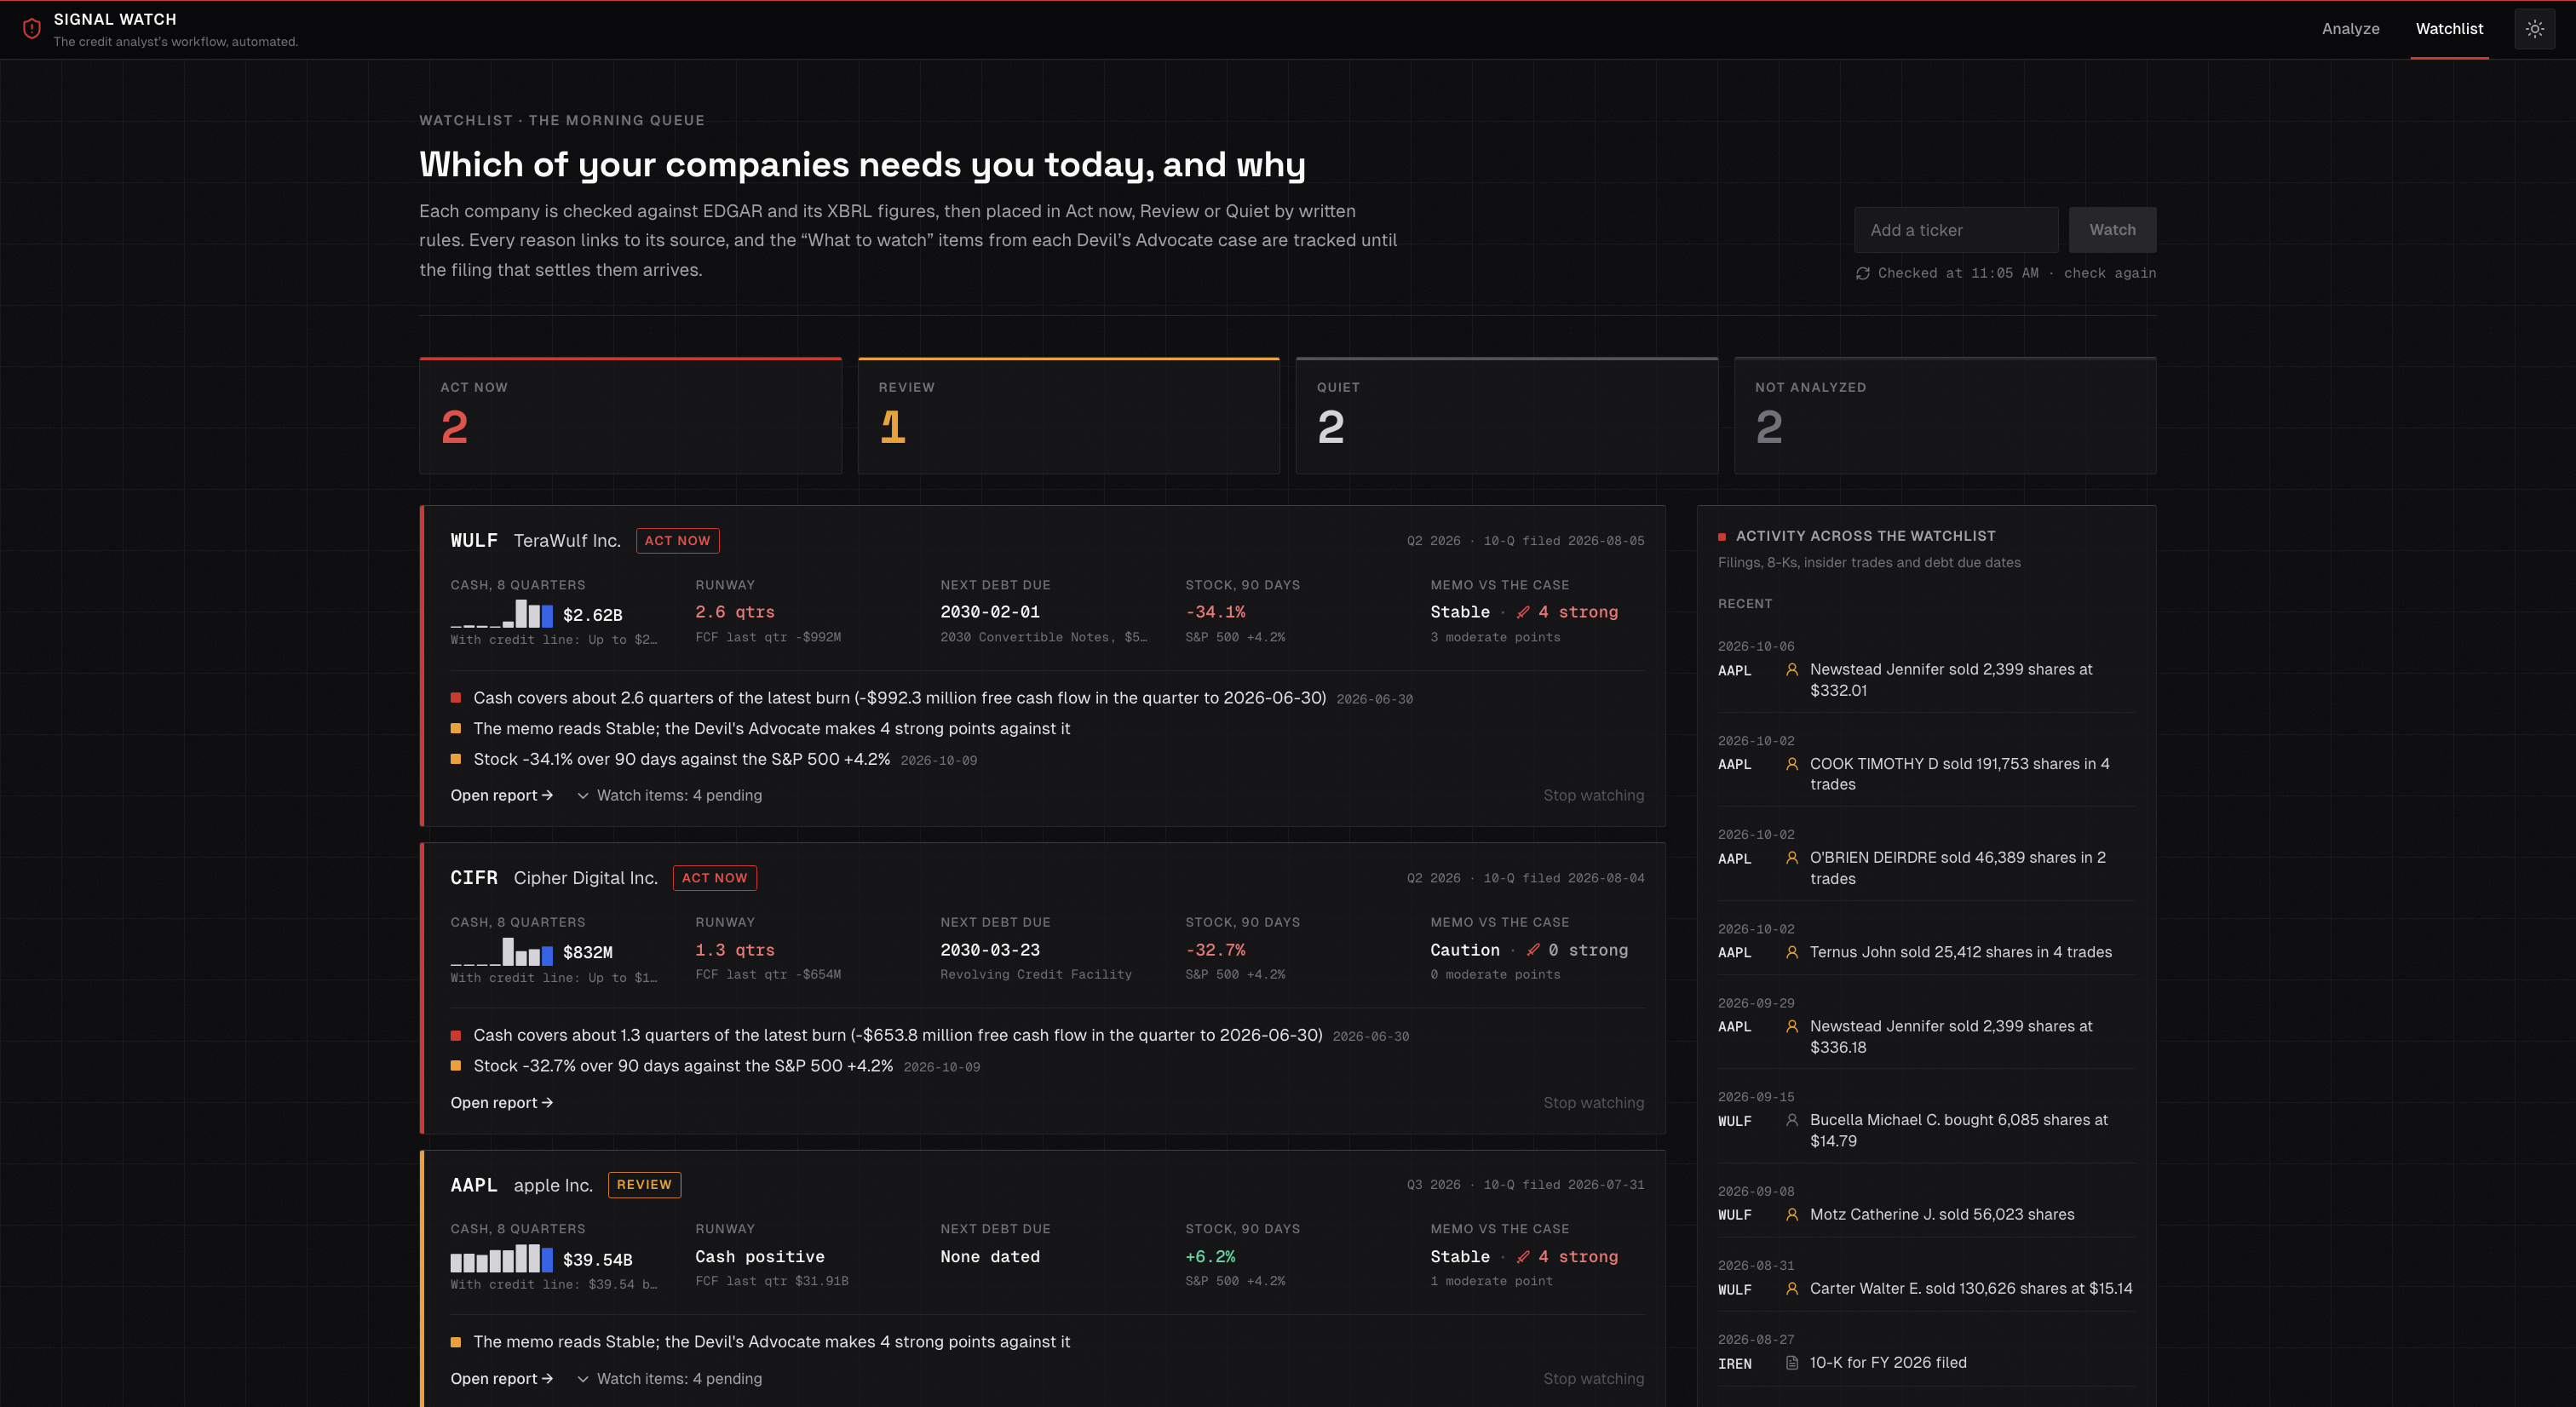
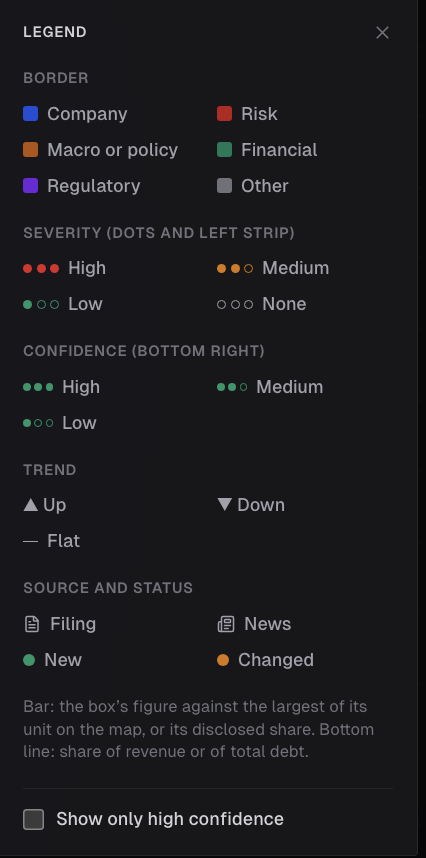
Relationship map. The company sits at the center, surrounded by its customers, lenders, guarantors, regulators, and risks. Line thickness reflects dollar amounts, and debt due within two years is flagged in red. Click any box to see the exact filing sentence it came from. Financials and debt. Eight quarters of revenue, EBITDA, margins, free cash flow, and liquidity, alongside every loan and bond with its rate, seniority, and maturity. Changes and forecast. What's new since last quarter, plus a cash runway forecast under strong, base, and downside cases, computed entirely from the company's own results. Peers. Side by side leverage, coverage, and liquidity against comparable companies. Credit memo. A five section investment memo with every name linked to its evidence. Devil's Advocate. Our centerpiece. It runs 36 red flag checks, then writes the strongest possible case against the memo, with evidence tables and a plain English explanation for every point. Watchlist. Each morning, every followed company is sorted into Act now, Review, or Quiet, with a dated, linked reason for each. Private companies. Analysts can upload credit agreements and lender reports for borrowers that never file publicly.
How we built it
Stack. Next.js 14 (App Router) with strict TypeScript and no any, so a single codebase handles both the UI and the server API routes. Tailwind CSS drives a theme built on CSS variables, React Flow renders the map on a deterministic custom layout (no physics, so the picture is identical every time), and all charts are hand built SVG components. Reports are stored in Tiger Data (managed Postgres) as JSON, while every entity and relationship is also written to node and edge tables so the graph can be queried across companies without a separate graph database. Everything is deployed on Vercel with extended function durations for long AI calls.
Data layer. We pull directly from SEC EDGAR through a shared throttle that keeps us under the SEC's 10 requests per second limit, with caching on every response. Filing HTML is converted to text and split by Item headings so only relevant sections (Risk Factors, MD&A, the debt footnote) reach the model. Financial figures come from XBRL company facts, where we reconcile renamed tags across years and convert year to date values into single quarters by subtraction. Inline XBRL tags fill gaps in coupons, face amounts, and maturities. Insider trading forms, event filing item codes, Google News RSS, and Yahoo Finance prices round out the picture.
AI layer. Google Gemini is called over plain REST with a JSON schema for structured output, retries on overload, and a fallback to a lighter model. We deliberately skipped LangChain, agents, and vector databases, since a retrieval layer risks losing the exact source sentence, which is the whole point. Gemini runs entity extraction and debt footnote parsing in parallel, then drafts the memo.
Verification layer. This is what makes the output trustworthy. Every entity must quote a sentence we can locate in the source document, allowing for whitespace and punctuation differences, or it is rejected. Every number in a label must appear in its quote. Any generated sentence containing a figure not present in the supplied facts is deleted automatically. Ranking words like "largest" or "sole" are stripped unless the filing itself uses them.
Devil's Advocate pipeline. Before the model writes anything, our code runs 36 checks (receivables versus revenue, days sales outstanding, covenant headroom, maturity concentration, guarantee scope, subordination, insider selling clusters, auditor changes, hidden supplier finance, and more), each returning fired, clear, or not evaluated. Code then assembles evidence tables with eight quarters of data and quarter over quarter and year over year changes already computed, so the model never does math. Gemini writes eight themed sections from that evidence, and citations are resolved by code, never written by the model.
Delivery. The analysis endpoint streams newline delimited JSON events so the UI shows live progress during a 15 to 40 second run, and the URL holds the full app state so any view can be shared as a link.
Challenges we ran into
The biggest challenge was making an AI system trustworthy enough for decisions involving real money. Language models are fluent, and that fluency makes invented numbers dangerously convincing. We addressed this with layered verification at every stage, and we went further in the Devil's Advocate by rejecting hedging words like "likely" and "probably," retrying generation when too many sentences failed validation, and keeping the stronger attempt.
Financial data turned out to be far messier than we expected. Companies rename XBRL tags across years, so a revenue series can quietly break mid history. Debt footnotes follow no standard format, and large banks like JPMorgan report debt only by category, which required detecting those cases and labeling them as aggregate rather than forcing them into a per bond structure. We also hit false positives in our red flag checks, such as an accounting policy sentence being read as a change in estimate, and fixed each one by tightening the rule against real filings.
Accomplishments that we're proud of
The moment we knew the project worked was when we ran it on TeraWulf. The memo, written from the company's own filings, concluded "Stable." The Devil's Advocate, reading those same filings, found that Google's backstop on TeraWulf's leases only takes effect once each lease begins, meaning the construction period, the riskiest stretch of the project, isn't covered. It also surfaced receivables up 1026.5% year over year, free cash flow of negative $992.3 million in a single quarter, and three insiders selling within weeks of each other.
We're also proud that the system is honest about its own limits. The status bar reports exactly how many AI findings failed verification, the app says "not disclosed" instead of guessing, and checks without enough data are shown as not evaluated rather than quietly passing. Everything runs on free, public data, so a fund could try it tomorrow.
What we learned
In finance, credibility matters more than features. A polished chart that can't be traced to a source gets ignored, while a plain sentence linked to the exact page of a filing gets acted on. Showing our own rejected findings, which felt risky at first, turned out to be one of the most persuasive parts of the product.
We also learned where AI belongs in a system like this. The model is excellent at reading and drafting but should never be trusted with facts or arithmetic. Splitting the work so the model reads and code verifies made the results faster, cheaper, and far easier to defend. Finally, building around a framework analysts already use made the product feel familiar from the very first click.
What's next for Signal Watch
Adding bond prices and spreads so the market view reflects lenders, not just shareholders. Backtesting the 36 checks against a labeled set of past defaults to measure how early they would have fired. Extracting covenants and collateral terms directly from credit agreements. Expanding valuation with DCF, precedent transactions, and liquidation analysis to complete the full seven step process.
Built With
- google-gemini
- next.js
- node.js
- postgresql
- reactflow
- secedgar
- tailwind-css
- tiger-data
- typescript
- vercel
- xbrl

Log in or sign up for Devpost to join the conversation.