Signal Atlas
Inspiration
Analysts tracking global instability drown in noise thousands of articles, social posts, and reports daily across dozens of sources. No single tool connects the dots between an RSF attack headline on Reuters, a displacement thread on Bluesky, and a satellite imagery post on X. We wanted to build the screen an analyst walks up to at 2 AM and immediately knows where the world is on fire, why, and what to watch next.
What it does
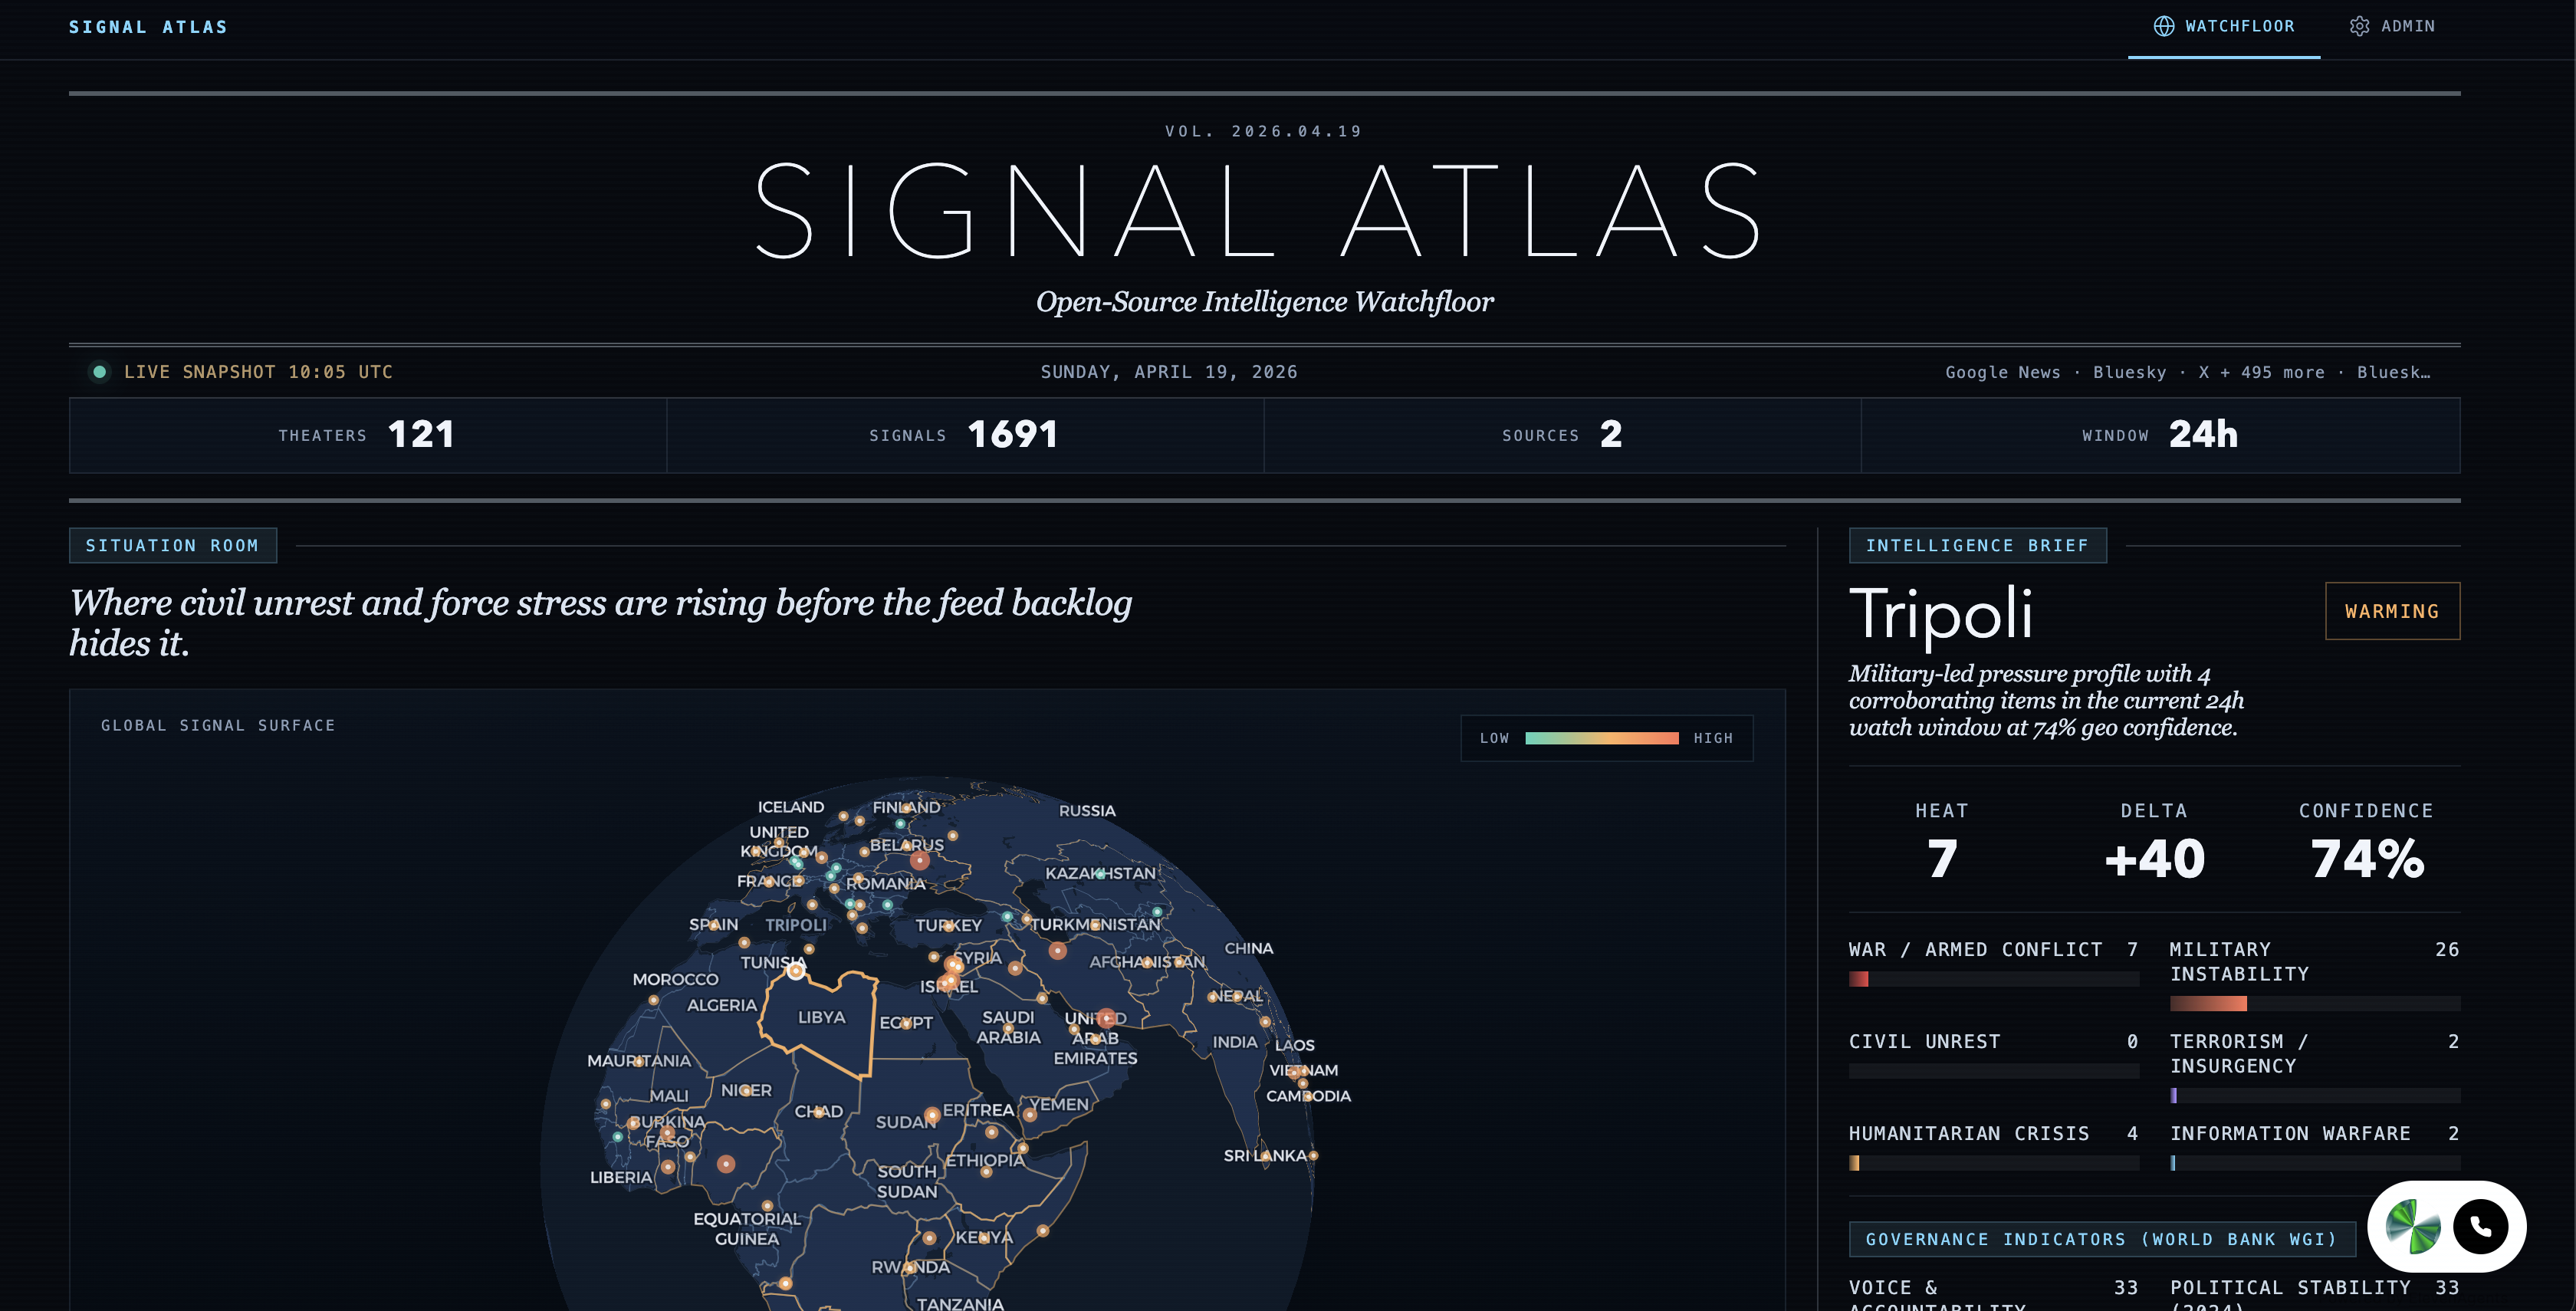
Signal Atlas is a real-time OSINT watchfloor that ingests live feeds from Google News, RSS, Bluesky, and X, then geolocates, classifies, and scores every signal across six threat categories war, military, civil unrest, terrorism, humanitarian crisis, and information warfare. The result is an interactive globe where hotspots glow by severity, trend arrows show escalation or de-escalation, and an intelligence brief panel breaks down the evidence behind every score. An ElevenLabs voice agent lets analysts query the map conversationally "What's trending in the Middle East?" and get answers from live data.
How we built it
- Frontend: Svelte 5 + MapLibre GL rendering a dark-themed globe with heat-colored hotspots, sparkline trend histories, and evidence cards. TailwindCSS for styling, Vite for builds.
- Backend: FastAPI orchestrating scrapers for four source families, with a keyword-driven classifier for signal categorization and Groq (Llama 3.3 70B) for LLM-powered intelligence summaries.
- Geocoding: A hybrid system a curated 130-entry gazetteer for known conflict zones and military shorthand (RSF → Sudan, IRGC → Iran), with an OpenStreetMap Nominatim fallback for everything else, backed by an LRU cache.
- Voice Agent: ElevenLabs Convai widget embedded in the UI, calling four FastAPI tool endpoints hotspot lookup, trending, search, and compare that serve live scored data.
- Scoring: Configurable multi-dimensional heat scores blending recency decay, severity, source corroboration, and geolocation confidence. All weights tunable from an admin panel at runtime.
- Development: Claude Code as a pair-programming partner throughout architecting the tool endpoints, implementing the hybrid geocoder, and iterating on scoring logic.
Challenges we ran into
- Geocoding coverage vs. speed: A full geocoding API for every article is slow and rate-limited. A static gazetteer is fast but misses anything outside conflict zones Las Vegas literally disappeared from the map. The hybrid approach solved both, but getting the confidence scoring right so Nominatim results don't outrank curated gazetteer entries took iteration.
- Signal noise: Social media produces enormous volumes of low-quality matches. We had to build de-escalation dampening, single-source penalties, and confidence-based rollup (low-confidence cities aggregate to country level) to keep the map useful instead of overwhelming.
- Voice agent tool design: ElevenLabs agent tools need to return concise, speakable responses from complex geopolitical datasets. Balancing data richness with conversational brevity meant careful response shaping in the tool endpoints.
- Scoring transparency: Making a blended multi-category score that's both analytically useful and explainable to a human. Every score needed to show why which keywords, which sources, which trend direction.
Accomplishments that we're proud of
- An analyst can go from zero to situational awareness in 60 seconds. Open the watchfloor, see the top three hotspots, click one, read the evidence, check the trend... done.
- The voice agent actually works. Asking "compare Sudan and Ukraine" and hearing a spoken intelligence brief from live data feels like the future of analyst tooling.
- Every score is transparent and configurable. No black box. Analysts see driver keywords, confidence percentages, source families, and trend sparklines. They can tune weights from the admin panel without redeploying.
- The hybrid geocoder. Fast for the a lot of the case (known conflict zones), comprehensive for the long tail, with caching to stay within API limits. A city that wasn't in our gazetteer yesterday works today.
- Built the entire stack in a hackathon. Four data sources, six classification categories, a scoring engine, a voice agent, an interactive globe, and an admin panel.
What we learned
- Confidence scoring is harder than classification. Deciding how sure you are about a geolocation or threat category matters more than the label itself it's what determines whether a signal shows up on the map or gets filtered out.
- De-escalation is a signal, not the absence of signal. Peace talks, ceasefires, and diplomacy keywords are active indicators that should dampen scores, not be ignored. Building this in changed the quality of the output dramatically.
- Voice interfaces need different data shapes. What works on a dashboard (tables, sparklines, color ramps) doesn't work when spoken aloud. We had to rethink how to compress geopolitical context into 15-second spoken responses.
- Configurable beats clever. Instead of perfecting keyword lists or scoring weights ourselves, making everything tunable via the admin panel lets domain experts the actual analysts, dial it in for their mission.
What's next for Signal Atlas
- LLM-powered classification: Supplement keyword matching with an LLM classifier that understands context "troops withdrew" is de-escalation, not military activity, but keyword matching can't tell the difference.
- Source credibility scoring: Not all sources are equal. A Reuters article should carry more weight than an anonymous Bluesky post. We want to build source reputation into the corroboration model.
- Collaborative annotations: Let analysts pin notes, flag false positives, and share assessments across a team — turning Signal Atlas from a monitoring tool into a shared intelligence workspace.
- Mobile-first redesign: Having a fast mobile first design.
Built With
- cloudflare
- llama
- python
- svelete


Log in or sign up for Devpost to join the conversation.