-
-
Logo
-
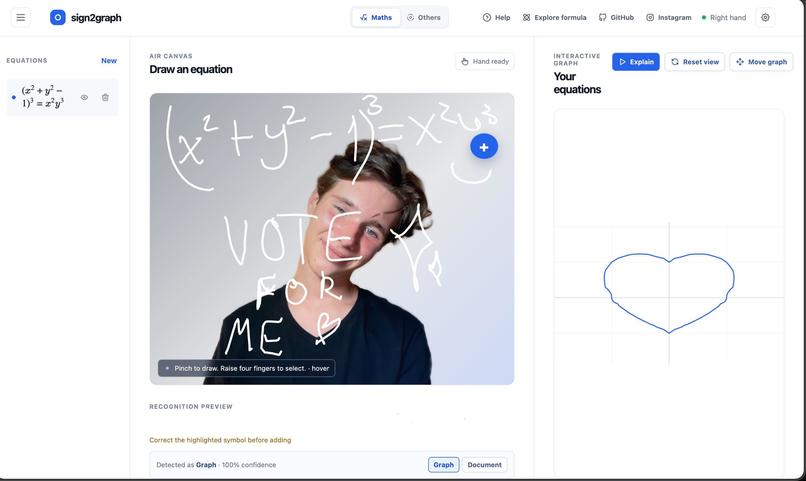
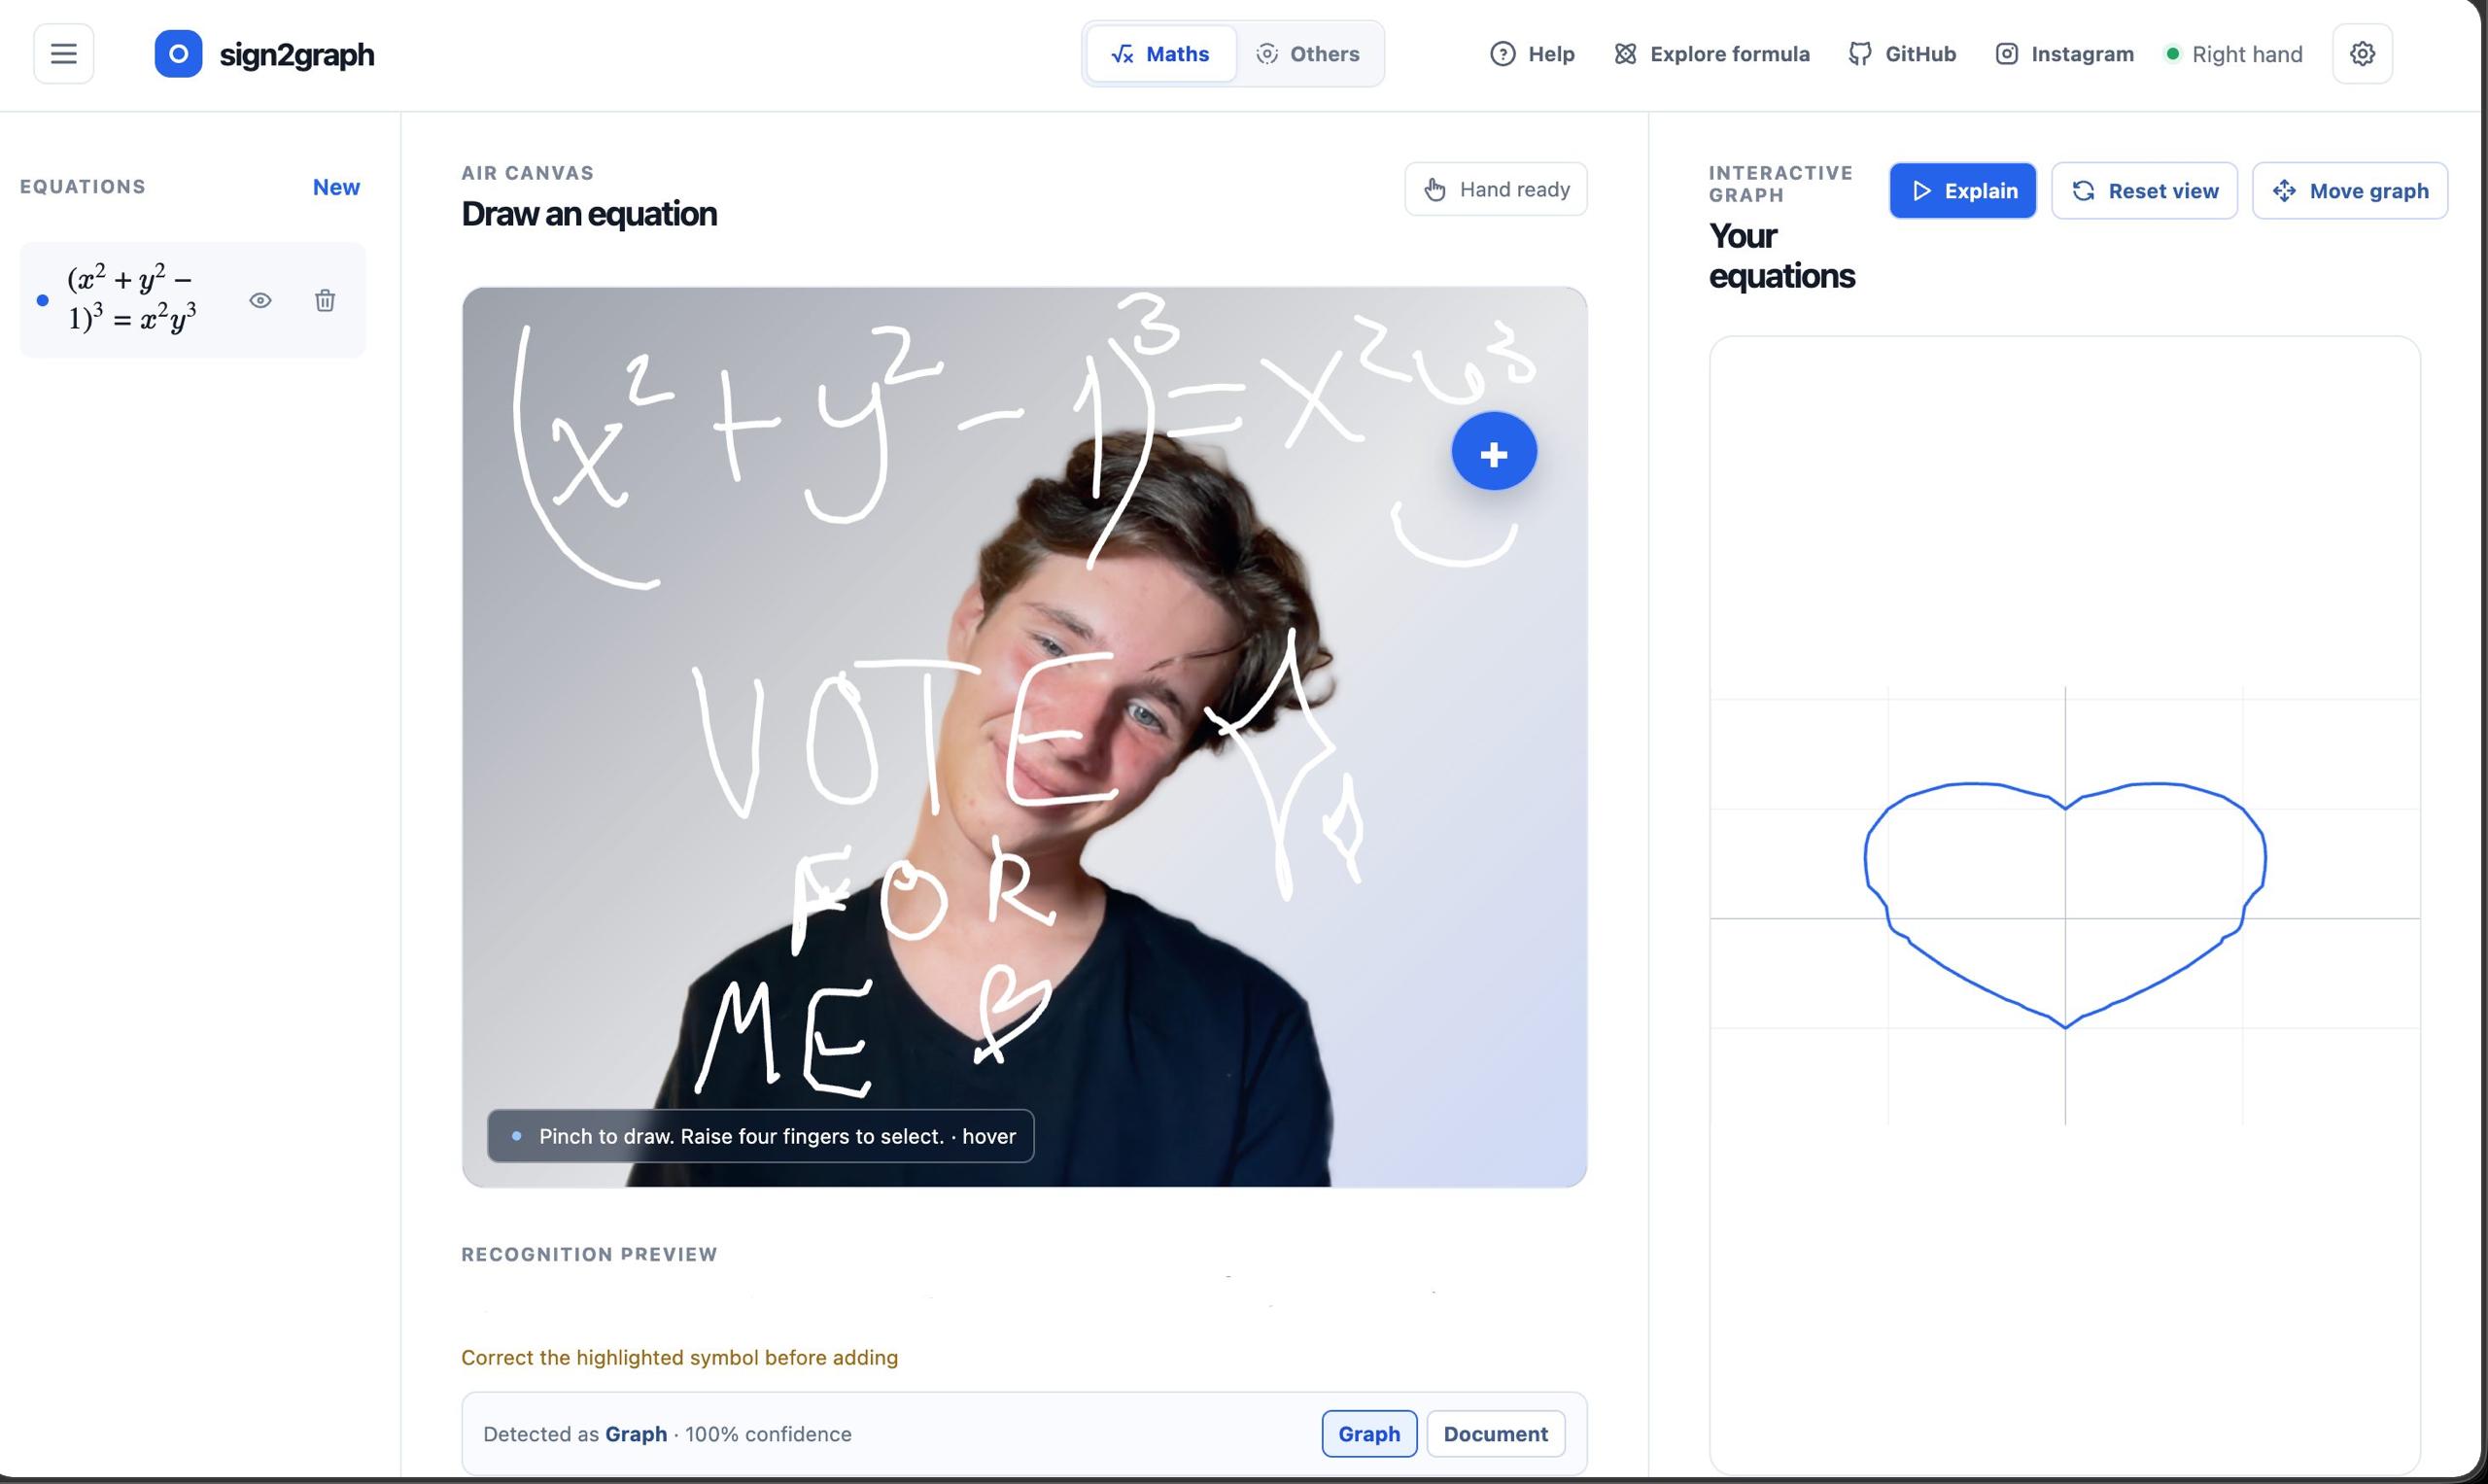
Graph page
-
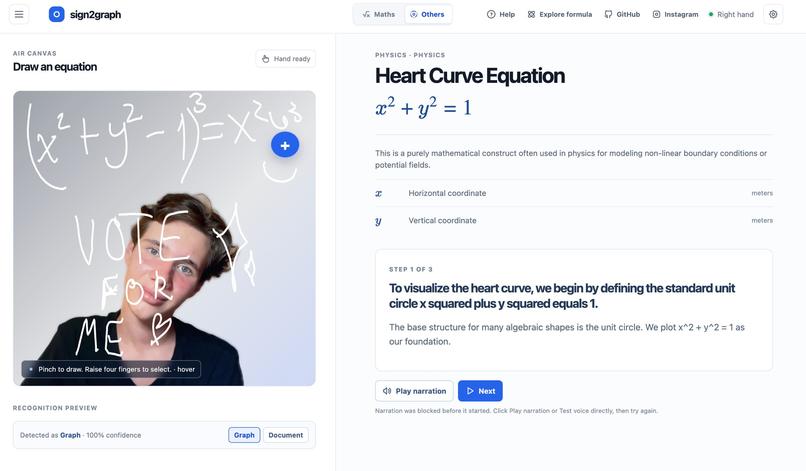
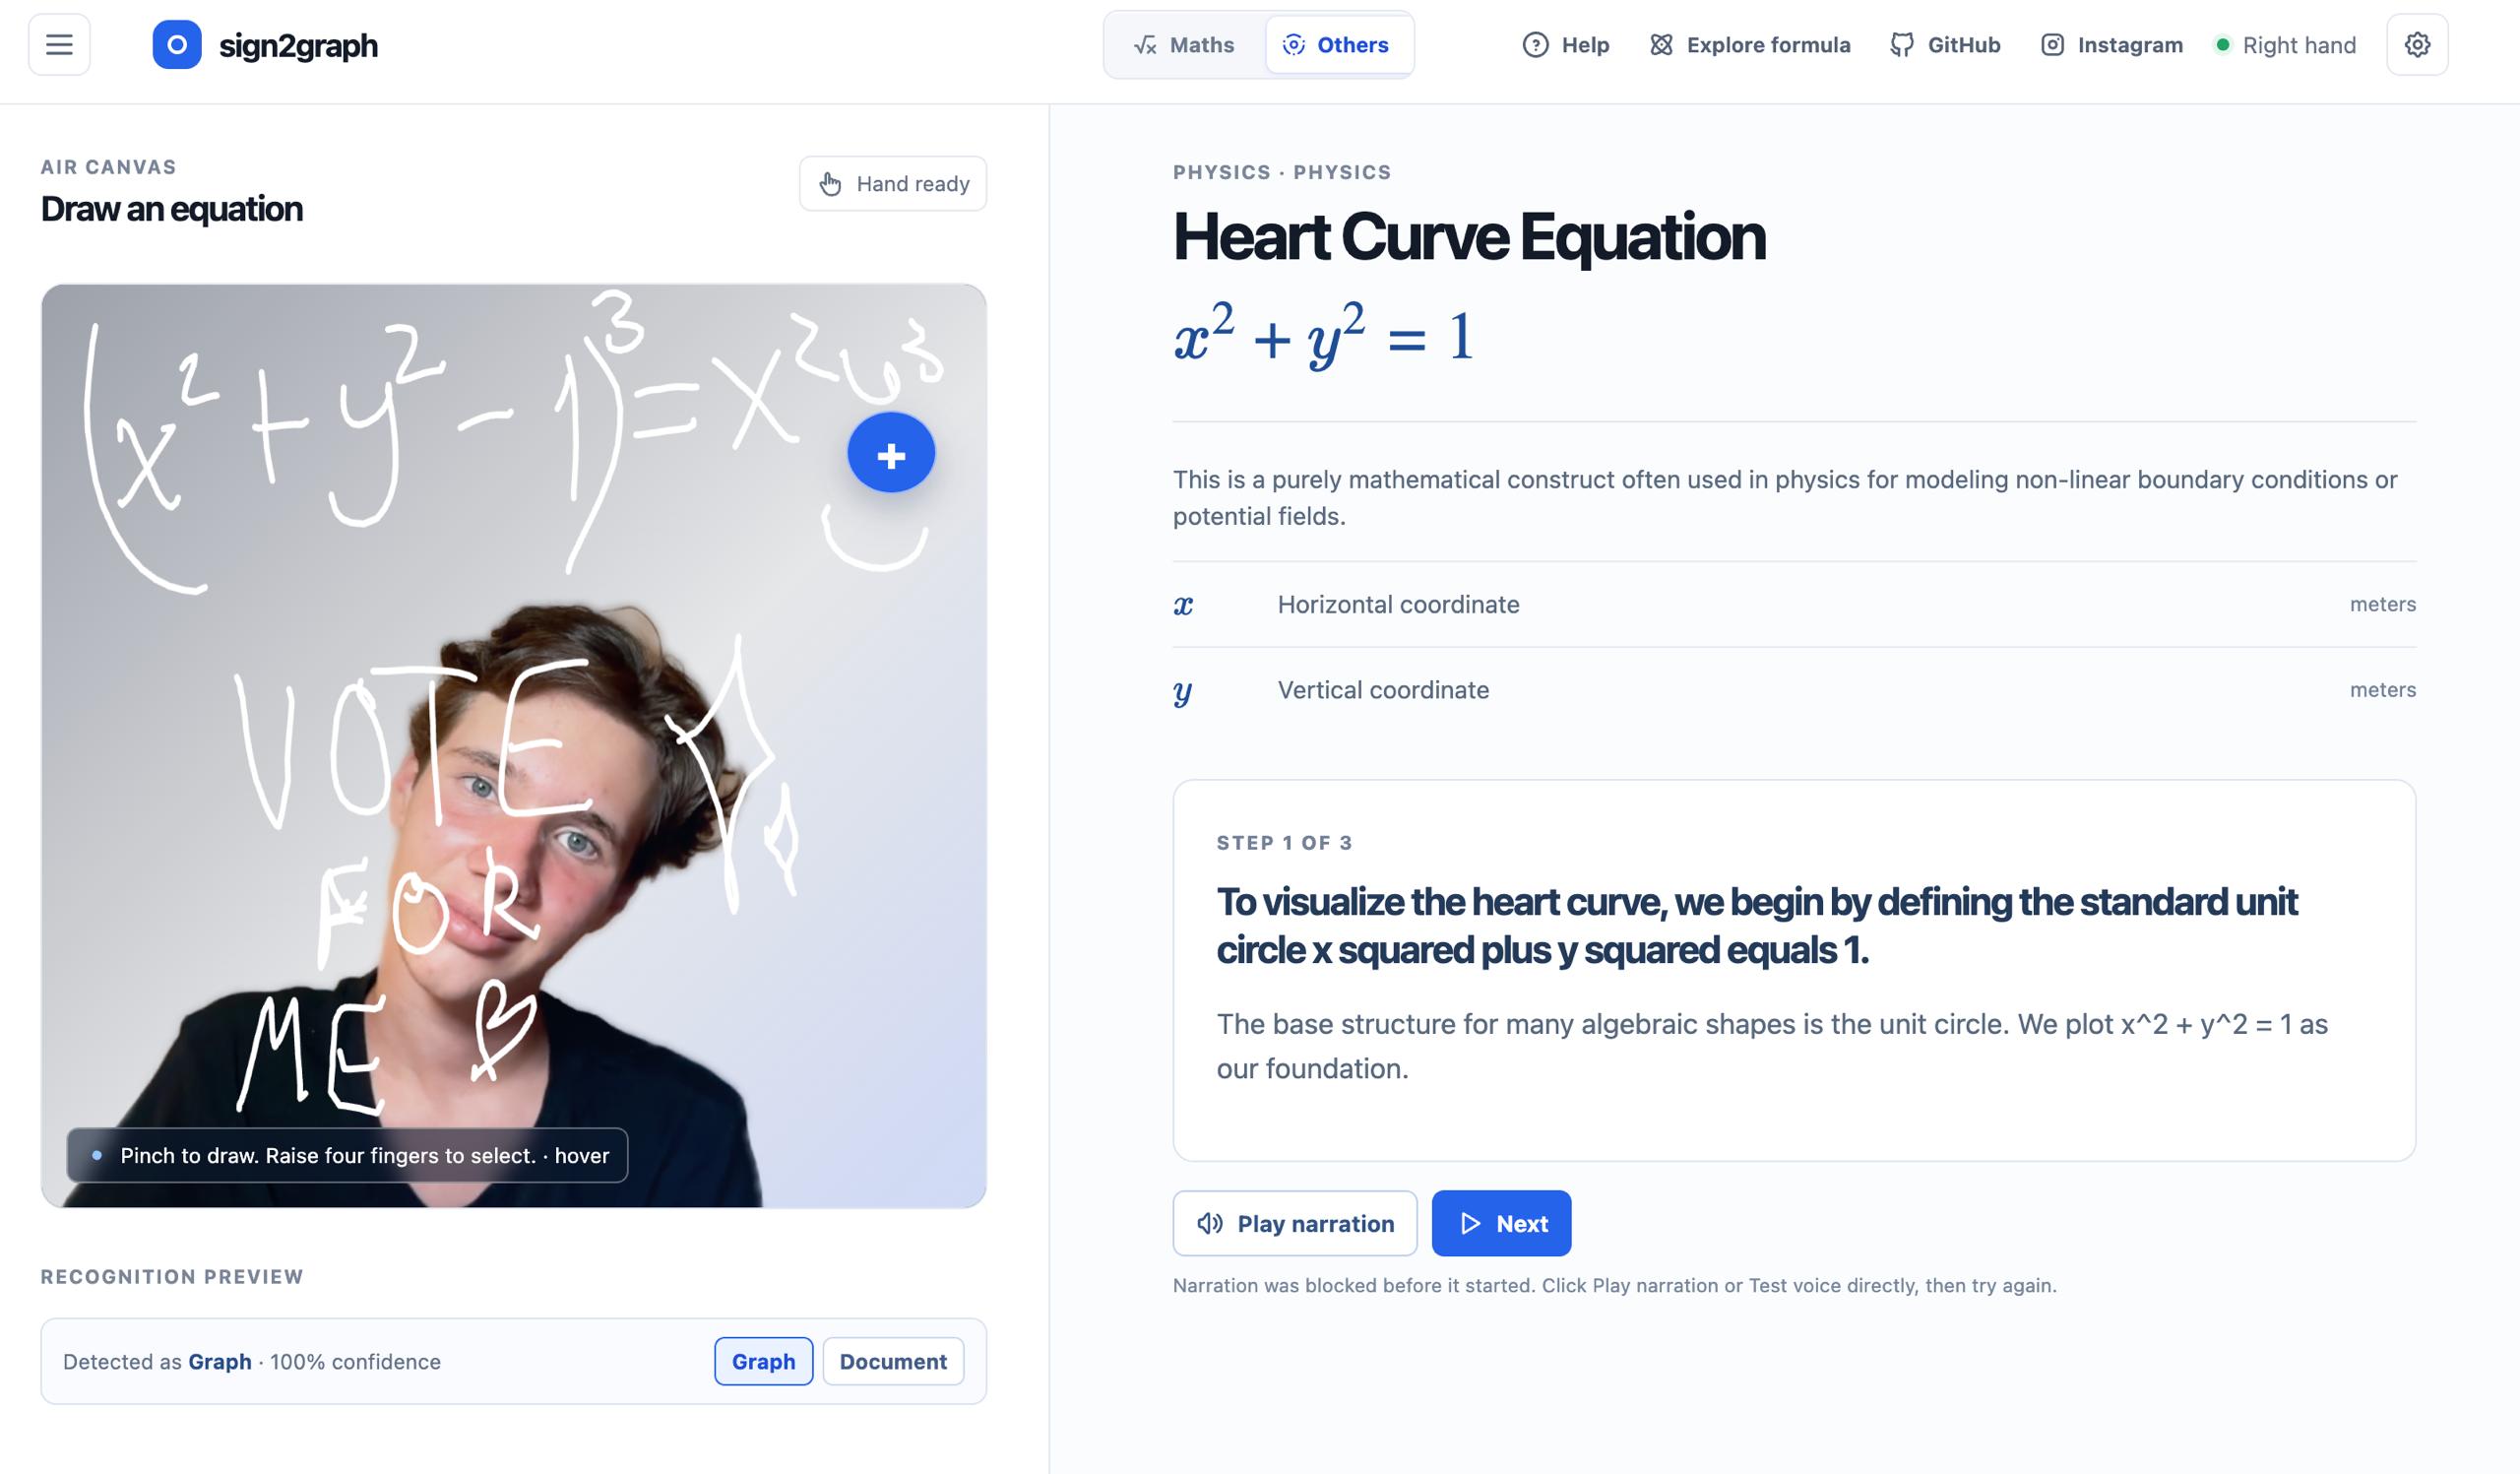
Other subjects page
-
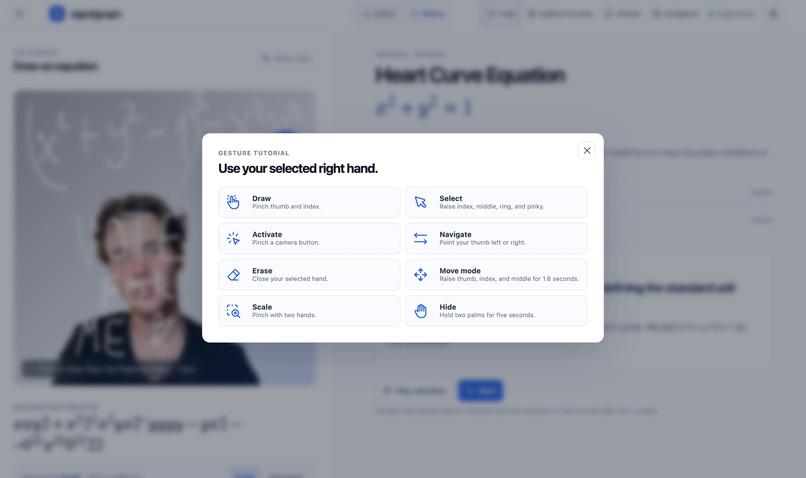
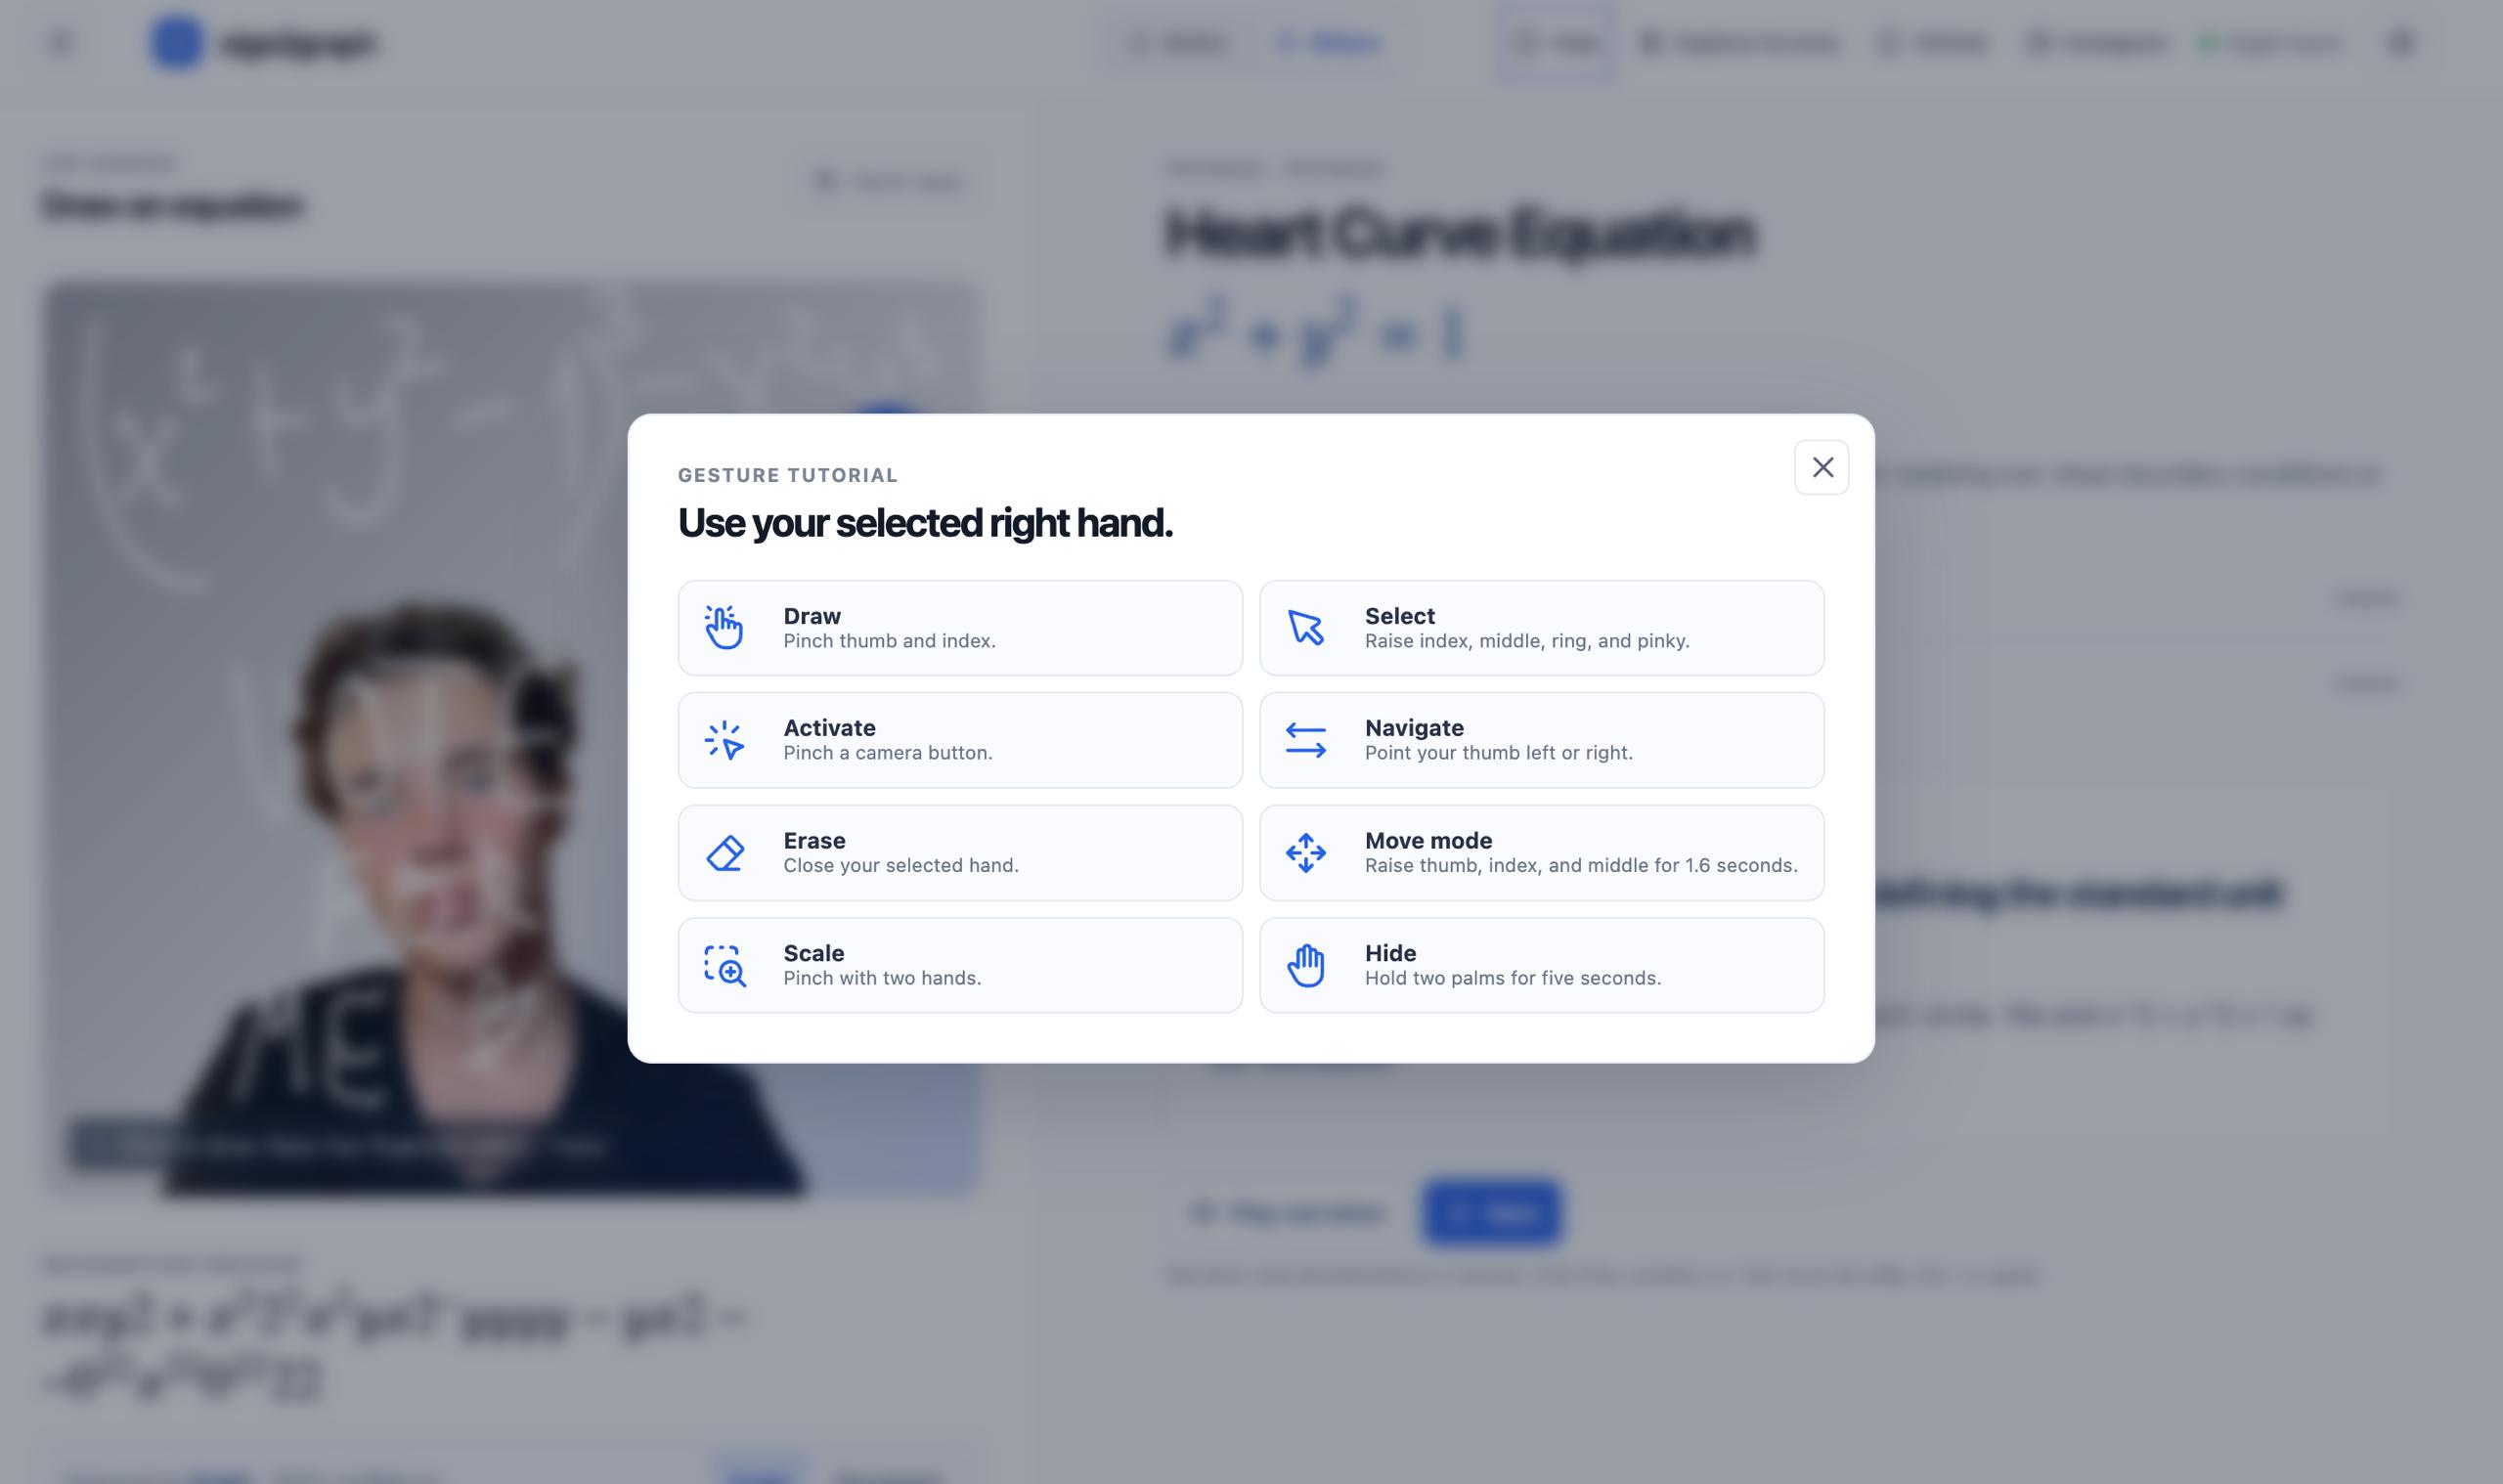
Help screen
-
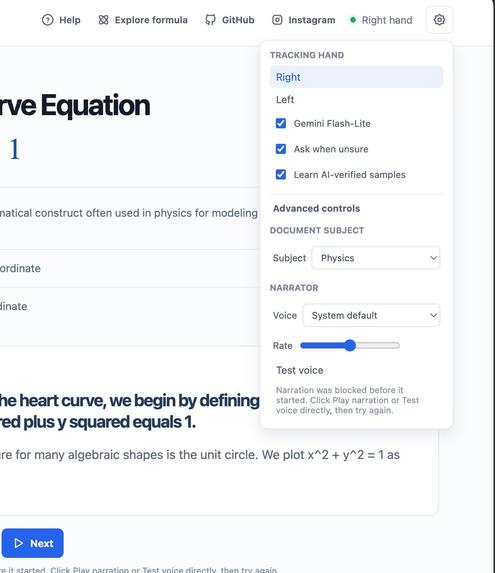
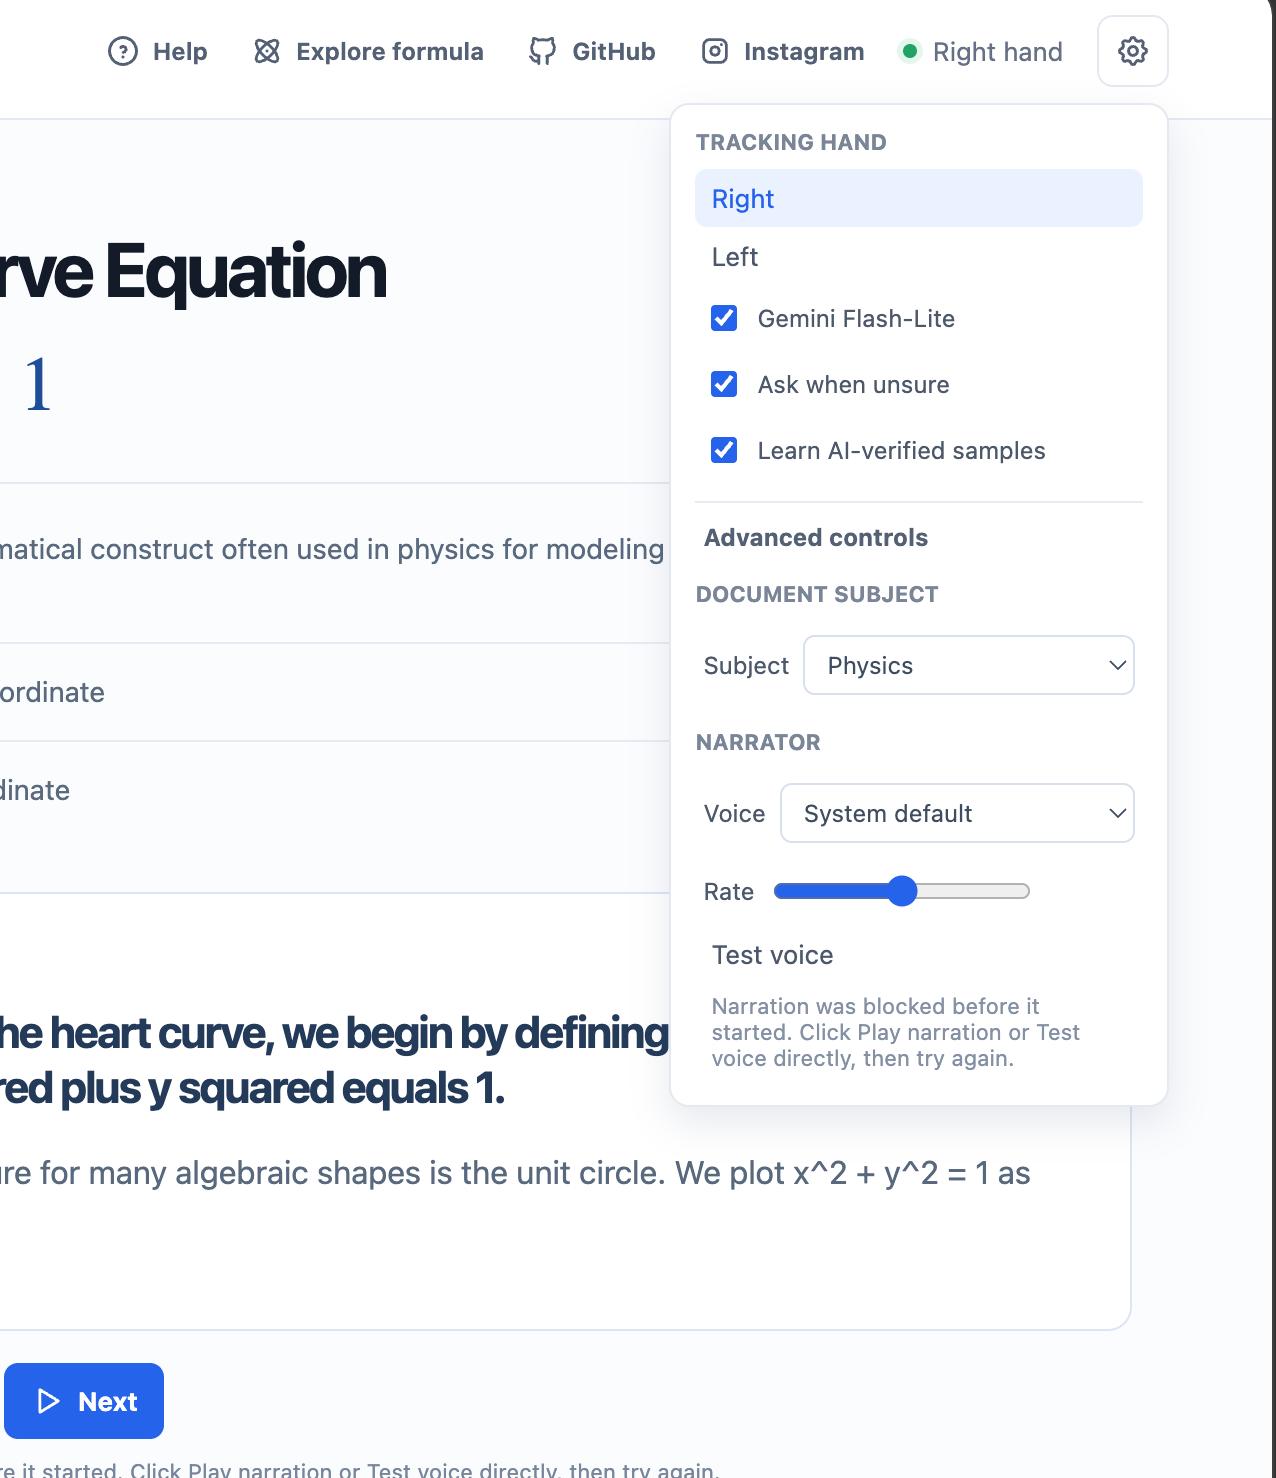
Settings
Inspiration
Most graphing tools display the final graph, but students may still struggle to understand how it was constructed and what each part of the equation changes.
I wanted to create a more visual and interactive way to explain STEM concepts. Sign2Graph allows users to write equations in the air using a webcam, then turns them into animated explanations with narration and synchronized captions.
The project was also influenced by interviews with neurodivergent learners, including people with ADHD, dyslexia, and autism, as well as learners with different attention, hearing, and information-processing needs. I also consulted specialists working in these areas. Their feedback influenced the short explanation stages, reduced visual overload, replay controls, captions, and simple gesture system.
What it does
Sign2Graph is an AI-powered spatial STEM learning platform that works using a standard laptop and webcam.
A user can draw an expression such as:
$$ y=(x-2)^2-4 $$
The system recognizes the handwriting, analyzes the expression, and displays the graph.
When Explain Mode is activated, Sign2Graph demonstrates how the graph is constructed. It begins with the parent function:
$$ y=x^2 $$
It then animates the horizontal and vertical transformations step by step. Narration, captions, equations, and visual changes remain synchronized.
Sign2Graph can also recognize expressions from other STEM subjects. For example:
$$ F=ma $$
Instead of forcing this formula onto a coordinate graph, the platform can create a structured lesson using text, LaTeX equations, diagrams, narration, captions, and animated visual steps.
How I built it
The application combines real-time computer vision, gesture interaction, multimodal AI, mathematical rendering, graphing, animation, speech synthesis, and closed captions.
The webcam feed is processed using MediaPipe hand tracking. The application follows the user's fingertip and uses gesture states to distinguish drawing, hovering, selecting, and activating interface controls.
The captured strokes are rendered onto a digital canvas and analyzed using multimodal AI. The AI recognizes the expression, classifies the type of STEM content, and generates a structured explanation plan.
The response is validated before it reaches the visual renderer. Instead of allowing the AI to directly control the interface, Sign2Graph supports a defined set of actions such as:
- adding an expression;
- drawing a graph;
- shifting or transforming a graph;
- highlighting a term;
- showing text or LaTeX;
- displaying diagrams;
- playing narration;
- showing synchronized captions.
The application performs these actions deterministically, which improves stability and makes the explanations easier to control.
Challenges
One of the main challenges was recognizing equations written in the air. Finger movement is less precise than writing on paper, and the webcam can introduce noise, inconsistent stroke sizes, and tracking errors.
Another challenge was designing gestures that felt simple while avoiding accidental activation. Drawing, selecting, and activating buttons had to work through separate interaction states.
Synchronizing AI-generated explanations with graph animations, text-to-speech, and captions was also difficult. Each explanation step needed separate visual instructions, spoken text, displayed text, and mathematical content.
AI output can vary, so the application needed structured responses, schema validation, supported action types, and fallback behavior. This prevents malformed responses from directly breaking the lesson.
What I learned
I learned how to combine several systems that normally exist as separate tools into one real-time application.
I gained practical experience with:
- hand-landmark tracking;
- gesture-state design;
- canvas-based stroke processing;
- multimodal AI;
- structured AI output;
- mathematical expression handling;
- synchronized animation and speech;
- accessibility-focused interface design;
- error handling for AI-generated content.
I also learned that educational technology needs to support different ways of processing information. A concept can be presented visually, verbally, symbolically, and interactively without requiring separate platforms.
Impact
Sign2Graph makes spatial STEM explanations available without requiring AR glasses, interactive whiteboards, or specialized equipment. A laptop, webcam, and projector are enough.
This makes the project suitable for:
- classrooms;
- online tutoring;
- student self-study;
- underfunded schools;
- museums and science exhibitions;
- interactive STEM demonstrations;
- future AR learning environments.
The platform can help students who struggle with static explanations or benefit from visual, auditory, and spatial learning. Captions, replayable steps, simple controls, and synchronized explanations allow the same lesson to support different learning, sensory, and attention needs.
What is next
The next stage is to expand the number of supported mathematical expressions and STEM subjects.
Future development could include:
- more graph families;
- physics and chemistry visualization templates;
- multilingual narration and captions;
- saved explanation scenes;
- teacher-created lesson libraries;
- student practice questions;
- integration with learning-management systems;
- support for AR glasses and spatial displays.
Built With
- computer-vision
- gemini
- latex
- mathjs
- mediapipe
- nextjs
- react
- render
- speech
- typescript
- zustand



Log in or sign up for Devpost to join the conversation.