-
-
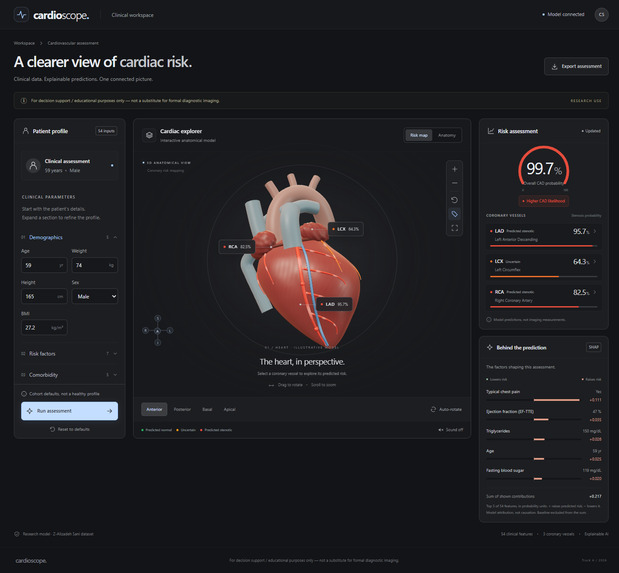
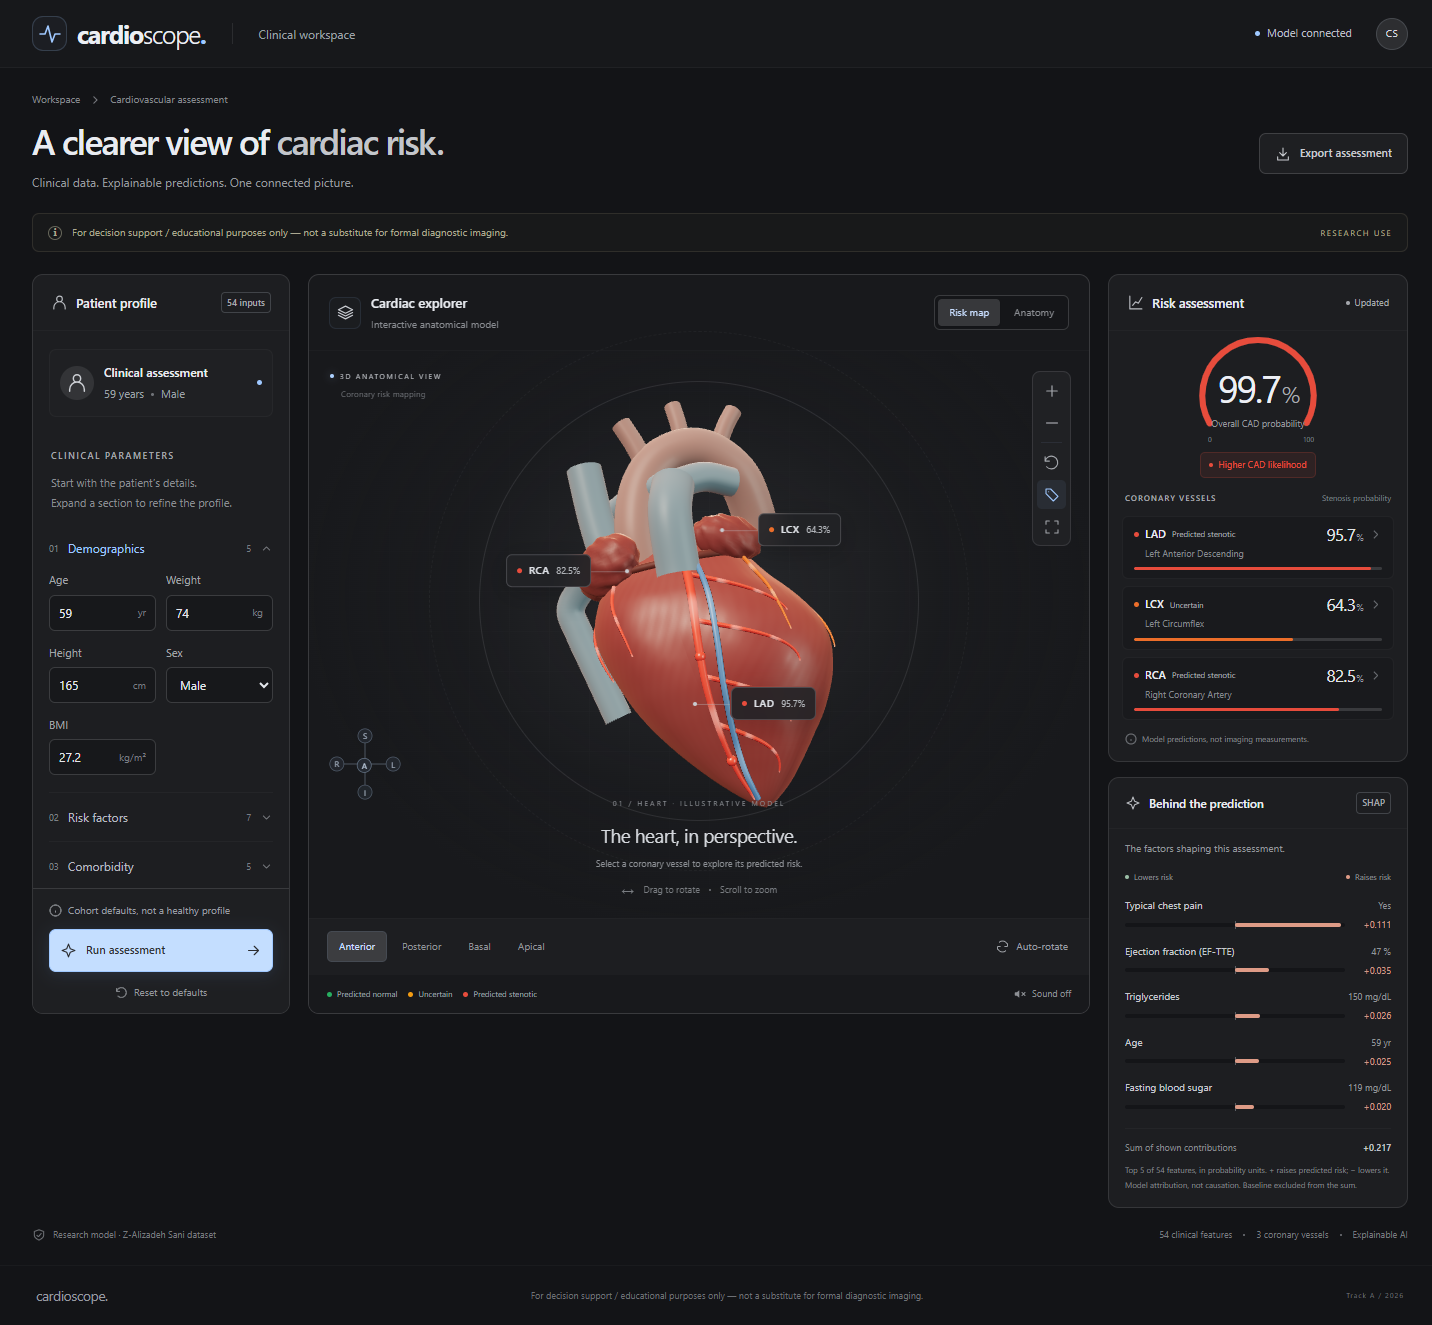
CardioScope Dashboard
-
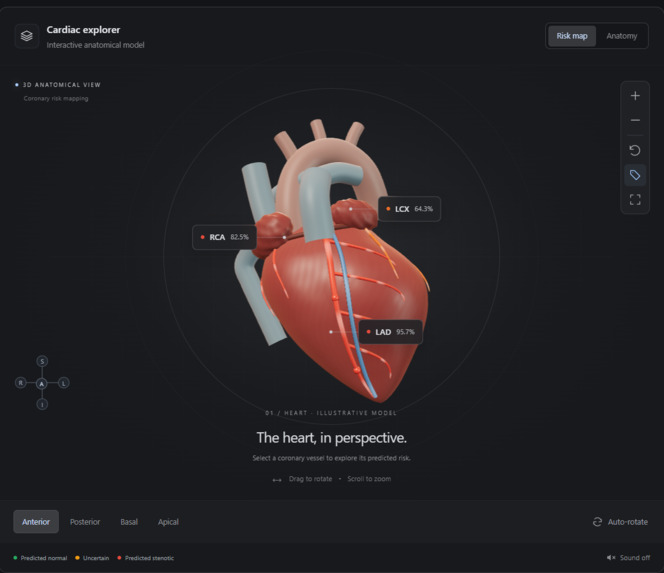
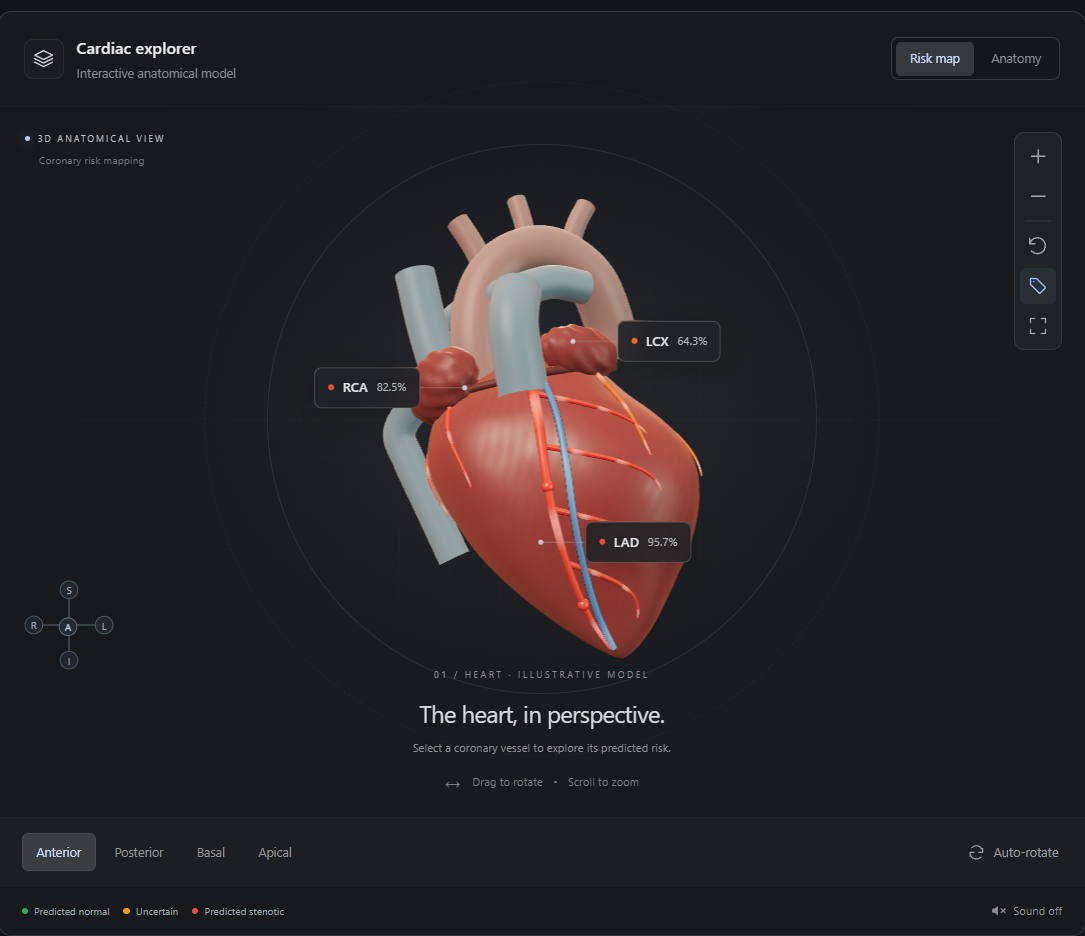
Anterior View
-
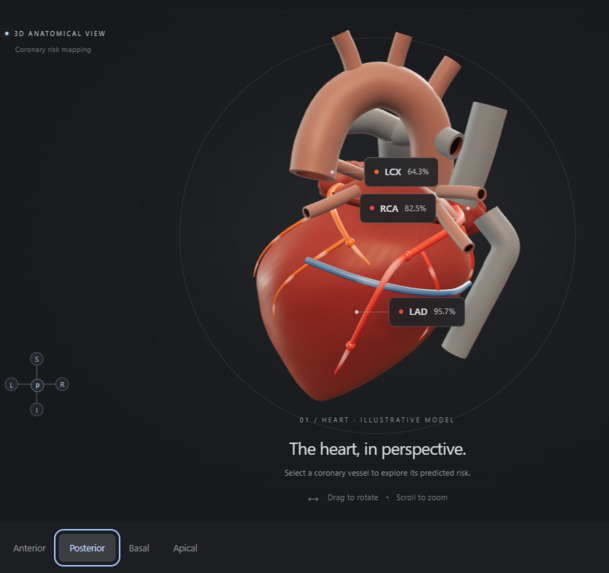
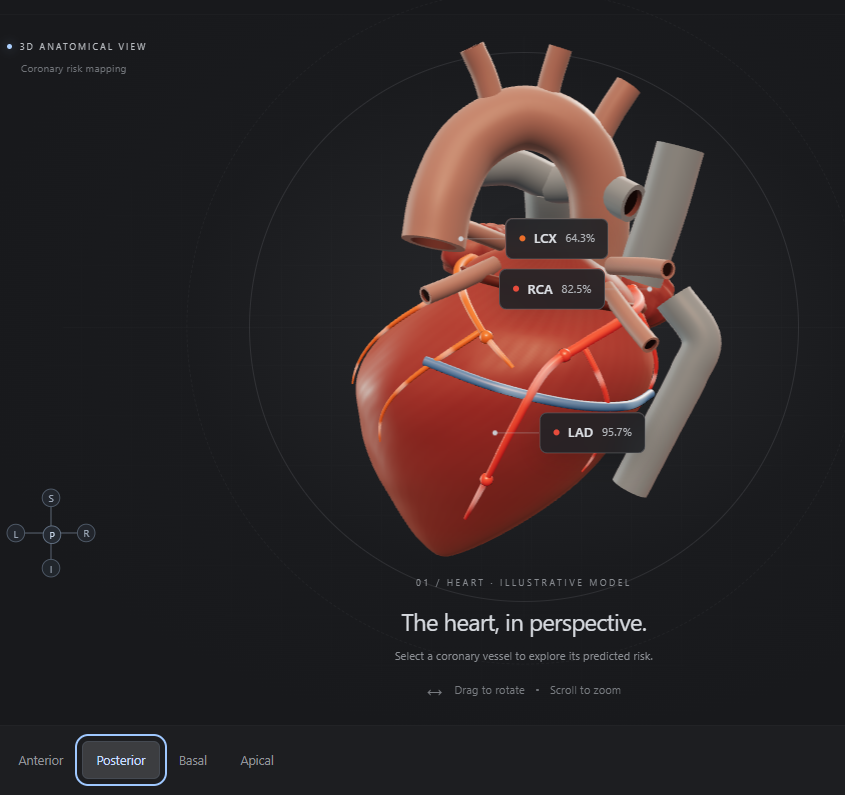
Posterior View
-
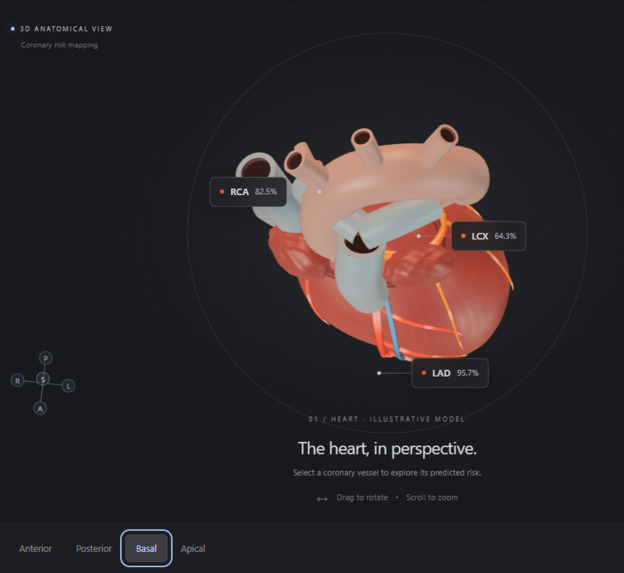
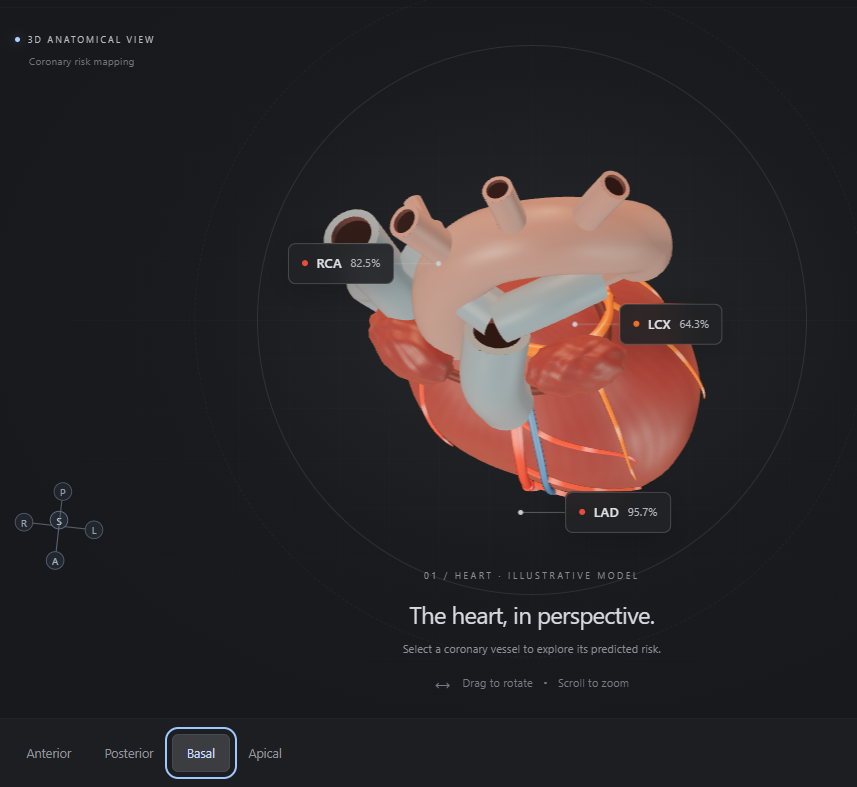
Basal view
-
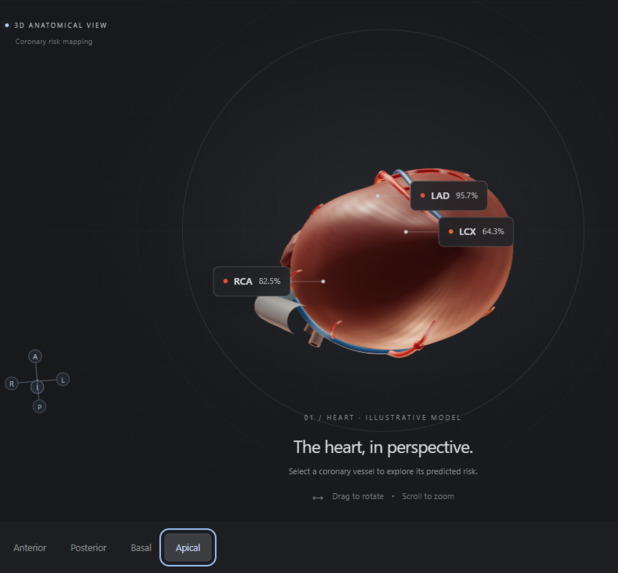
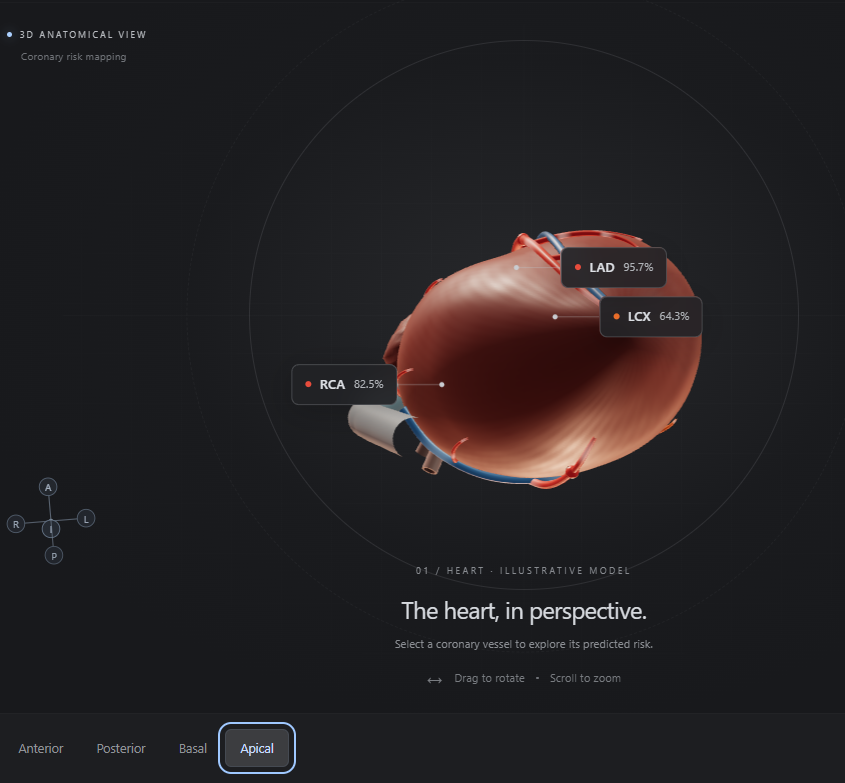
Apical View
-
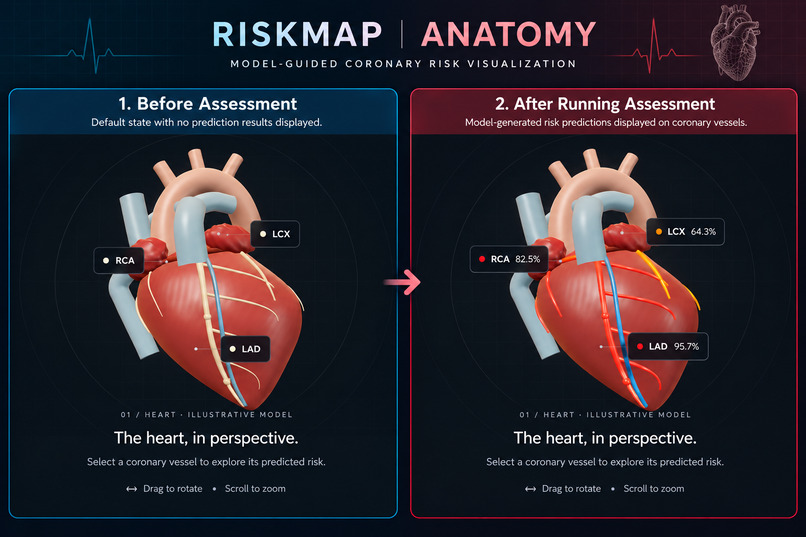
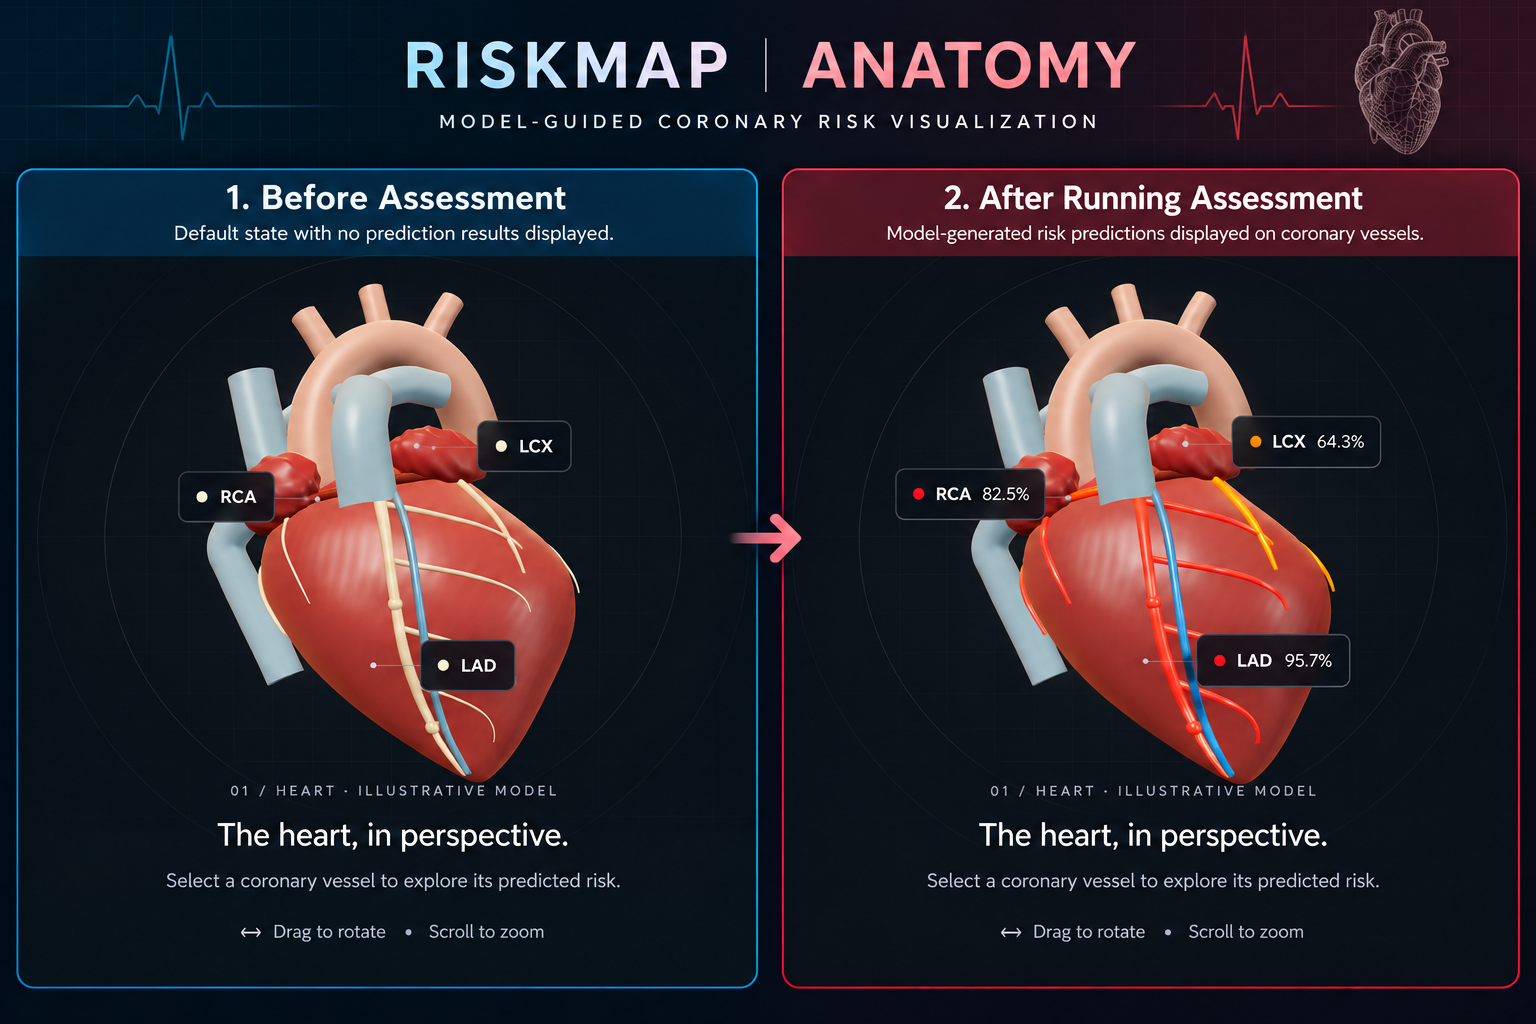
RiskMap Anatomy
Inspiration
Cardiovascular disease is the world's leading cause of death, but most ML risk tools hand you a single number with no explanation. A clinician or student looking at "87% risk" can't tell why the model said that, or which vessel is driving it.
We built CardioScope for Track A of the Multimodal AI Hackathon 2026 to make cardiac risk predictions something you can explore, question and understand, not just read.
What it does
Enter 54 clinical inputs (demographics, risk factors, comorbidities, exam findings, symptoms, ECG, labs and echocardiography) and CardioScope returns four predictions:
- Overall CAD probability
- Stenosis probability for each of three major vessels: LAD, LCX and RCA
Those results are mapped onto an interactive, beating 3D heart:
- 🟢 ≤25% · 🟡 25–75% · 🔴 ≥75% vessel coloring
- Click any vessel, label or risk card to see the top 5 SHAP factors pushing that score up or down, next to the exact measurements used
- Rotate and zoom, switch anatomical camera views, toggle labels, expand the viewer, or play a synthesized heartbeat
- Export the assessment as a PDF
The heart is illustrative procedural anatomy, not a patient scan. Colors show model probability, not measured blockage.
How we built it
Data: UCI Extension of Z-Alizadeh Sani dataset, 303 patients, 59 columns. After removing the 4 targets and 1 constant column, 54 inputs remain.
Models: four CatBoost classifiers, one per target. Five-fold stratified, out-of-fold results:
| Target | ROC-AUC | F1 | Recall |
|---|---|---|---|
| Overall CAD | 0.912 | 0.900 | 0.912 |
| LAD | 0.849 | 0.819 | 0.842 |
| LCX | 0.739 | 0.617 | 0.597 |
| RCA | 0.703 | 0.507 | 0.465 |
Explainability: SHAP using interventional probability attribution, so contribution units are consistent across all four models.
Backend: FastAPI + Pydantic. The API loads all four models and their explainers at startup and serves POST /api/predict.
Frontend: React 19, TypeScript, Vite, Tailwind CSS 4, Zustand, Three.js and React Three Fiber. A shared vessel-ID system keeps the risk cards, 3D labels, arteries and SHAP panel synchronized.
Deployment: one Docker image serves the React build and the FastAPI backend together on Render, with real model inference, not a mock.
Challenges we ran into
- Not overstating certainty. Probabilities display as
<0.1%or>99.9%instead of 0% or 100%. The color bands are visualization aids, not validated clinical thresholds, and the UI says so. - Stale explanations. If a user edits the form after a prediction, the old SHAP values would no longer match the inputs. We flag results as "Inputs changed" and keep the original measurements next to the explanation until the user reruns.
- Small data. With only 303 records, LCX and RCA are noticeably weaker than CAD and LAD. We report this openly instead of averaging it away.
- Target leakage.
Cath,LAD,LCXandRCAare never used as predictors, and tests check this. - Keeping 4 views in sync. The form, vessel cards, 3D scene and explanation panel all had to agree on one selected vessel and one set of results.
Accomplishments that we're proud of
- A live, deployed app returning real predictions and SHAP explanations
- Explanations tied directly to anatomy: select a vessel and see why it scored that way
- Tests covering API contracts, input boundaries, feature schema, target leakage, model artifacts and SHAP consistency
- A six-page technical report that documents the limitations, not just the wins
- Graceful fallback: if the API is down, the app offers a clearly labeled sample assessment rather than faking a result
What we learned
- Attribution is not causation. SHAP shows what the model used, and the interface has to say that.
- A prediction without its limitations is misleading. Showing LCX and RCA as weaker earns more trust than hiding it.
- Keeping a 3D scene, a form and an ML explanation panel consistent comes down to one shared state store.
What's next for CardioScope
- External validation on larger, more diverse cohorts
- Probability calibration, so a displayed 80% means something
- More modalities: ECG waveforms, echocardiography images and clinical notes
- Usability testing with clinicians and students
CardioScope is a research and educational prototype. It is not a medical device, not a diagnosis, and not a substitute for formal diagnostic imaging or professional medical assessment.
Built With
- catboost
- docker
- explainable-ai
- fastapi
- ml
- pydantic
- python
- react
- reactthreefiber
- scikit-learn
- shap
- three
- three.js
- typescript
- zustand

Log in or sign up for Devpost to join the conversation.