-
-
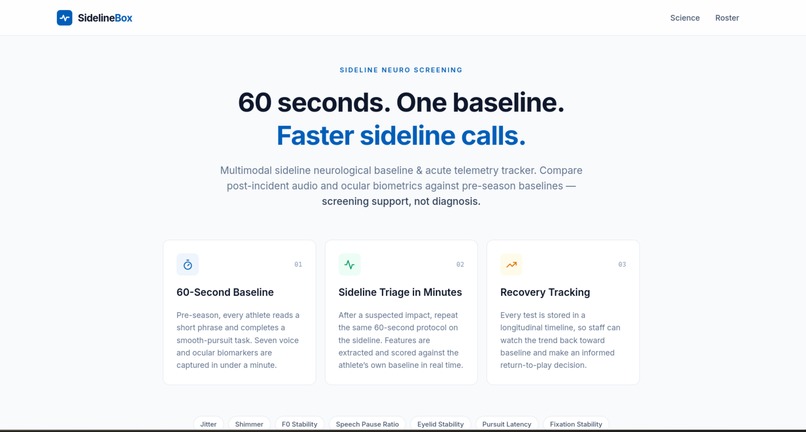
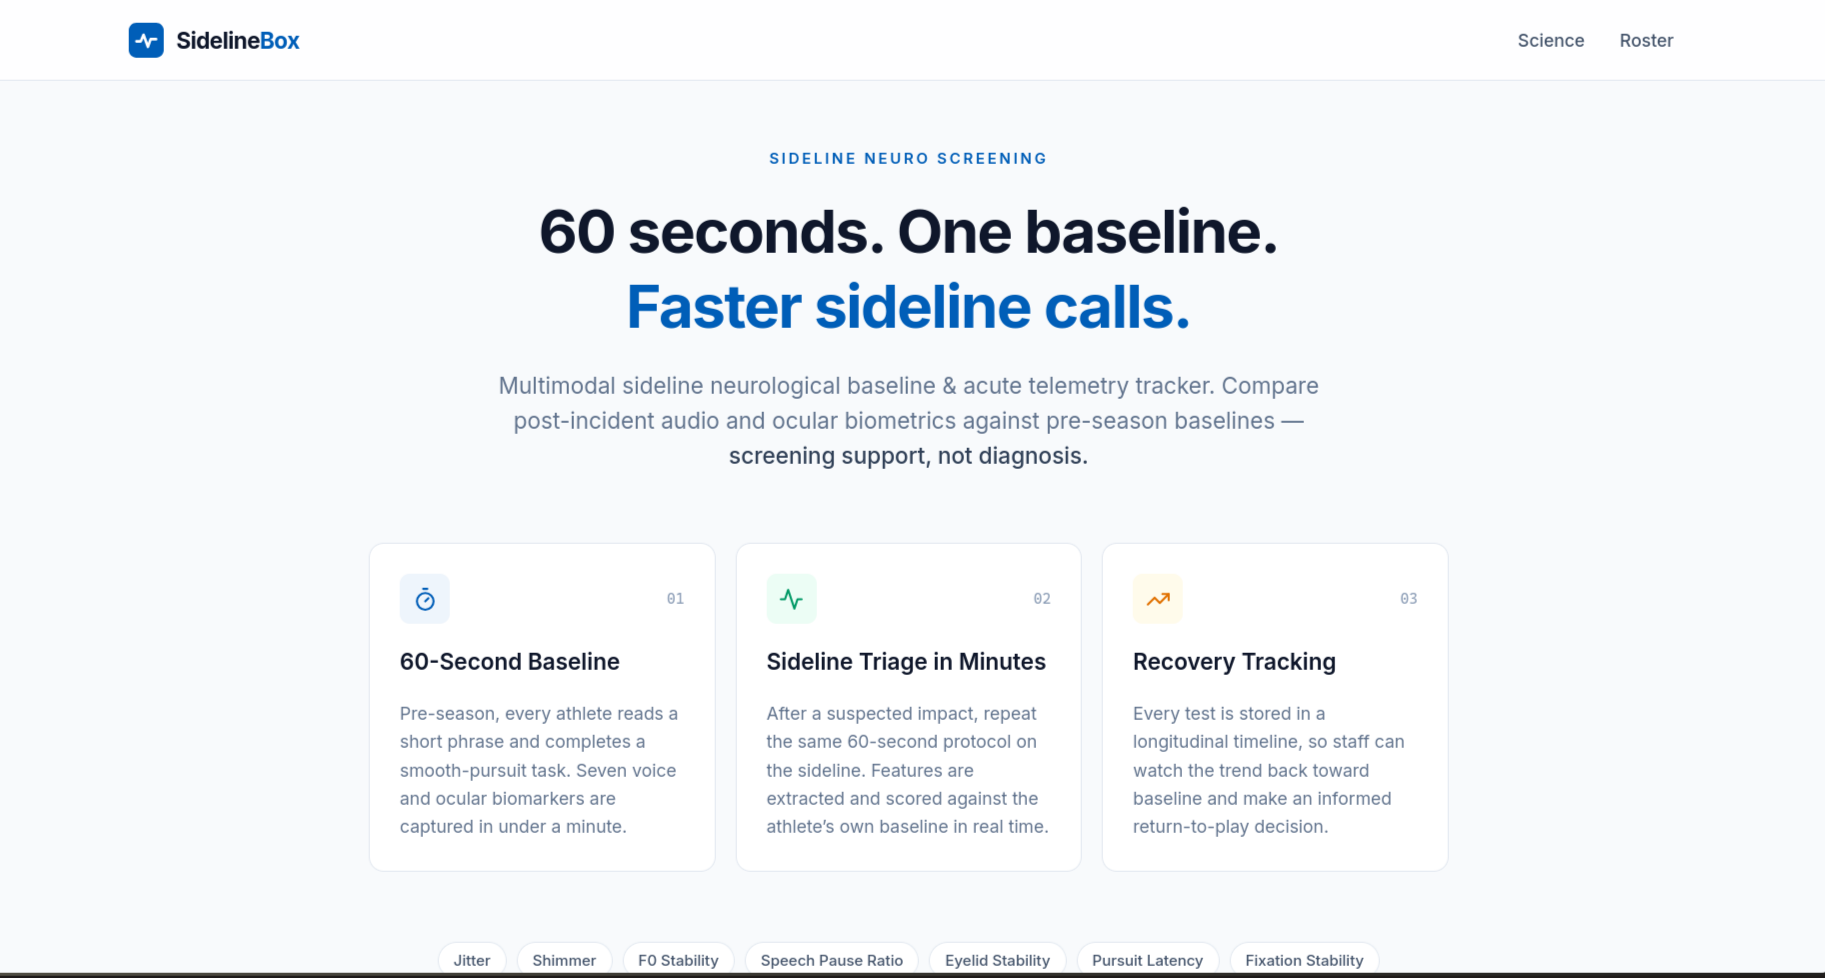
Home-Page
-
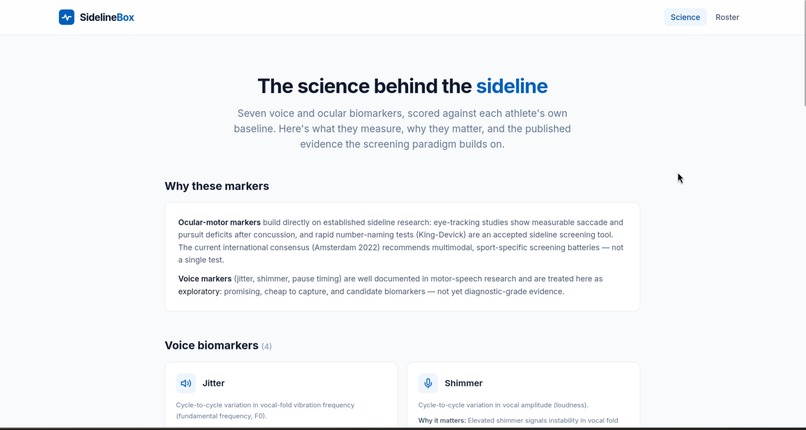
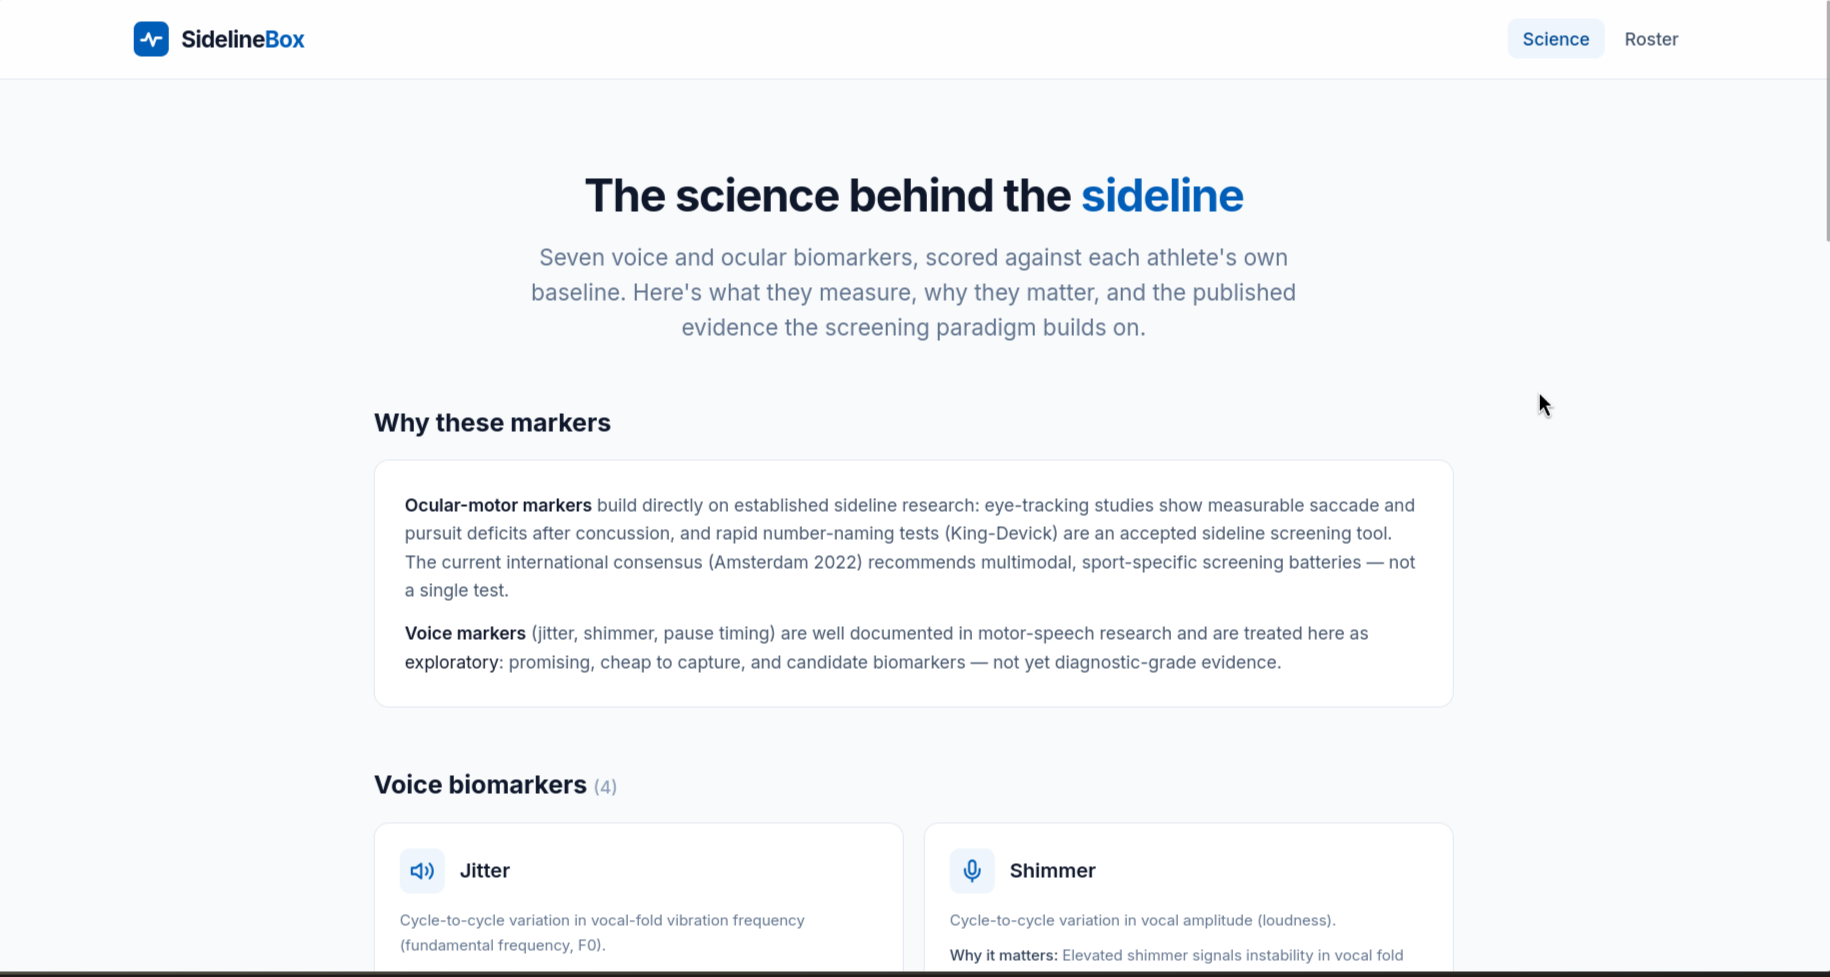
Science-behind-SidelineBox
-
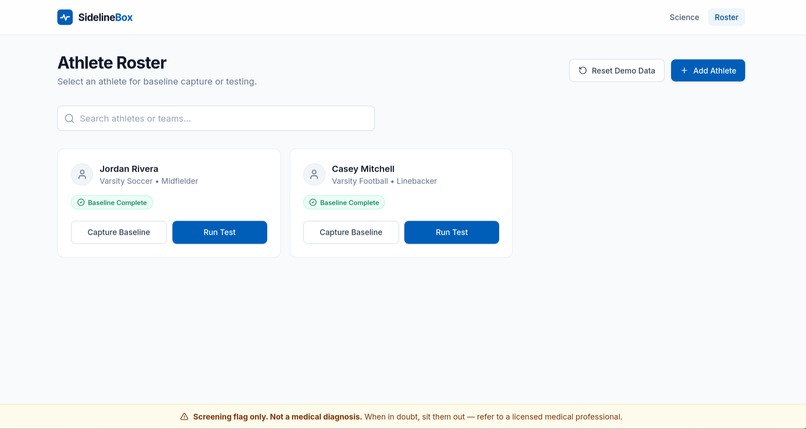
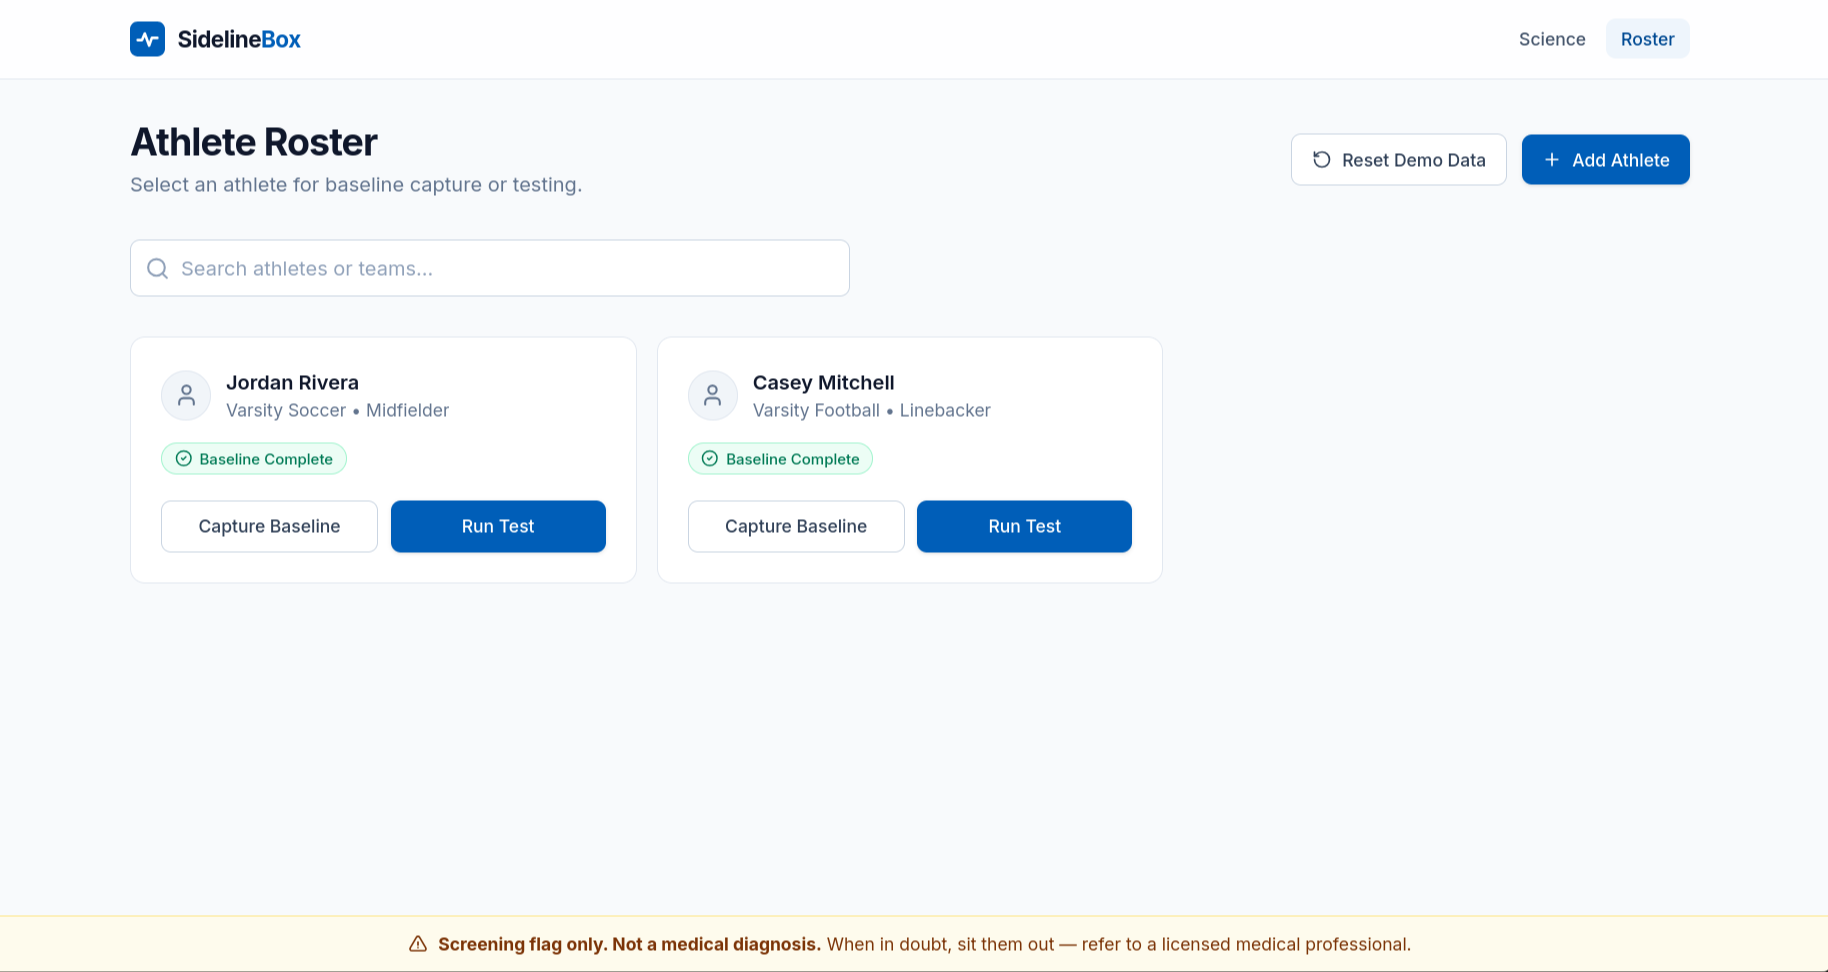
Athlete-Roster
-
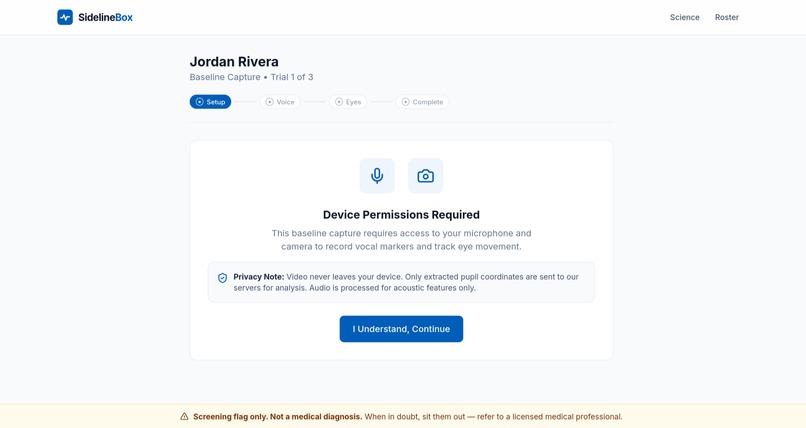
Baseline-Capture
-
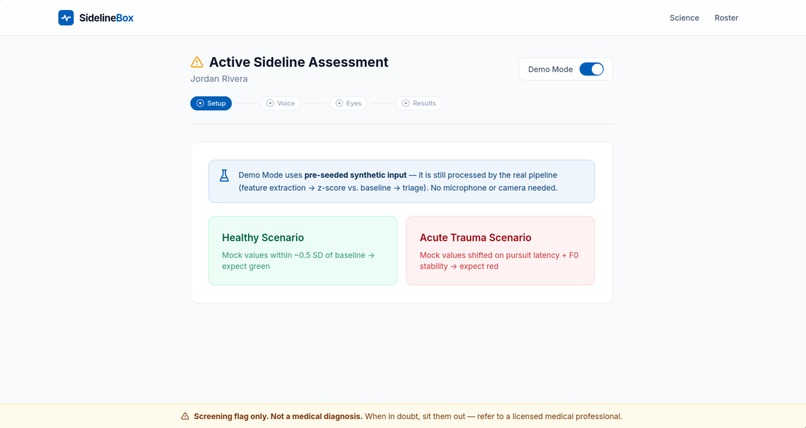
Active-Sideline-Assessment
Inspiration
Every athlete knows the moment: someone takes a hit, shakes it off, and says "I'm fine." Sometimes they're right. Sometimes they're not. And the scary part is that on the sideline, there's almost nothing a coach can actually do — no MRI, no neurologist, just a checklist and a gut feeling. Symptoms can be hidden, downplayed, or not even felt yet. By the time something looks wrong, the wrong decision may have already been made. I kept coming back to one insight: the data to make a better call is already there. It's in the athlete's voice and the way their eyes move. You just have to measure it against them — not against a population average. A 60-second test on a phone, using the front camera and the microphone, scored against that athlete's own pre-season baseline. No hardware, no specialists, no waiting room. Just a number that's honest about what it can and can't say.
What it does
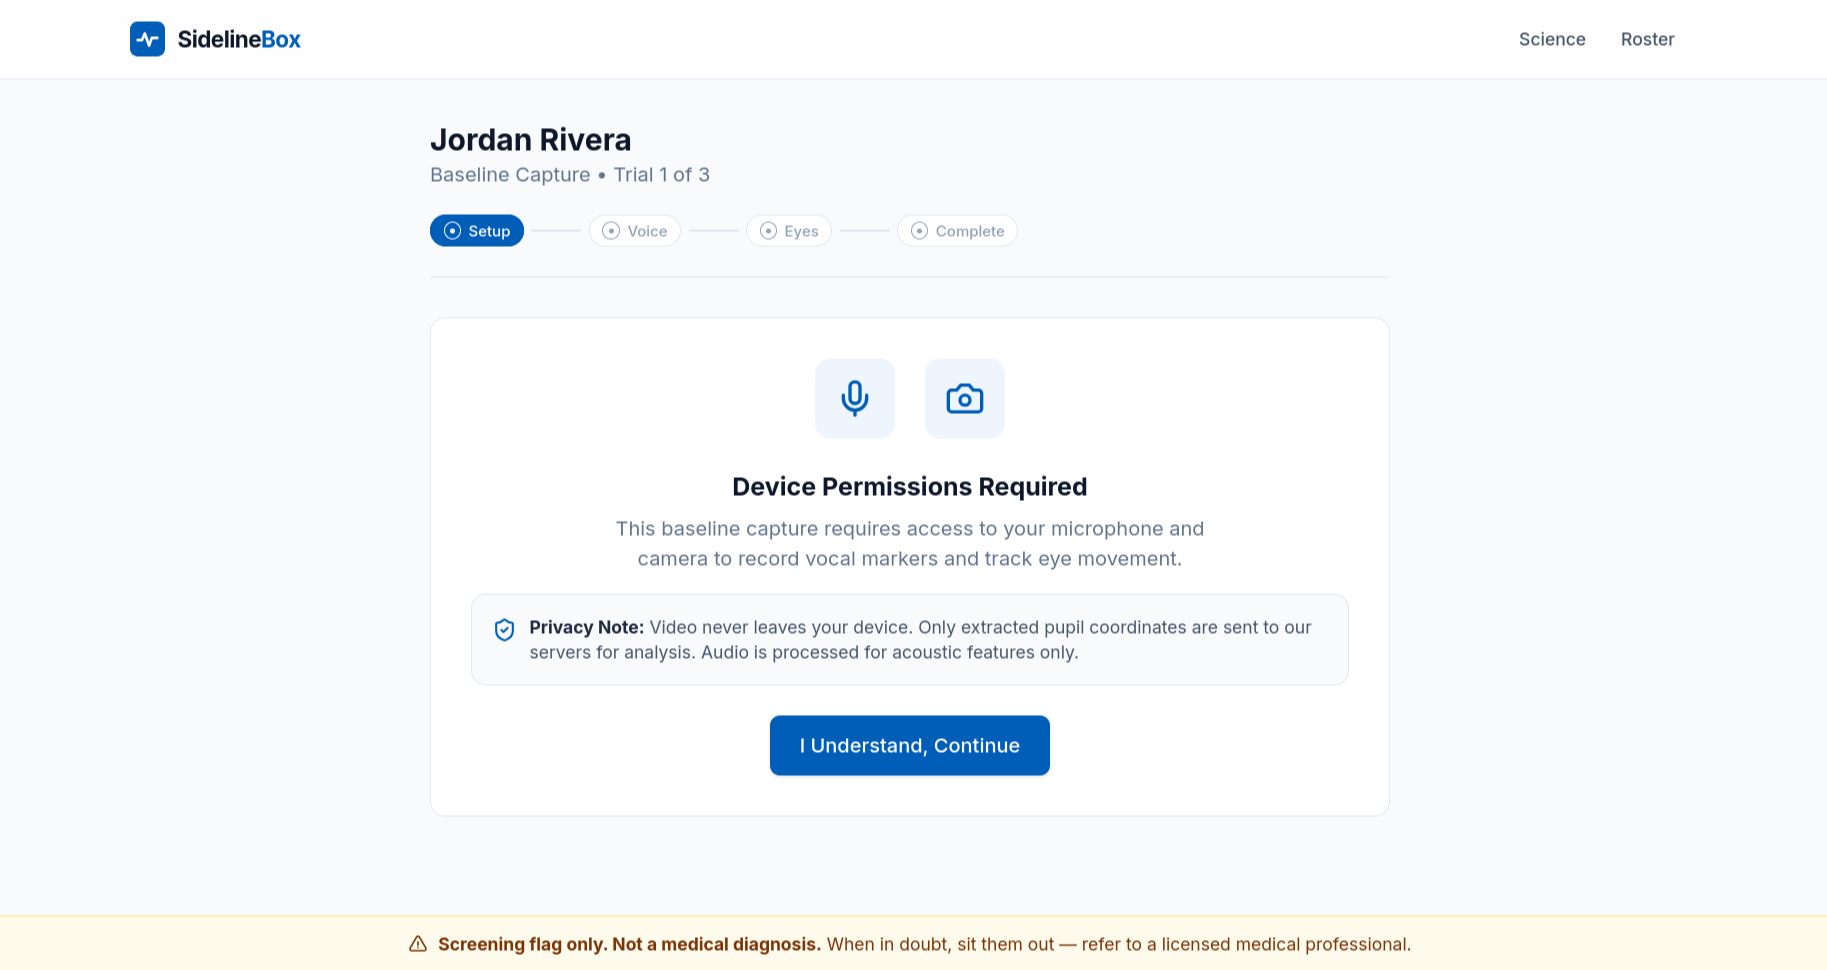
SidelineBox is a sideline screening tool: after a suspected head impact, an athlete reads a short phrase and follows a moving dot with their eyes. That's it. Under the hood, the app extracts seven biomarkers — four from voice (jitter, shimmer, pitch stability, pause ratio) and three from eye tracking (eyelid stability, pursuit latency, fixation stability) — and compares each one against the athlete's own baseline, producing z-scores in real time. Those z-scores collapse into a green, yellow, or red flag: green is within expected range, yellow is "possible deviation, retest," and red is "significant deviation — sit out, see a professional." Every result lands on the athlete's timeline, so staff can watch the recovery trend instead of guessing. Each result generates a print-ready report and a CSV export for the records, and prior injuries are tracked as context (kept strictly separate from the math). And because this is a screening tool, not a diagnosis, I say so — on every single screen.
How I built it
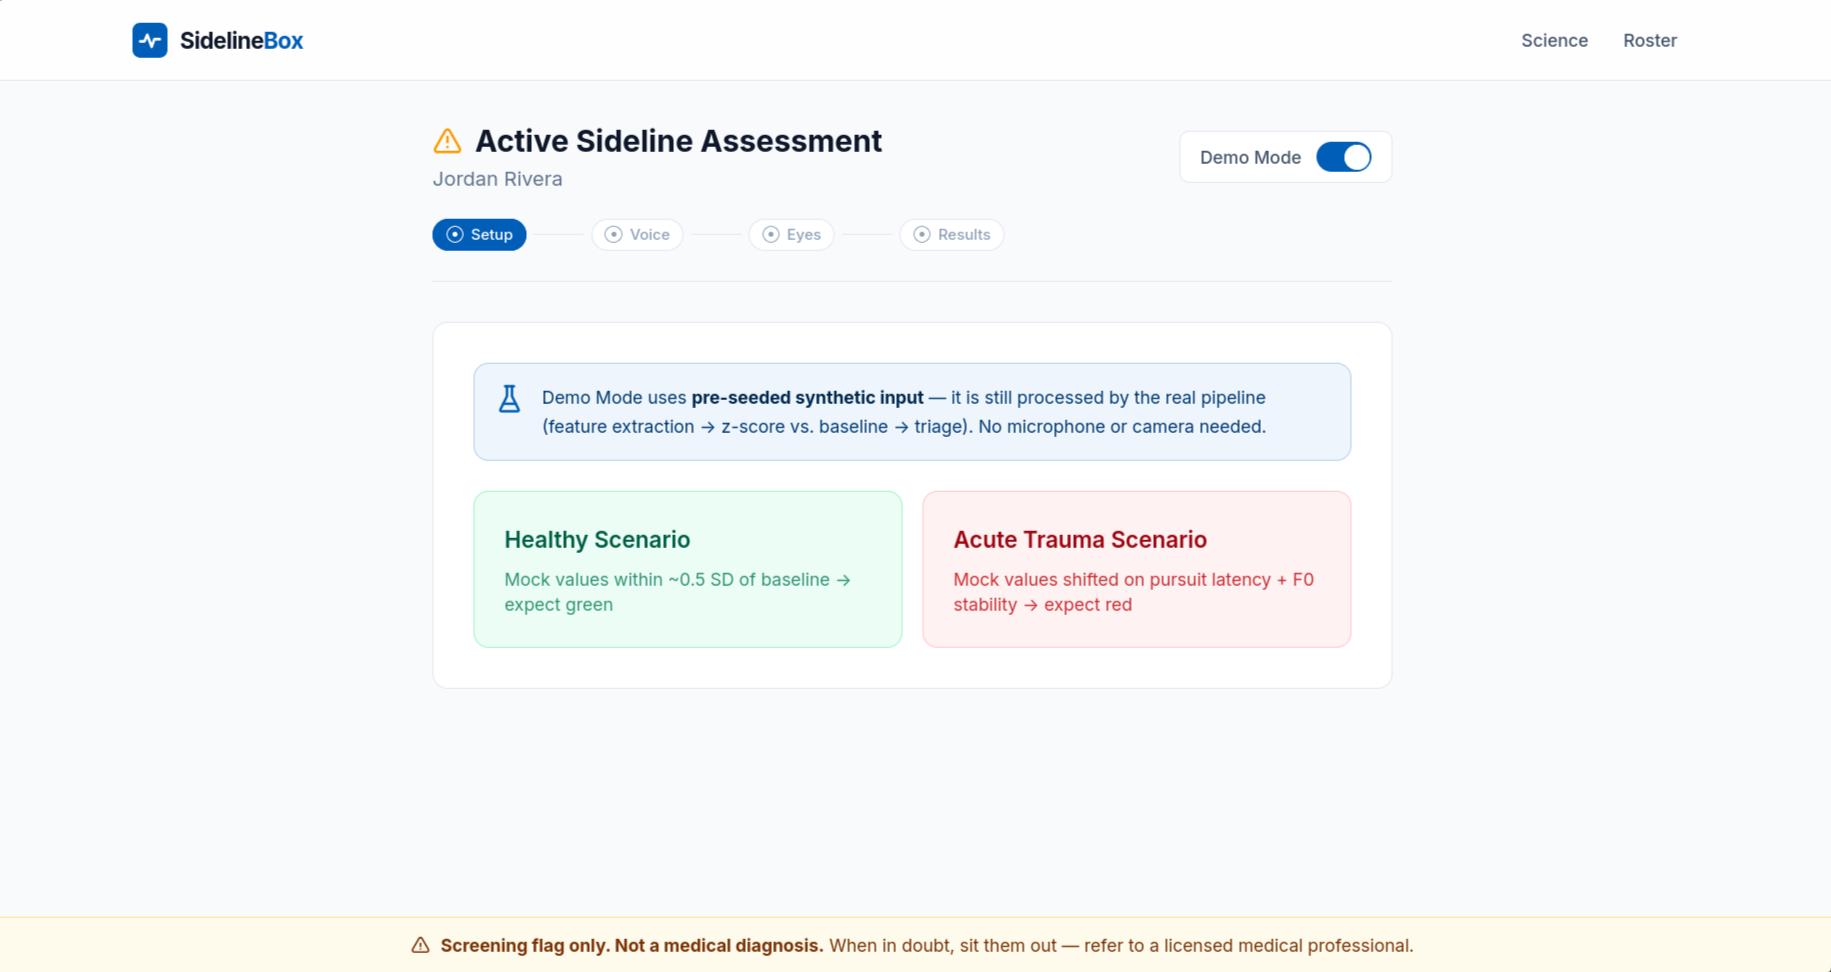
The backend is Python + FastAPI with SQLAlchemy and SQLite. Audio features come from librosa and pyworld (pitch, perturbation, pause analysis); ocular features come from MediaPipe's face mesh running in the browser. The front end is React + Vite with Tailwind — the whole screening protocol runs in a browser tab on a phone. The core idea is the personal baseline: pre-season, each athlete runs the protocol a few times to build their own distribution, and every sideline test is scored against it. I designed the pipeline so demo mode uses pre-seeded synthetic input that still runs through the real feature-extraction and scoring code — what you see in a demo is the actual pipeline, not a mock screen. The demo story itself got a surprising amount of engineering: two athletes, one healthy control and one with a full game-day-hit arc (green × 5 → red at 3.6σ → yellow → back to green), generated deterministically so it's identical on every reset. I fuzz-tested the feature extraction across thousands of trials to make sure the scoring was stable and reproducible.
Challenges I ran into
The first honest challenge was trust: if the demo data is fake, why should anyone believe the real thing? So I built demo mode to run the genuine pipeline — seeded input, real extraction, real z-scores — and kept a "screening flag, not diagnosis" disclaimer everywhere. Making the tool look trustworthy was harder than making it work. Technically, the pursuit-latency measurement was the nastiest problem. The naive approach — correlate the target's direction changes with the gaze's direction changes — is full of edge cases: lost faces, blinks, jitter. I went through several rounds of smoothing and a two-pointer correlation to get a latency estimate that behaves. I also chased our fair share of MediaPipe runtime issues and camera failures, and learned to build "skip camera" fallbacks into everything. And then there was scope discipline. It's a hackathon. At some point I had to stop adding features and instead cut, polish, and redo the entire UI to look like a product a hospital would actually put in front of a coach — which meant ripping out our comfortable dark-purple theme and rebuilding around a calm clinical design. It was the right call.
Accomplishments that I'm proud of
- A complete screening pipeline — voice + eye tracking → seven features → z-scores → triage — running end to end, with 11 passing backend tests.
- The deterministic demo story. I can press reset in front of a judge and replay the exact same arc — the red 3.6σ flag, the next-day yellow, the return-to-play green — every single time.
- Personal baselines as the core architecture, not a feature bolted on. Every metric is scored against the athlete themselves.
- Honest framing as a first-class product decision — "screening flag only, not a medical diagnosis" is part of the design, not a fine-print afterthought.
- A UI I'm actually proud of: a calm, clinical design system with threshold ticks on the biomarker bars and a triage moment that reads the way a sideline decision feels.
- Practical tooling around the core: print-ready PDF reports and one-click CSV export, because a screening tool that can't be documented wouldn't survive a week in the real world.
What I learned
Personal baselines matter more than clever algorithms. Most of the value in this project isn't a fancy model — it's the decision to compare each athlete against themselves, which removes the noise that makes population-based screening so unreliable. I also learned that a demo is a product decision. A deterministic story you can replay beat random fake data on day one, and it forced us to keep the demo path honest (real pipeline) instead of building a separate fake screen that would have rotted. And I learned that "it works" is not the same as "it's trustworthy." The framing disclaimer, the report exports, the injury context kept separate from the math — those are the details that turn a tech demo into something people can imagine a coach actually using.
What's next for SidelineBox
First: validation. The algorithms are real, but the pipeline needs structured trials and clinical collaboration before any claim beyond "screening flag" is defensible. I'd love to work with athletic trainers to collect real baseline-and-recovery data over a season. Then: the team dashboard — a coach's view across a whole roster, with trend alerts and recovery trajectories; push notifications to a medical contact when a red flag drops; and multi-lingual protocols, because sidelines don't speak one language. Further out, the pipeline is designed to absorb more modalities — reaction time, balance via gyroscope, maybe wearable integration — all scored the same way: against the athlete's own baseline. And I want to keep making it faster and more robust on low-end phones, because that's where the game is actually played.
Built With
- css3
- fastapi
- javascript
- python
- react
- sqlite
- typescript
- vite

Log in or sign up for Devpost to join the conversation.