-
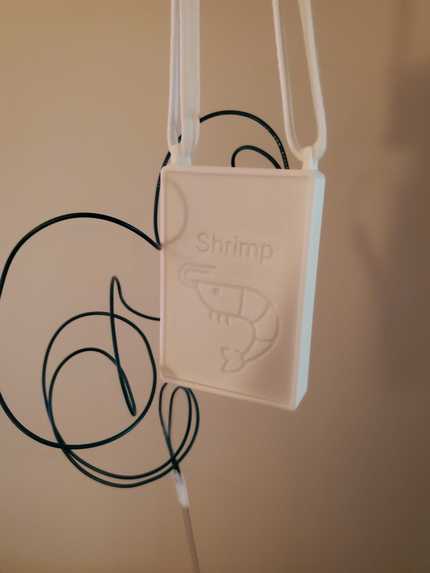
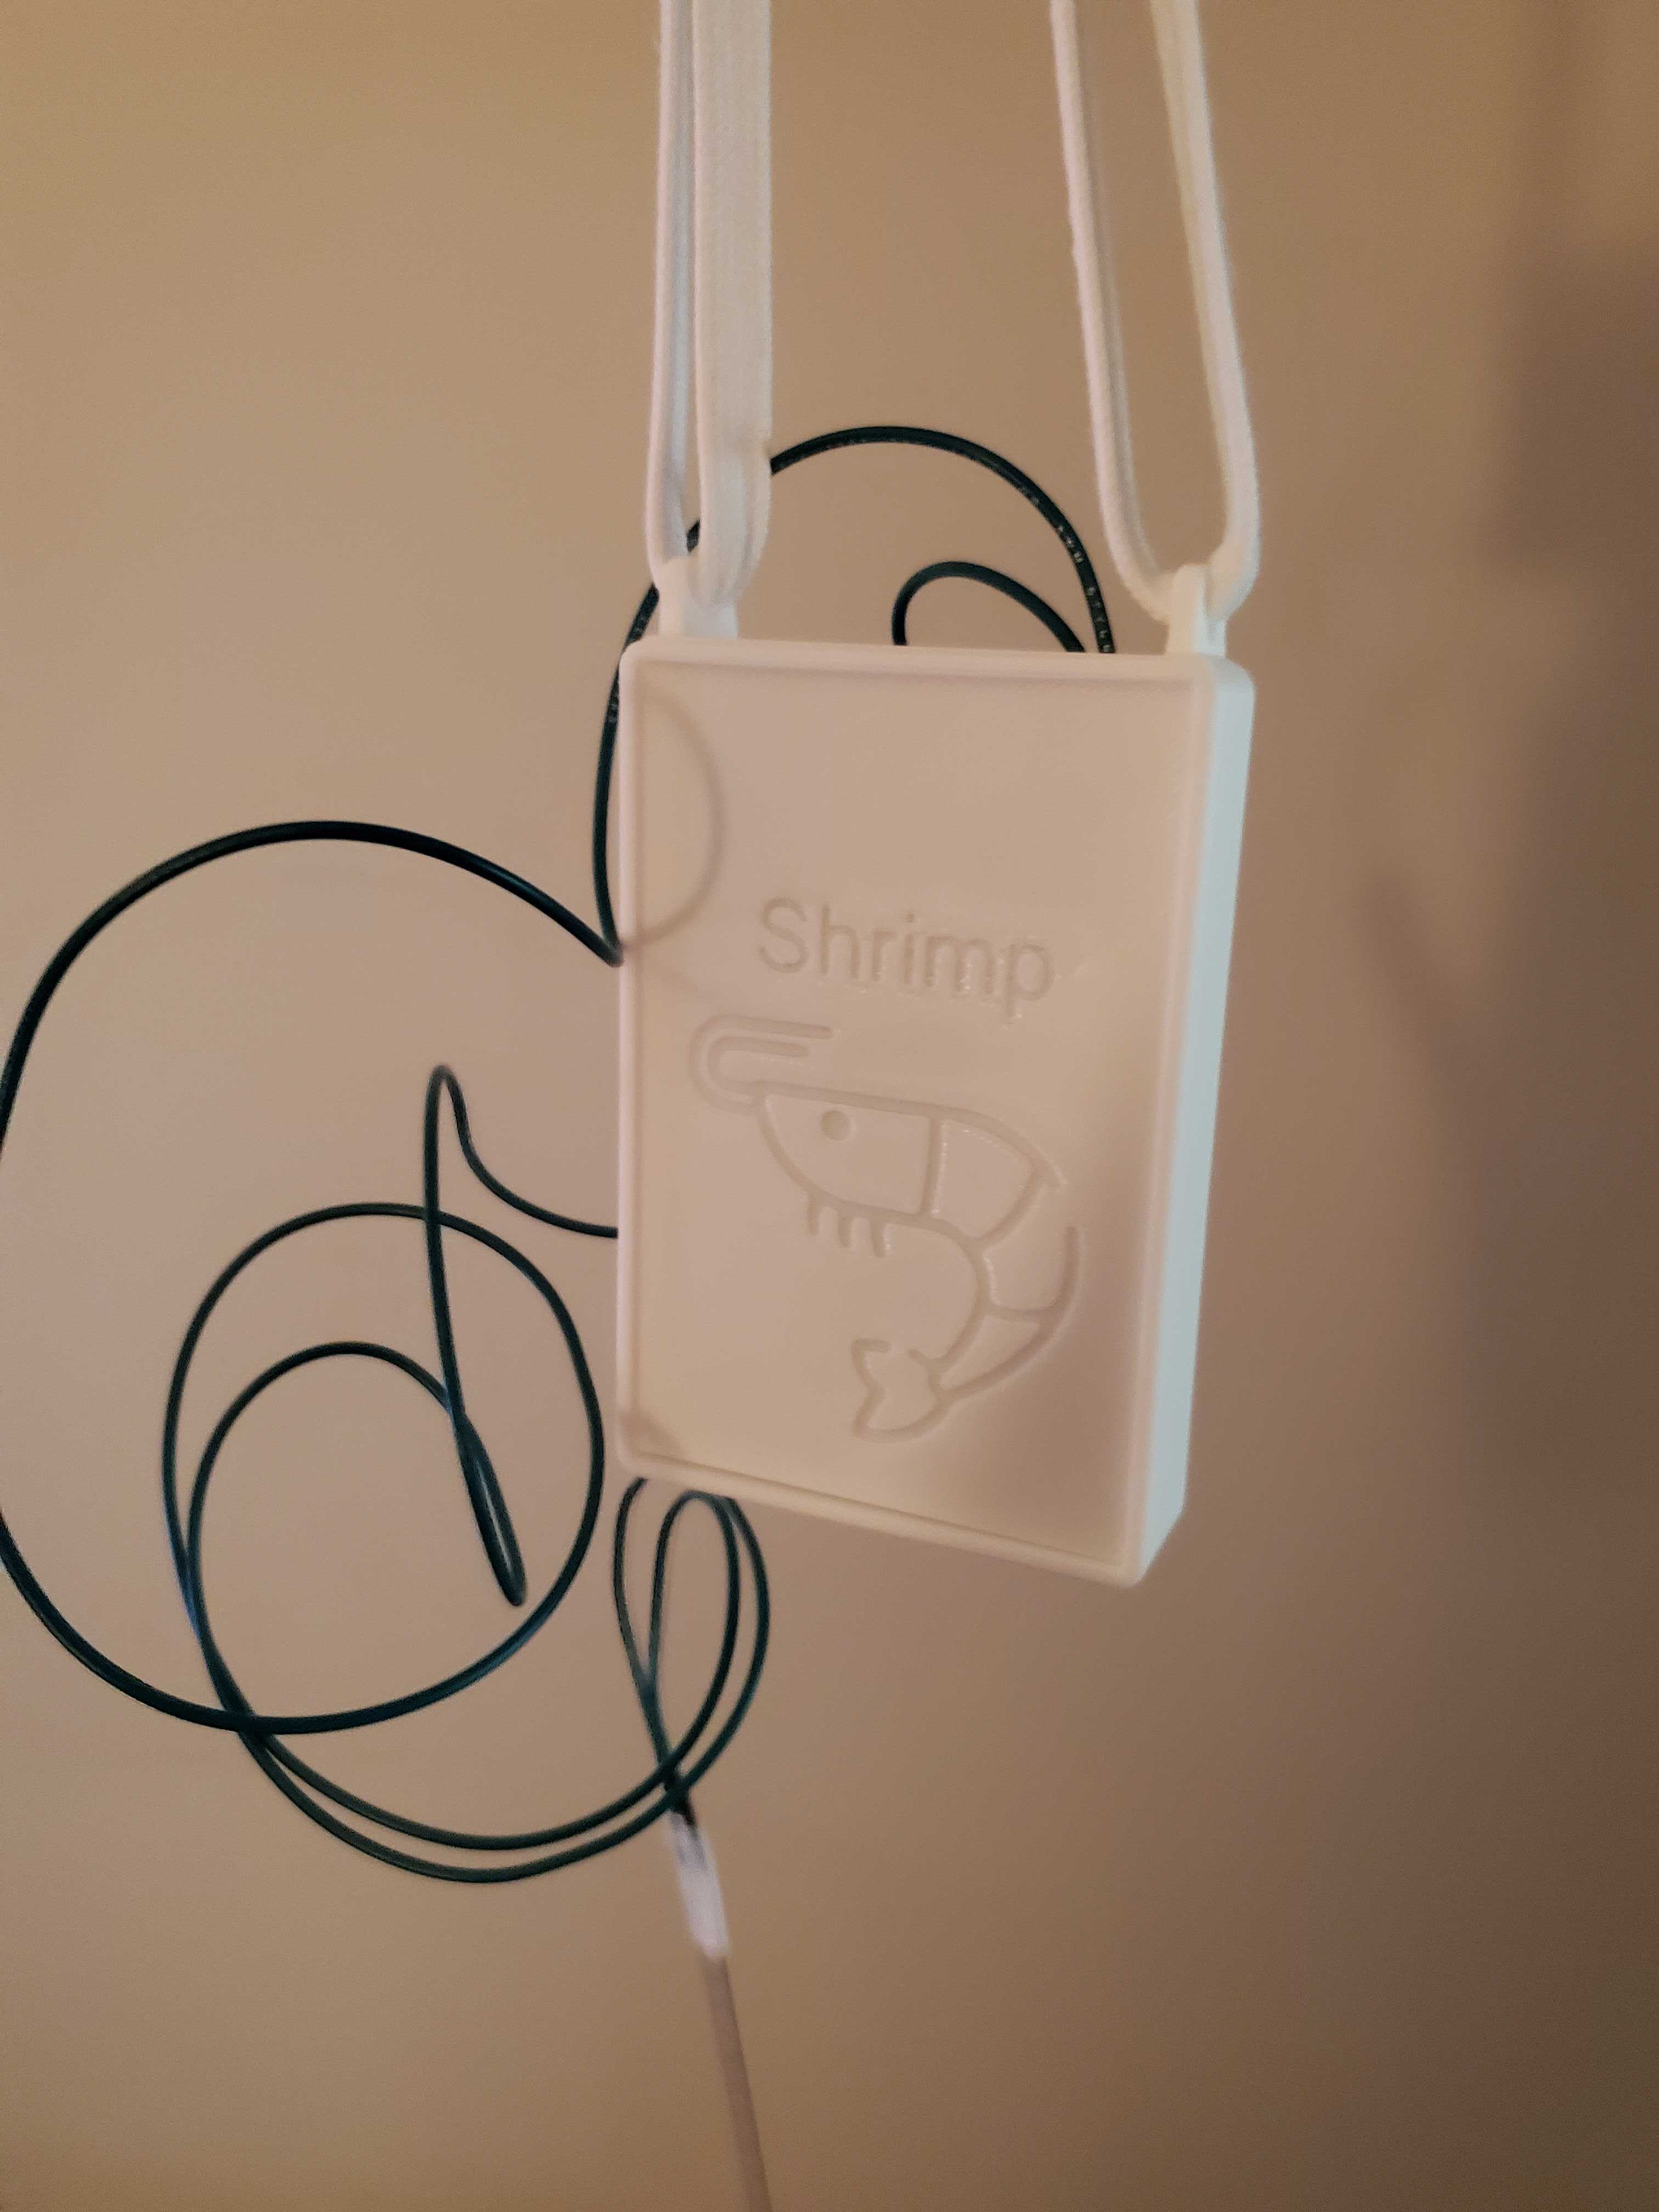
Finished Product (Pendant)
-
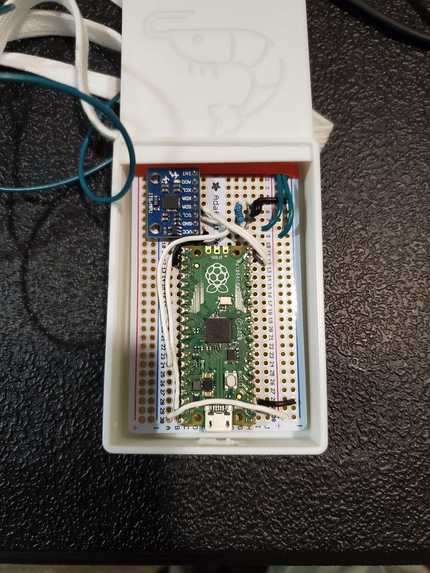
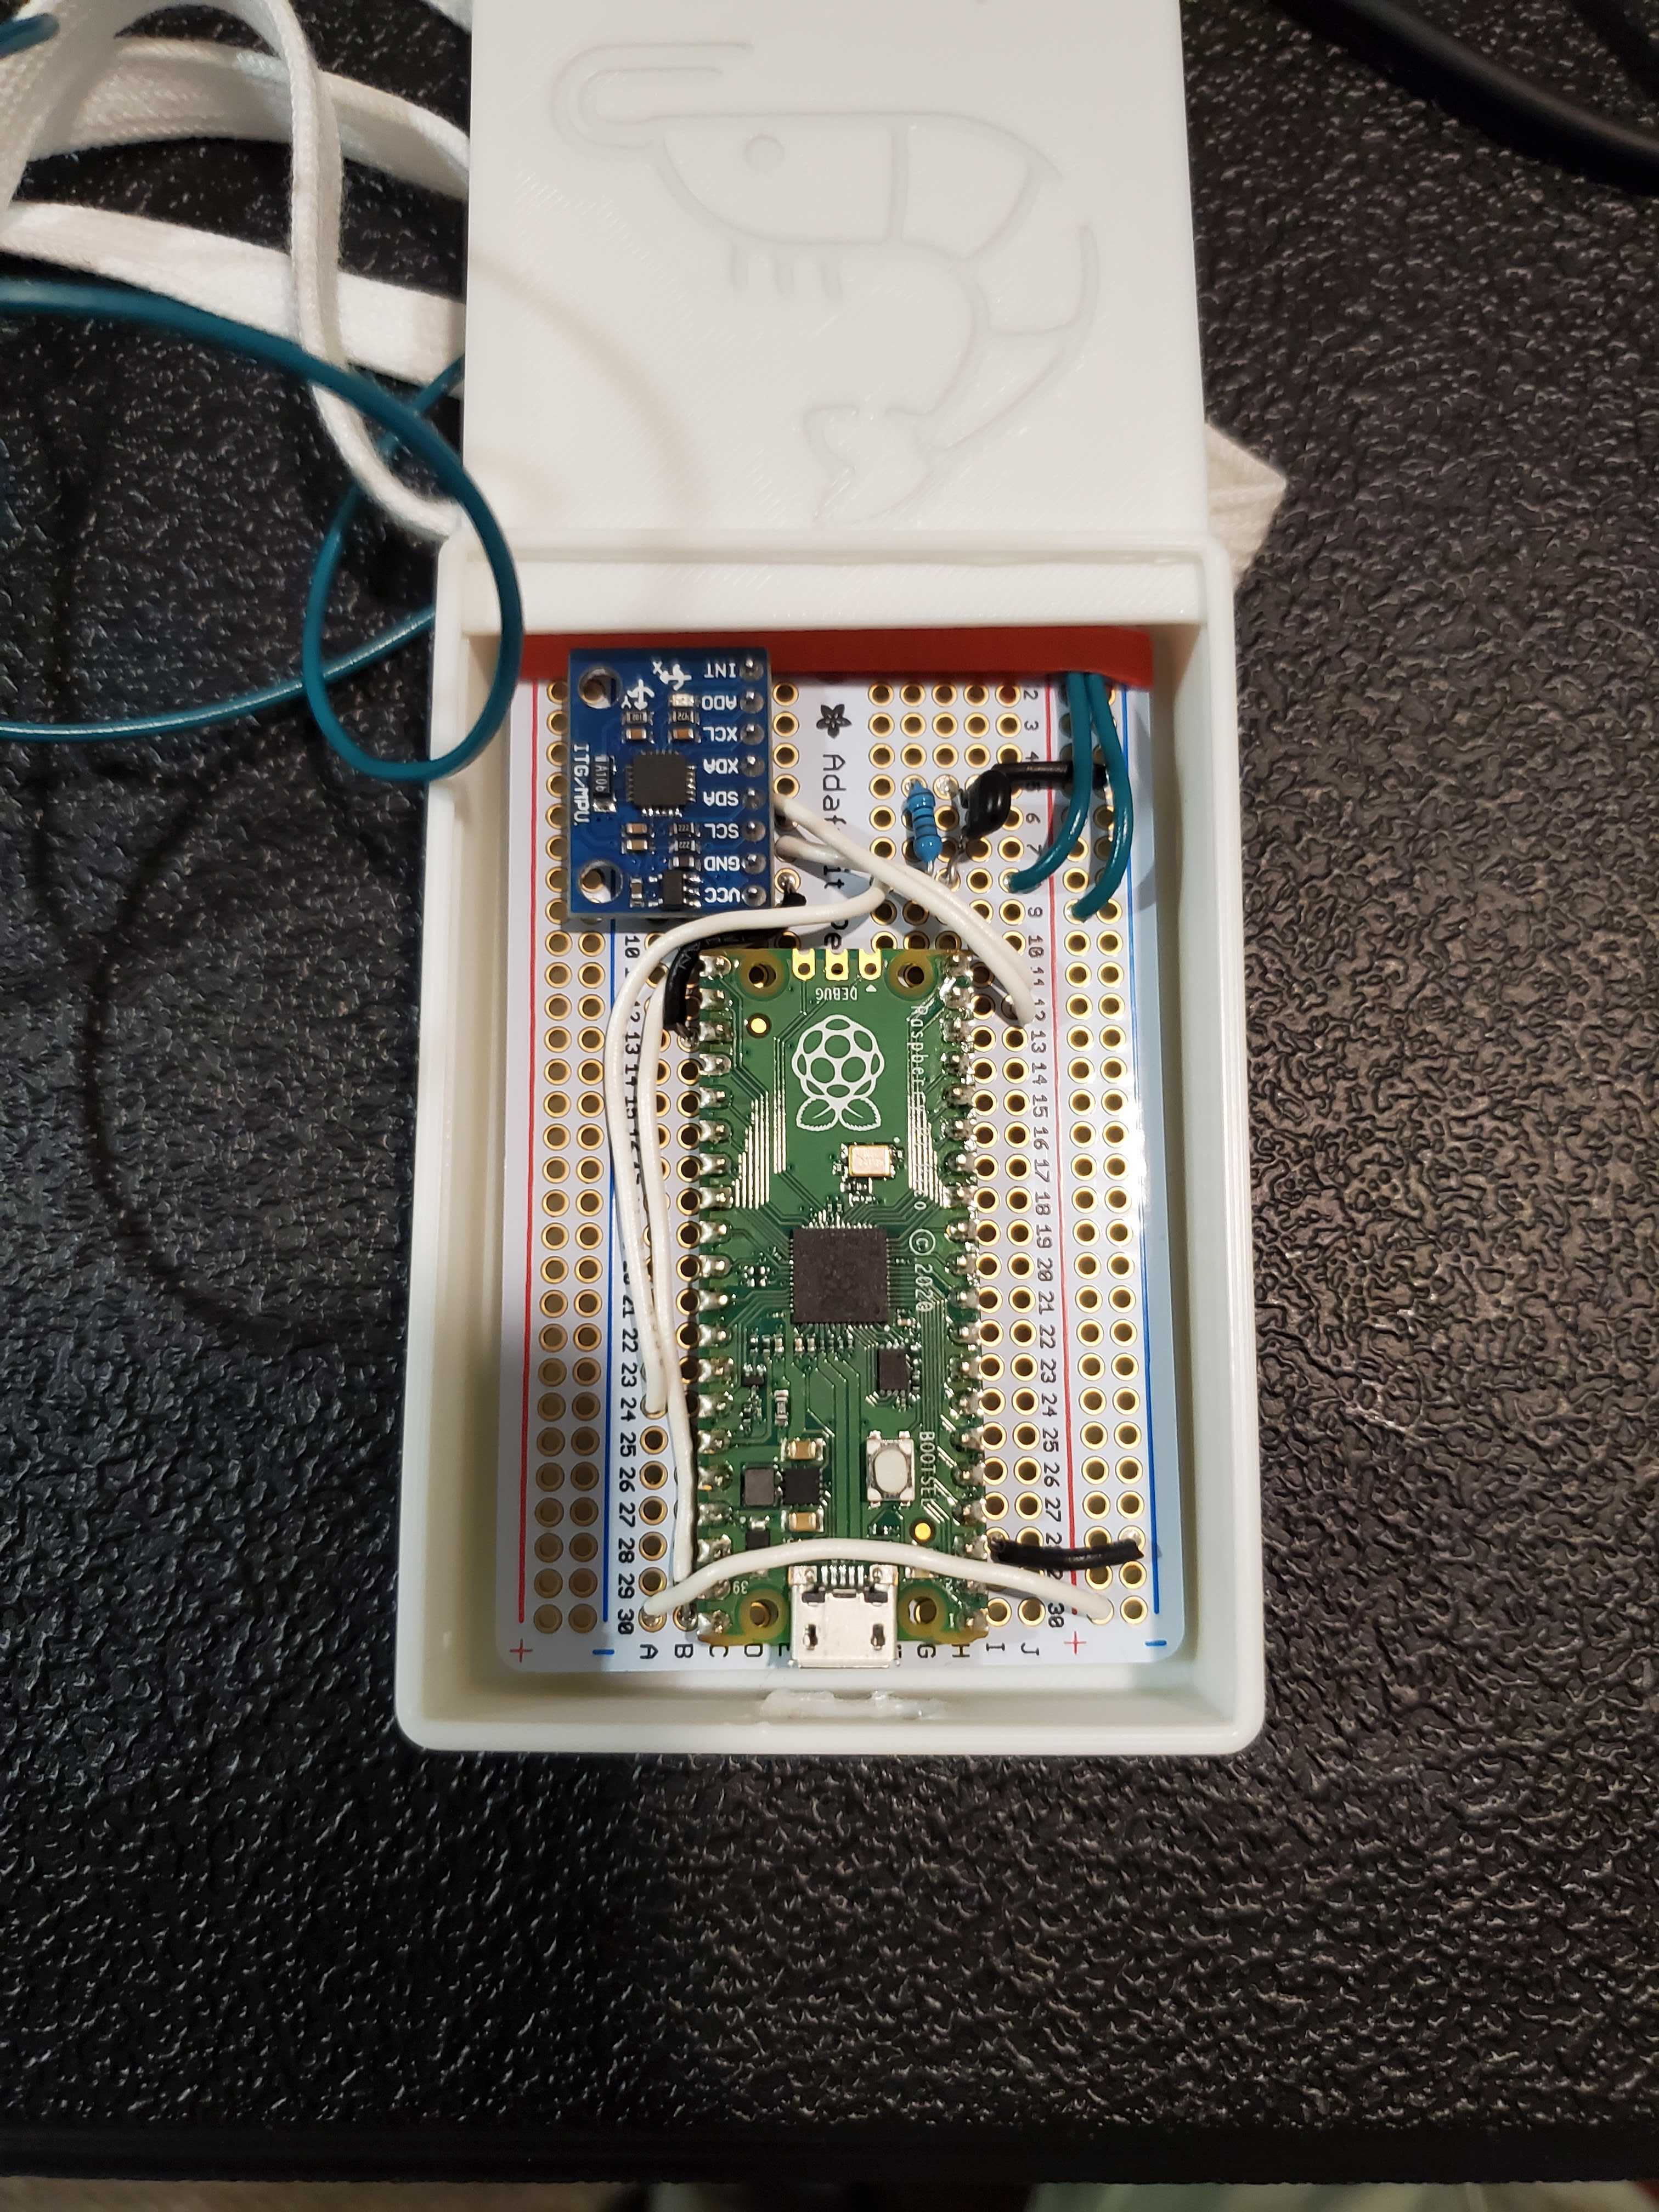
Internal Hardware
-
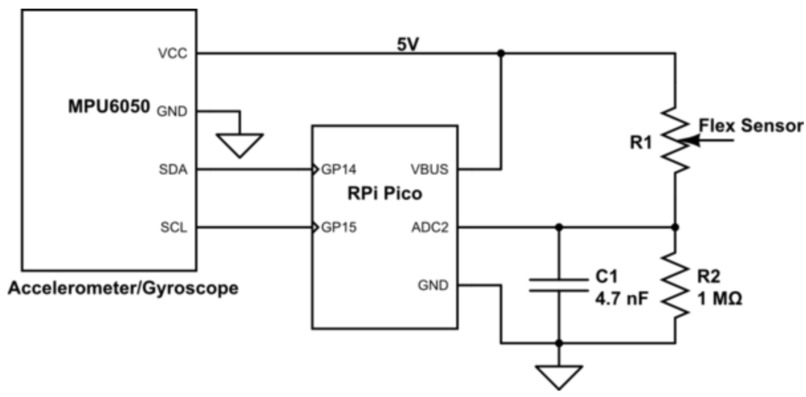
Hardware Schematic
-
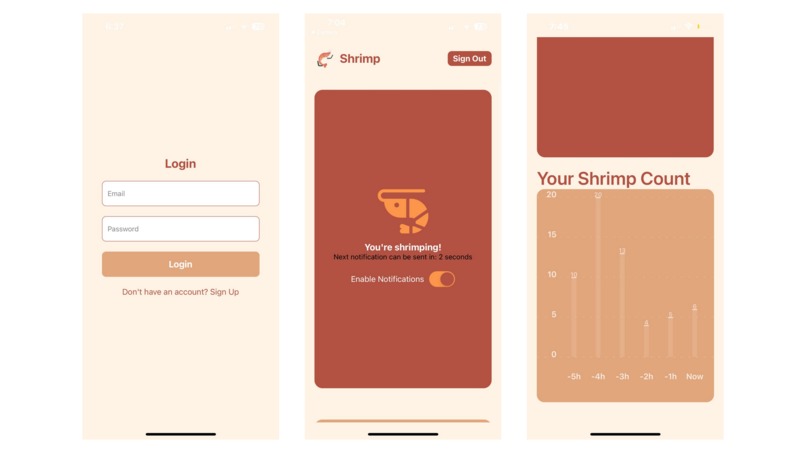
App


Inspiration
We were thinking of ways to improve people's lifestyles in simple ways. As college students, we didn't have to look much further than our often poor sitting/standing posture. In the midst of countless hours of studying, it's easy to forget about whether you're sitting straight...or like a shrimp. Sadly, by the time you realize, your neck and back are already strained. We wanted to build a product that could alleviate these issues in a creative way.
What it does
Shrimp begins with a wearable pendant device containing sensors. Using these sensors, we can detect what positional data corresponds to poor posture. Then, at any time, an app notifies users when they're "shrimping". Users can also see trends in posture over time through the app.
How we built it
The hardware incorporates three major components: a Raspberry Pi Pico, MPU 6050 Acceleromter/Gyroscope, and a flexible variable resistor. Component selection came down to what functionality we were looking for, and we narrowed down the product to detecting whether the user is slouching or not rather than precisely quantifying posture. We prototyped the system on a breadboard and ran preliminary tests. From these trials, we found that the flexible sensor was incredibly noisy and gave us unreliable data. To fix this, we fine-tuned the peripheral circuitry to ensure that the Analog-to-Digital Converter (ADC) on the microcontroller would receive cleaner data. We also added a simple RC low-pass filter using a capacitance value derived from a cutoff frequency of around 33Hz. Although these values were calculated analytically, our final parameters came from repeated experiments and calibration. The effort paid off because the difference in data quality was night and day, and this provided the software side better data. We kept the chassis minimalistic and made a box to hold and protect the circuitry. The CAD design was 3D printed at the Maker Club.
For the software, we built a React Native app that connects users with real-time data visualizations and notifications. The app utilizes WebSockets to fetch live data and display it in graphs. The Graphs component renders a bar chart using the react-native-chart-kit library, visualizing data streamed via the WebSocket. The Home screen has a scrollable layout, where users can see real-time notifications and bar charts displaying current statistics. We implemented an animated header that fades and shrinks as users scroll.
A key feature is the login system, built with the Pinata API. The app securely fetches user data stored on Pinata's IPFS gateway to verify credentials. Upon successful login, users are navigated to the main screen, where they can view their data. The app's design has a clean, friendly UI with warm colors, enhancing user experience. We also allow users to sign out easily, which redirects them back to the login page. This combination of real-time data, user authentication, and intuitive design makes the app interactive and user-friendly.
Challenges we ran into
We ran into many obstacles along the way in the hardware. The dimensions on our 3D printed chassis were a bit off and required adjustments. It was also difficult to work with the noisy signals coming from the flex sensor and required us to get creative with the circuitry. Finally, we encountered many issues with serially transmitting data from the Pico to our laptop, but we found a convenient Python library that alleviated the issues.
One of the main challenges we faced on the software side was retrieving data through the WebSocket connection. On some systems, we encountered issues where certain IP addresses were refused, causing interruptions in receiving real-time data. Debugging and resolving this required extra effort, as it was inconsistent across different environments. Another significant challenge was formatting the bar graph in React Native. We faced difficulties ensuring the graph was displayed properly, especially with resizing and scaling the data dynamically. React Native's handling of the graph library presented bugs that were tough to resolve within our limited time.
Additionally, we struggled with balancing our ambitious goals against the constraints of the hackathon's short timeframe. We had many features we wanted to implement, but time limitations meant we had to prioritize core functionalities. Deciding which aspects to leave out was difficult, as every feature felt important to the overall user experience. These challenges, however, taught us valuable lessons in troubleshooting, optimizing code, and managing scope within tight deadlines.
Accomplishments that we're proud of
We’re especially proud of our ability to bring our idea to life by seamlessly integrating the hardware with the software. This was no small feat, and getting the real-time data from the hardware to display in the app felt like a major win.
What we learned
One of the biggest lessons we learned during this project was how the last 10% of the work can often take as long as, or even longer than, the first 90%. As we approached the final stages, we found that seemingly small tasks, like fine-tuning the WebSocket connection, resolving graph formatting issues, and debugging minor design elements, took much more time than we anticipated. These challenges gave us a real appreciation for the level of detail and effort required to polish a project, even when it feels like you're almost done.
What's next for Shrimp
The pendant design was nice for a prototype, but much too large for an everyday wearable device. By integrating the components into a PCB, Shrimp’s footprint could easily be minimized to an unnoticeable size. The flex sensor is also difficult to keep on and uncomfortable for the user, so working with the textiles industry on incorporating the sensor with clothing would be a great step forward for Shrimp.

Log in or sign up for Devpost to join the conversation.