Inspiration
Many teams still take too many low-value mid-range shots. We wanted a quick way to see which court zones actually score best and how many points are lost by poor shot selection.
What it does
ShotSense takes shot-level data (player, x, y, made) and:
- Classifies every shot into 5 zones: rim, paint, mid-range, corner 3, above-the-break 3
- Computes FG% and points per shot for each zone
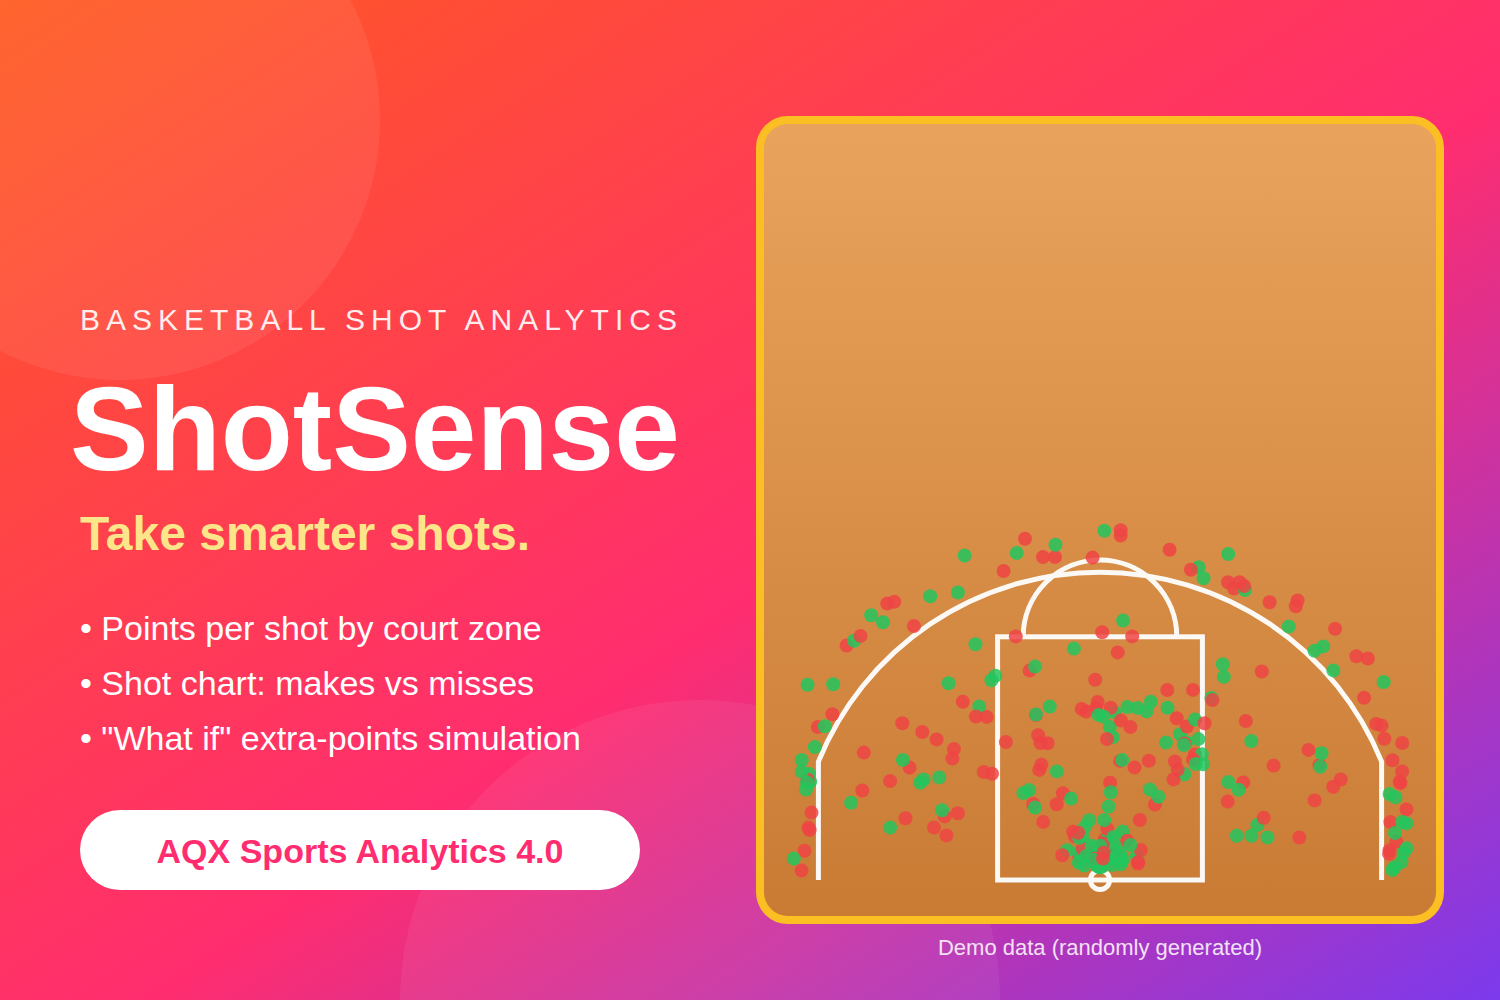
- Draws a shot chart (makes in green, misses in red)
- Simulates how many points a player would gain by moving 10% of their shots from mid-range to their most efficient zone
How we built it
Pure HTML, CSS and JavaScript. Everything runs in the browser, with no backend and no install. Zones are computed from NBA court coordinates, and the chart is drawn on a canvas.
Challenges
Defining zones correctly from raw coordinates (the corner 3 vs. the arc), and building the project within the hackathon's time limit.
What we learned
Points per shot is a much clearer way to compare zones than FG% alone.
What's next
Real NBA data via nba_api, defender-distance adjustment, team comparisons, and exporting reports.
Note: the built-in demo data is randomly generated, not real. Upload a real CSV to analyze real players.

Log in or sign up for Devpost to join the conversation.