Inspiration Modern digital production pipelines and distributed cloud systems generate an overwhelming flood of telemetry. When a critical pipeline breaks, on-call engineers are inundated with alert fatigue, manually jumping between disjointed dashboards, tracing log streams across services and struggling to piece together why a sequence failed while production stalls.
ShotOps was inspired by the vision to automate this manual triage loop completely: creating an autonomous incident response agent that actively investigates live production telemetry, identifies the root cause and delivers an actionable operational postmortem in minutes.
What it does ShotOps serves as an autonomous Site Reliability Engineer specifically tailored for production pipelines:
Autonomous Incident Triage: Receives natural language incident reports (e.g., sequence failures in production environments) and formulates a diagnostic strategy without human intervention.
Live Telemetry Querying: Interacts directly with observability platforms, running real-time PromQL queries against Prometheus metrics and LogQL queries across Loki log streams.
Evidence Based Reasoning: Evaluates container health, error rates, and resource spikes, strictly separating verified telemetry facts from working operational hypotheses.
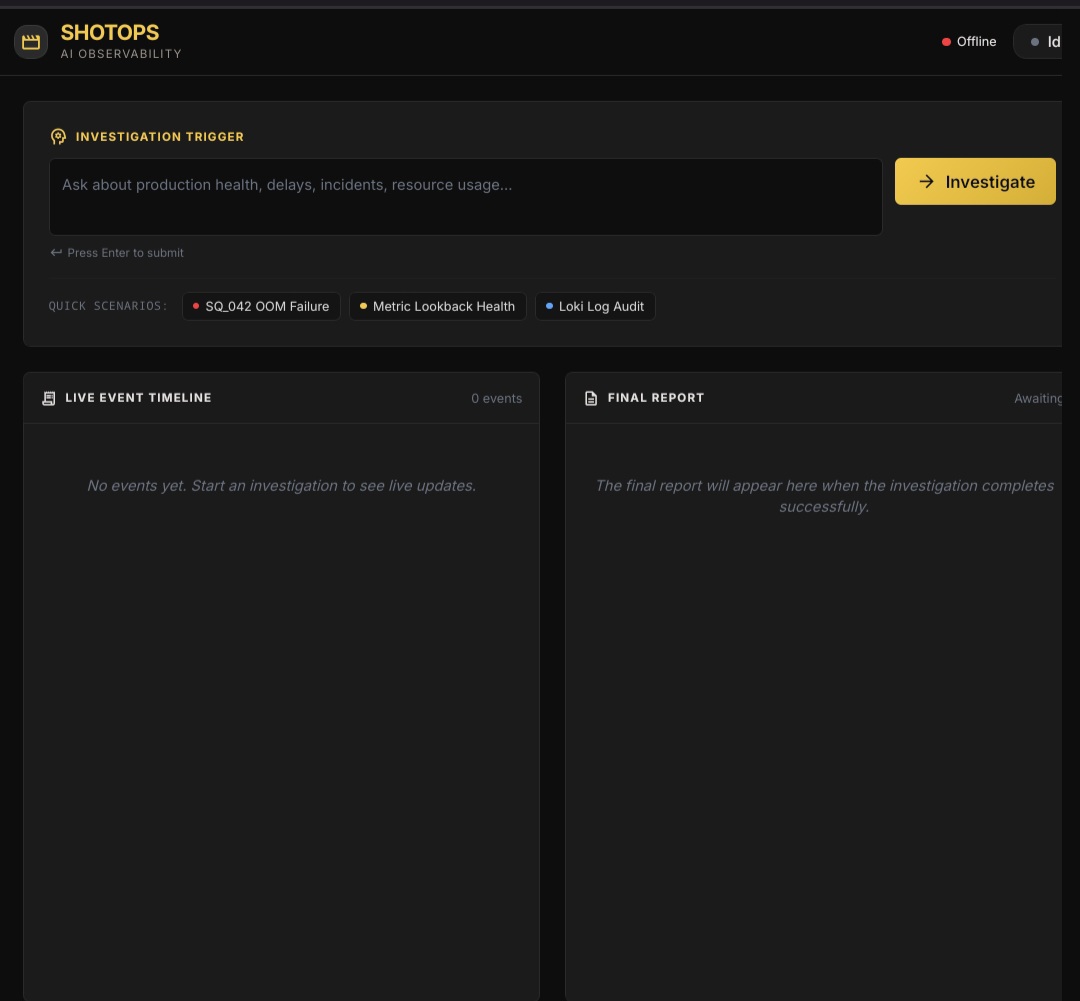
Real Time Streaming: Streams every reasoning step, tool invocation and diagnostic check to the client interface via Server Sent Events (SSE) for transparent auditability.
Actionable Postmortems & Deep Links: Synthesizes a structured incident report containing concrete remediation steps (e.g., container memory limits and texture cache adjustments) along with direct deep links into Grafana Cloud explore consoles for human verification.
How we built it The system architecture combines agentic orchestration with production observability:
Autonomous Reasoning Core: Built using the Google GenAI SDK (gemini-flash-lite-latest) to orchestrate multi-step autonomous tool calls, parse telemetry streams, and generate structured diagnostic evaluations.
Observability Integration: Directly integrated with Grafana Cloud (jovialcatamaran1158.grafana.net), issuing authenticated HTTP queries to Prometheus endpoints (/api/v1/query) for error metrics and Loki endpoints (/loki/api/v1/query_range) for log trace analysis.
Backend & API: Developed with FastAPI and Python 3.11, providing asynchronous REST endpoints for investigation dispatch and an SSE event streaming interface for live telemetry logs
Cloud Infrastructure: Containerized with Docker and deployed on Fly.io bare-metal microVMs, ensuring an environment free from cloud metadata interference with warm, persistent single instance execution.
Verification Example: # Dispatch autonomous incident investigation curl -X POST https://old-feather-2372.fly.dev/investigations \ -H "Content-Type: application/json" \ -d '{"query": "Investigate SQ_042 in SHADOW PROTOCOL"}'
Stream real-time diagnostic reasoning steps via SSE
curl -N "https://old-feather-2372.fly.dev/investigations//events"
Challenges we ran into Cloud Metadata & Token Collisions: Early deployment attempts in conventional cloud runtimes triggered metadata server collisions between host authentication tokens and application API keys. We resolved this by migrating to lightweight bare metal microVMs with strictly isolated secret environments.
In Memory State Loss on Idle Suspension: Platform default auto-sleep policies (auto_stop_machines) periodically shut down idle microVMs, purging active in-memory investigation states and terminating live SSE streams. We restructured the deployment configuration to maintain a continuously warm, persistent single machine instance.
Container Entrypoint Incompatibilities: Container boot loops occurred when default CLI wrappers expected missing optional dependencies. We resolved this by building a dedicated production Dockerfile utilizing a direct python3 -m uvicorn entrypoint.
LLM Speculation Mitigation: Large language models tend to formulate speculative hypotheses during production incidents. We engineered prompt evaluation loops that enforce a strict dichotomy between verified telemetry facts and operational inferences, requiring hard metric evidence before confirming an error condition.
Accomplishments that we're proud of [x] True Autonomous Telemetry Triage: Successfully ran end-to-end incident investigations where the agent autonomously queried live Prometheus metrics, detected 5 distinct OutOfMemoryError failures on active worker pipelines and identified missing log instrumentation without human guidance.
[x] Sub Minute Incident Turnaround: Compressed what typically takes human SRE teams 30 to 45 minutes of log digging and dashboard cross-referencing into an automated loop completed in under 60 seconds.
[x] Rock Solid Warm MicroVM Runtime: Deployed and stabilized a custom containerized architecture running an always warm backend capable of sustaining long lived SSE connections and instant request processing.
[x] High Context Auditability: Created an incident pipeline that avoids "black box" decisions, exposing every tool call, reasoning step and generated Grafana deep link to the user in real time.
What we learned Grounding Builds Operational Trust: Hooking an LLM directly into structured observability APIs elevates the system from a passive text summarizer into an active, dependable Site Reliability Engineer.
Fact and Inference Separation Is Vital: Production incident reports demand absolute clarity; forcing an agent to categorize findings into verified telemetry facts versus inferences prevents dangerous assumptions from entering operational workflows.
Direct Container Orchestration Matters: Relying on platform-managed abstractions can introduce hidden runtime issues; explicitly managing process entrypoints, environment secret isolation, and container suspension policies is essential for reliable agentic systems.
What's next for ShotOps Closed-Loop Automated Remediation: Moving beyond diagnostic recommendations to safe, opt-in execution such as automatically scaling Kubernetes pod memory requests or triggering worker restarts with automated rollback guardrails.
Proactive Anomaly Detection & Webhook Triggers: Integrating inbound alertmanager and PagerDuty webhooks so ShotOps begins autonomous telemetry investigations the moment an alert fires, rather than waiting for manual dispatch.
Multi-Cloud & Extended Observability Support: Expanding tool connectors beyond Grafana Cloud to ingest traces and metrics from Datadog, AWS CloudWatch and OpenTelemetry collector backends.
Persistent Telemetry Memory & Incident Knowledge Base: Implementing long term vector storage for past postmortems, enabling the agent to cross reference current failure patterns against historical sequence outages and resolve recurring incidents faster.
Fine Grained Human-in-the-Loop Controls: Adding interactive remediation approval gates within the web UI, allowing engineers to review, tweak and approve operational actions directly from the postmortem panel.

Log in or sign up for Devpost to join the conversation.