Inspiration
Across 5 live end-to-end trials on 8 deployed microservices, Shot-Delivery Guardian triaged simulated pipeline backlogs with 60.0% optimal decision accuracy (3/5) in an average of 44.28 seconds and zero policy violations, never once deprioritizing a client-approved, director-flagged, or dependency-blocking shot. In the 2 suboptimal trials, the runner stream returned before serializing final synthesis text, but the deterministic filter strictly prevented any unsafe recommendations.
In episodic VFX post-production, a single episode consists of hundreds of individual shots progressing through a multi-stage pipeline: Ingest ➔ Render/Comp ➔ Color Grading ➔ Quality Control (QC) ➔ Streamer Delivery. When a bottleneck occurs at a stage (such as a render queue spike or QC rework loop), traditional monitoring systems trigger alerts that flood on-call VFX supervisors. Supervisors are forced to manually open multiple dashboards, query logs, cross-reference shot dependency graphs, and guess which shot can be safely deprioritized ("bumped") without cascading delays to downstream shots or violating client approvals.
What it does
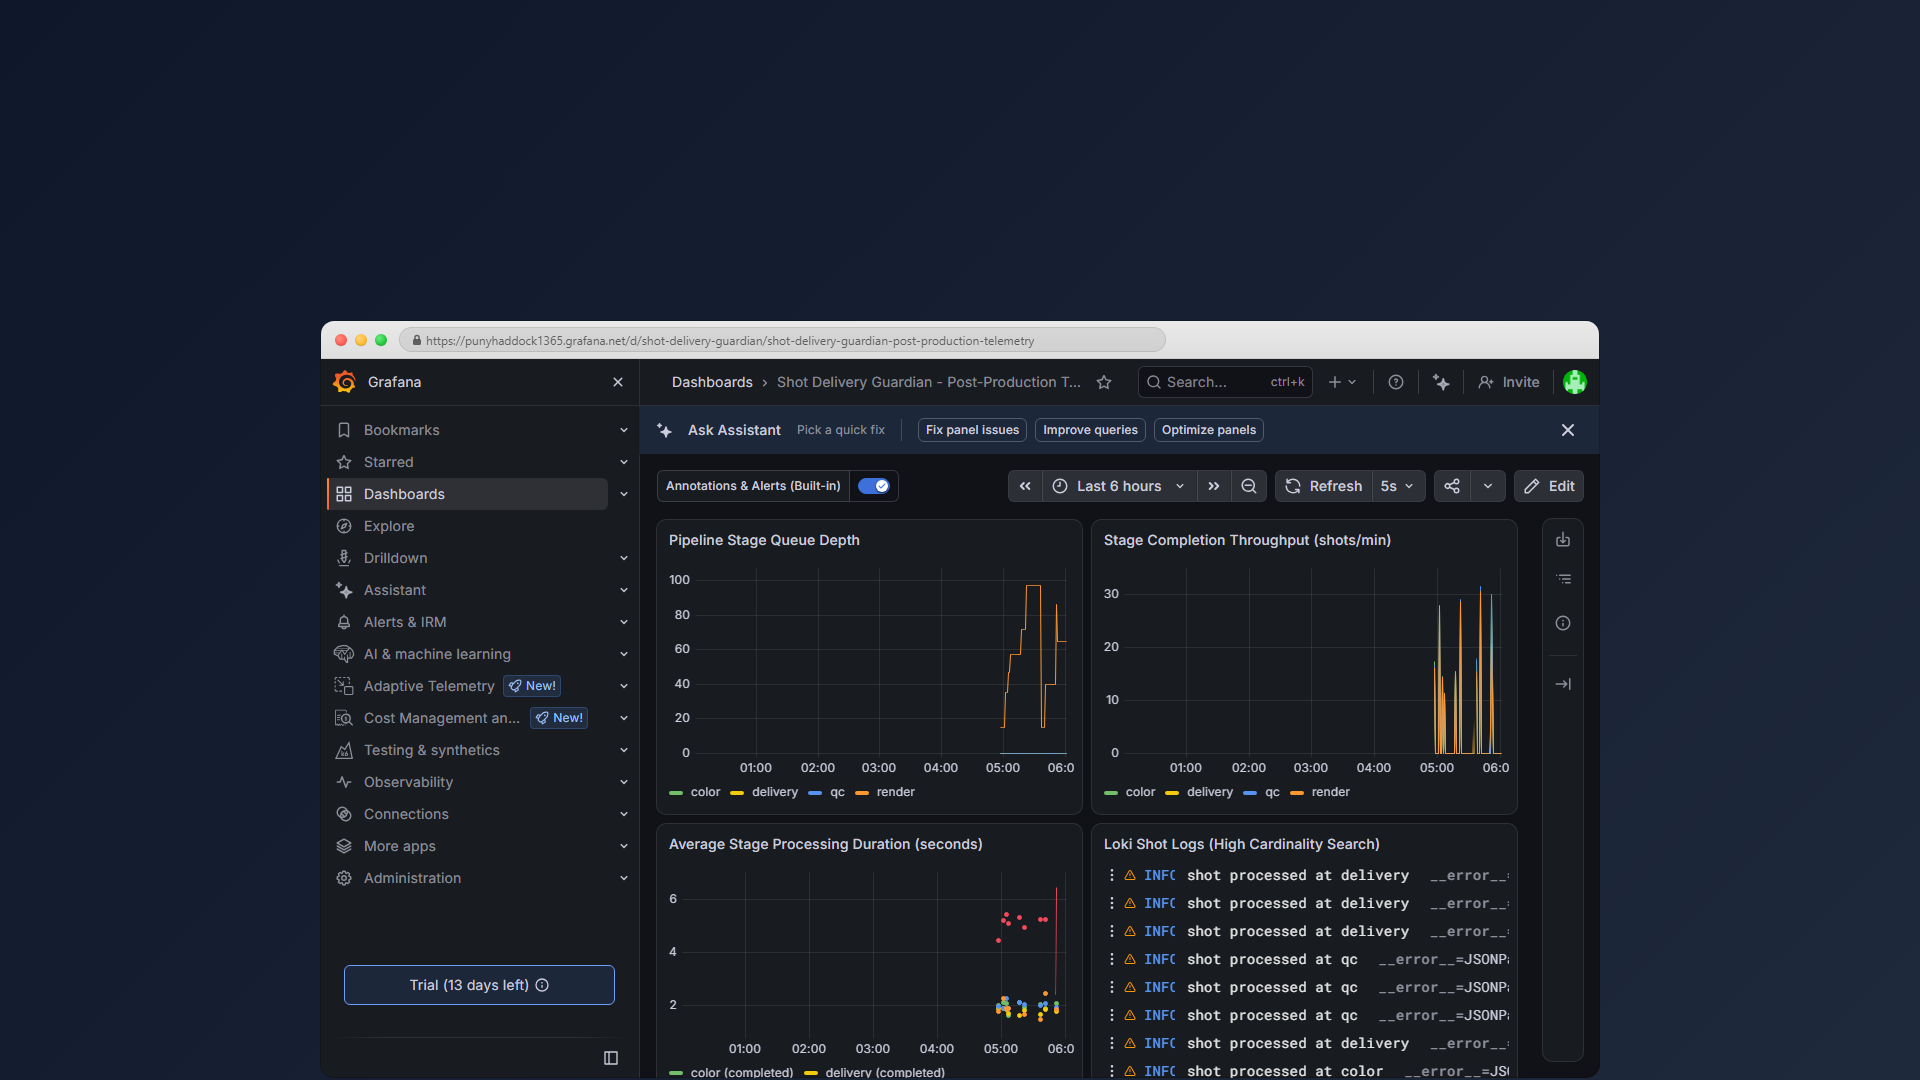
VFX supervisors work inside Grafana dashboards, message queues, and render farms. Shot-Delivery Guardian embeds Gemini directly into this native telemetry loop as an in-dashboard triage guardian designed for zero context switching, delivering multi-signal root-cause annotations directly where operators already work.
When render queue spikes or QC rework loops threaten delivery deadlines, the system automatically:
- Detects delivery risks in real time when projected render queue completion exceeds a shot's delivery deadline.
- Investigates multi-signal telemetry across Prometheus stage metrics, Loki high-cardinality shot logs, and Tempo distributed traces via Grafana Cloud Model Context Protocol (MCP).
- Evaluates bump candidates using a deterministic scoring engine that strictly protects client-approved cuts, director-flagged priority shots, and downstream dependency blockers, ranking safe targets by remaining slack hours.
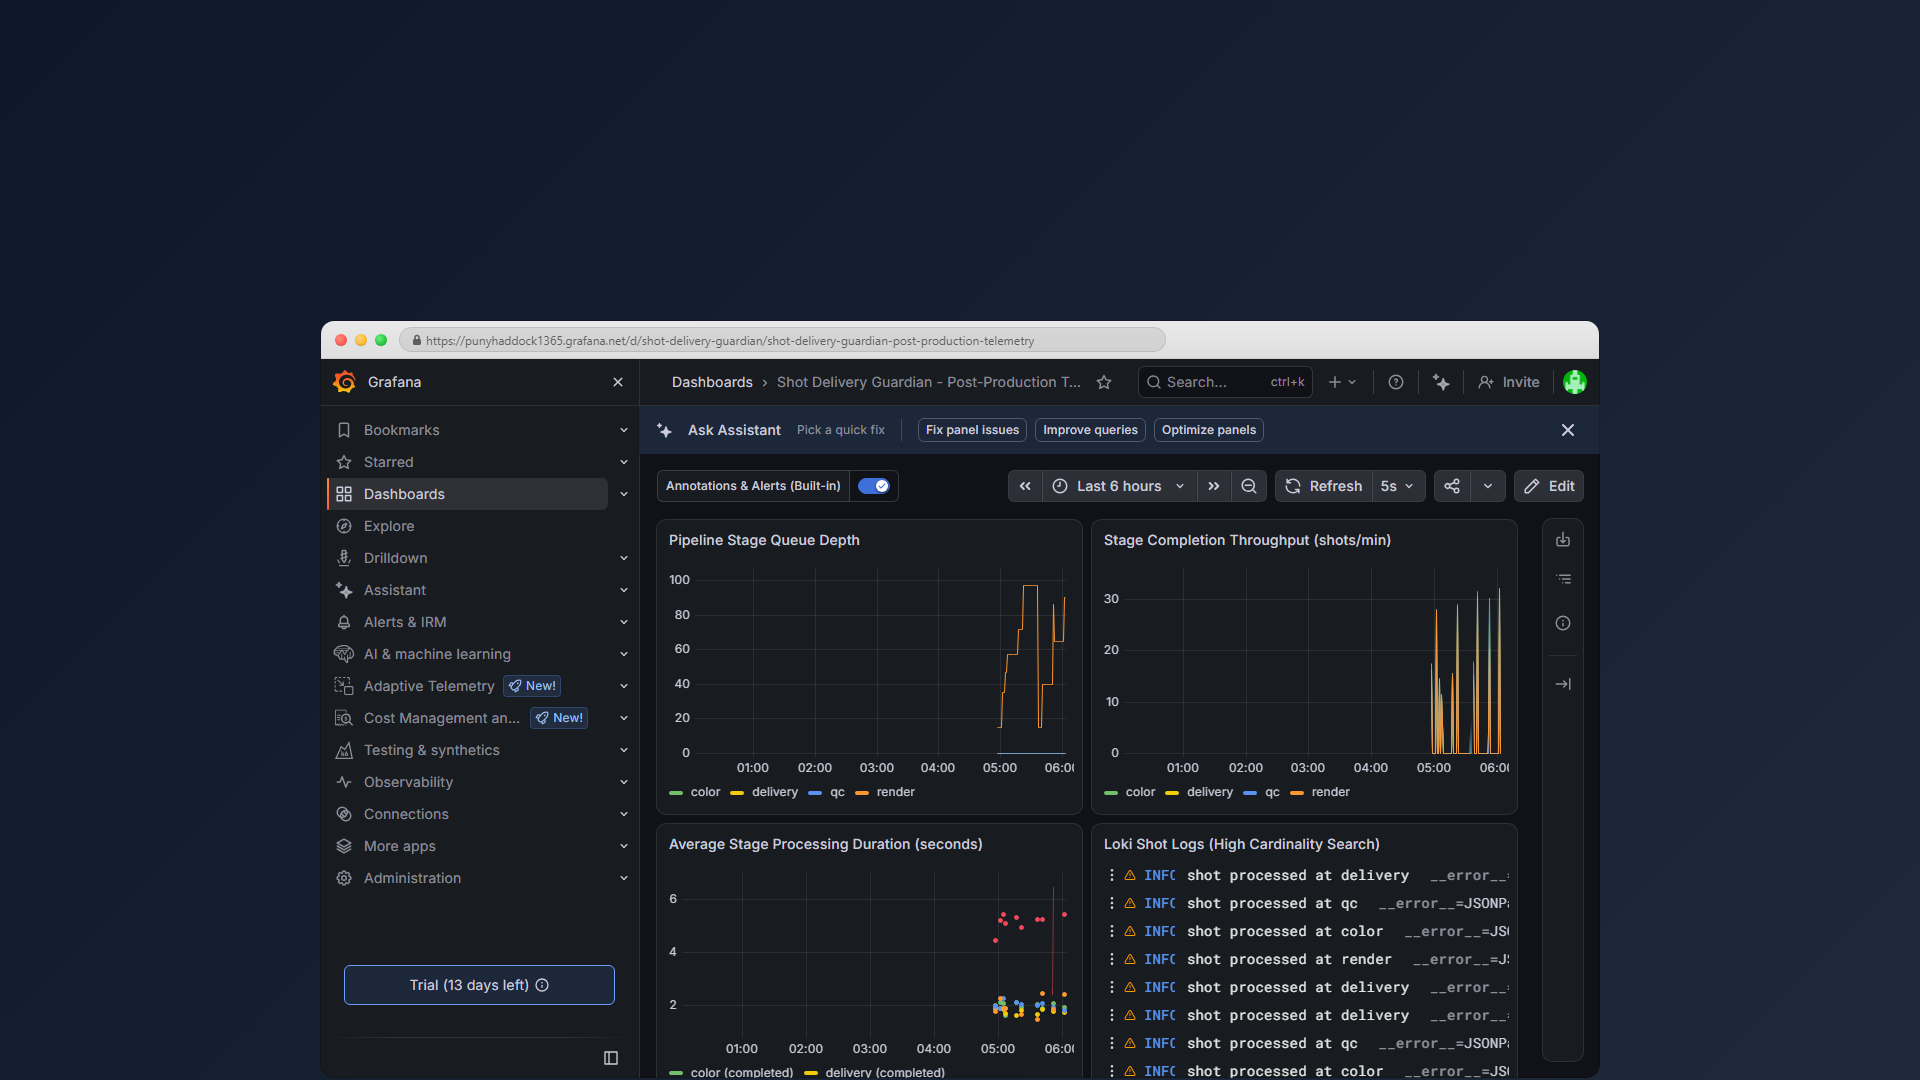
- Posts concrete root-cause analysis and actionable shot-bump annotations directly onto the Grafana dashboard without requiring human context switching.
Live deployed endpoints and telemetry:
- Grafana stack URL:
https://punyhaddock1365.grafana.net - Live dashboard: Shot Delivery Guardian - Post-Production Telemetry
- Live agent webhook endpoint:
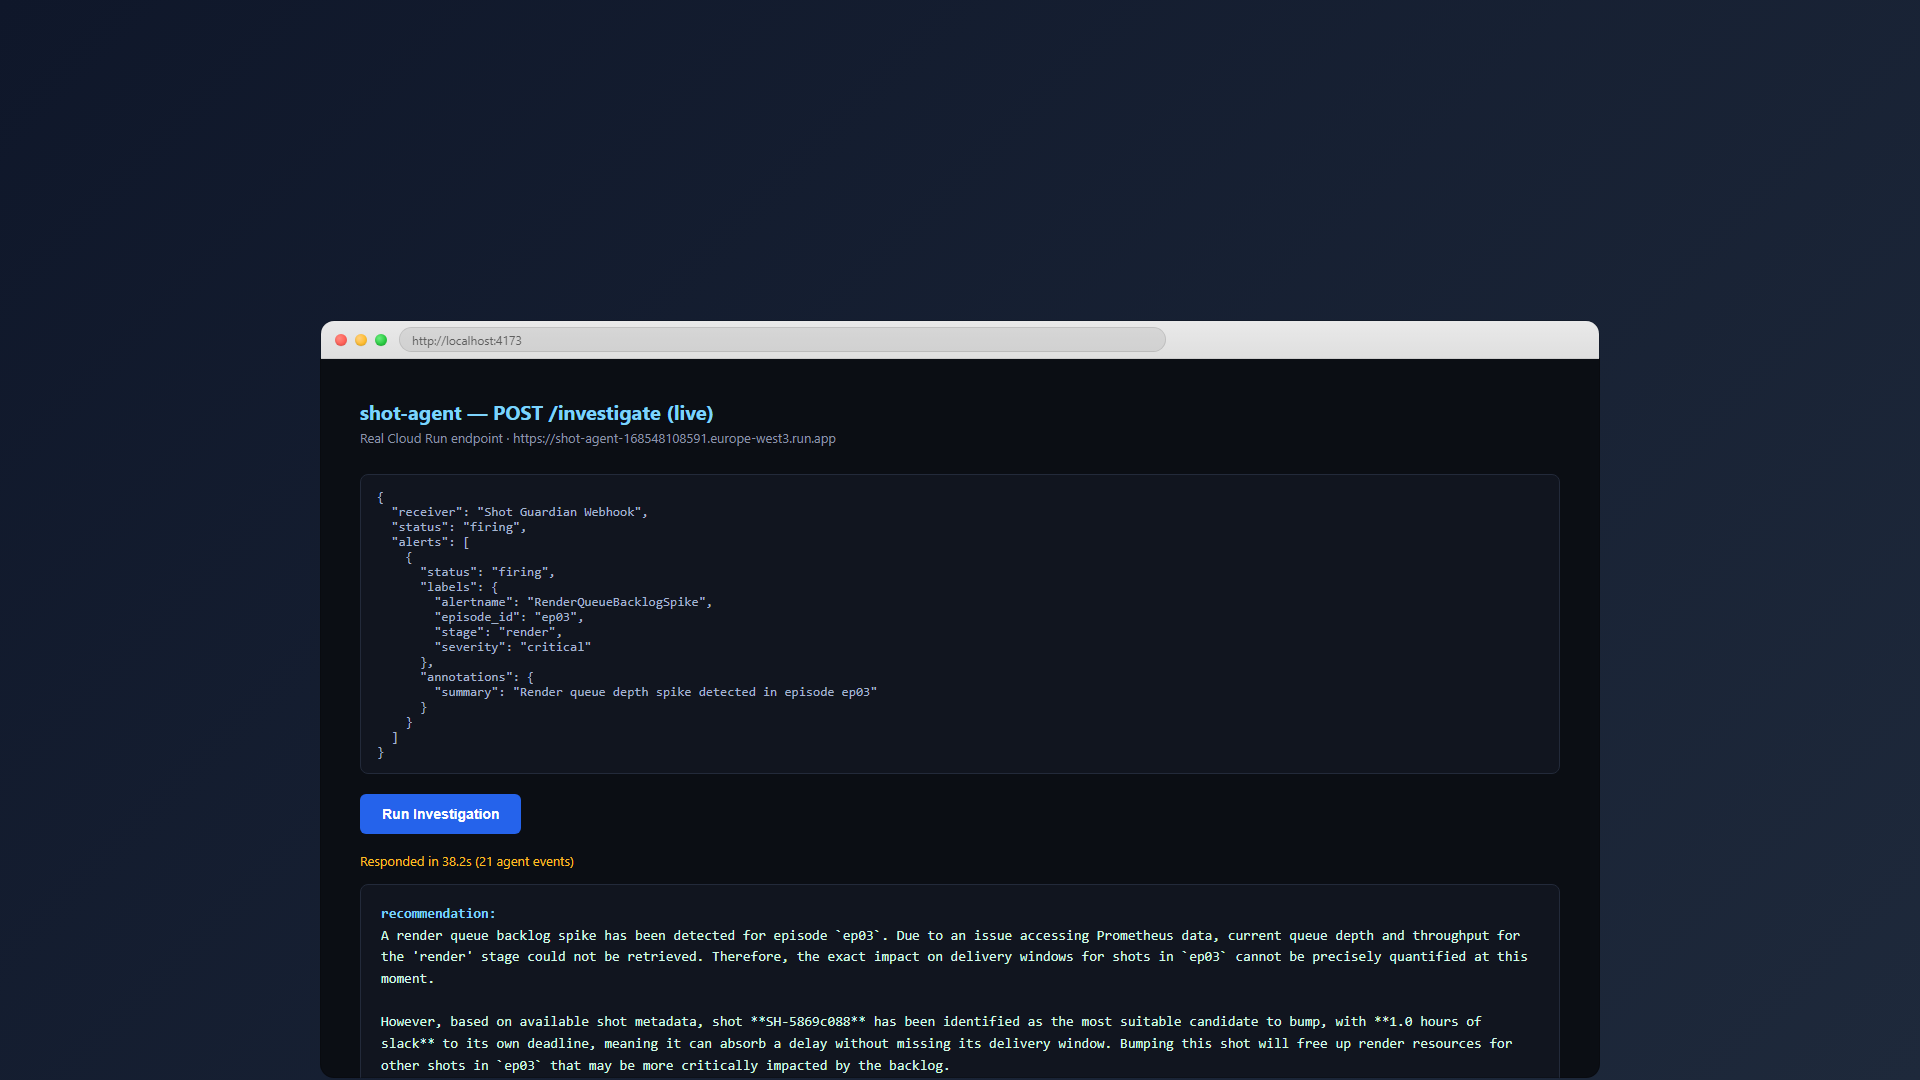
https://shot-agent-168548108591.europe-west3.run.app/investigate - Verified live HTTPS readiness and sub-second health checks across all 8 deployed Cloud Run microservices returning
200 OK.
How we built it
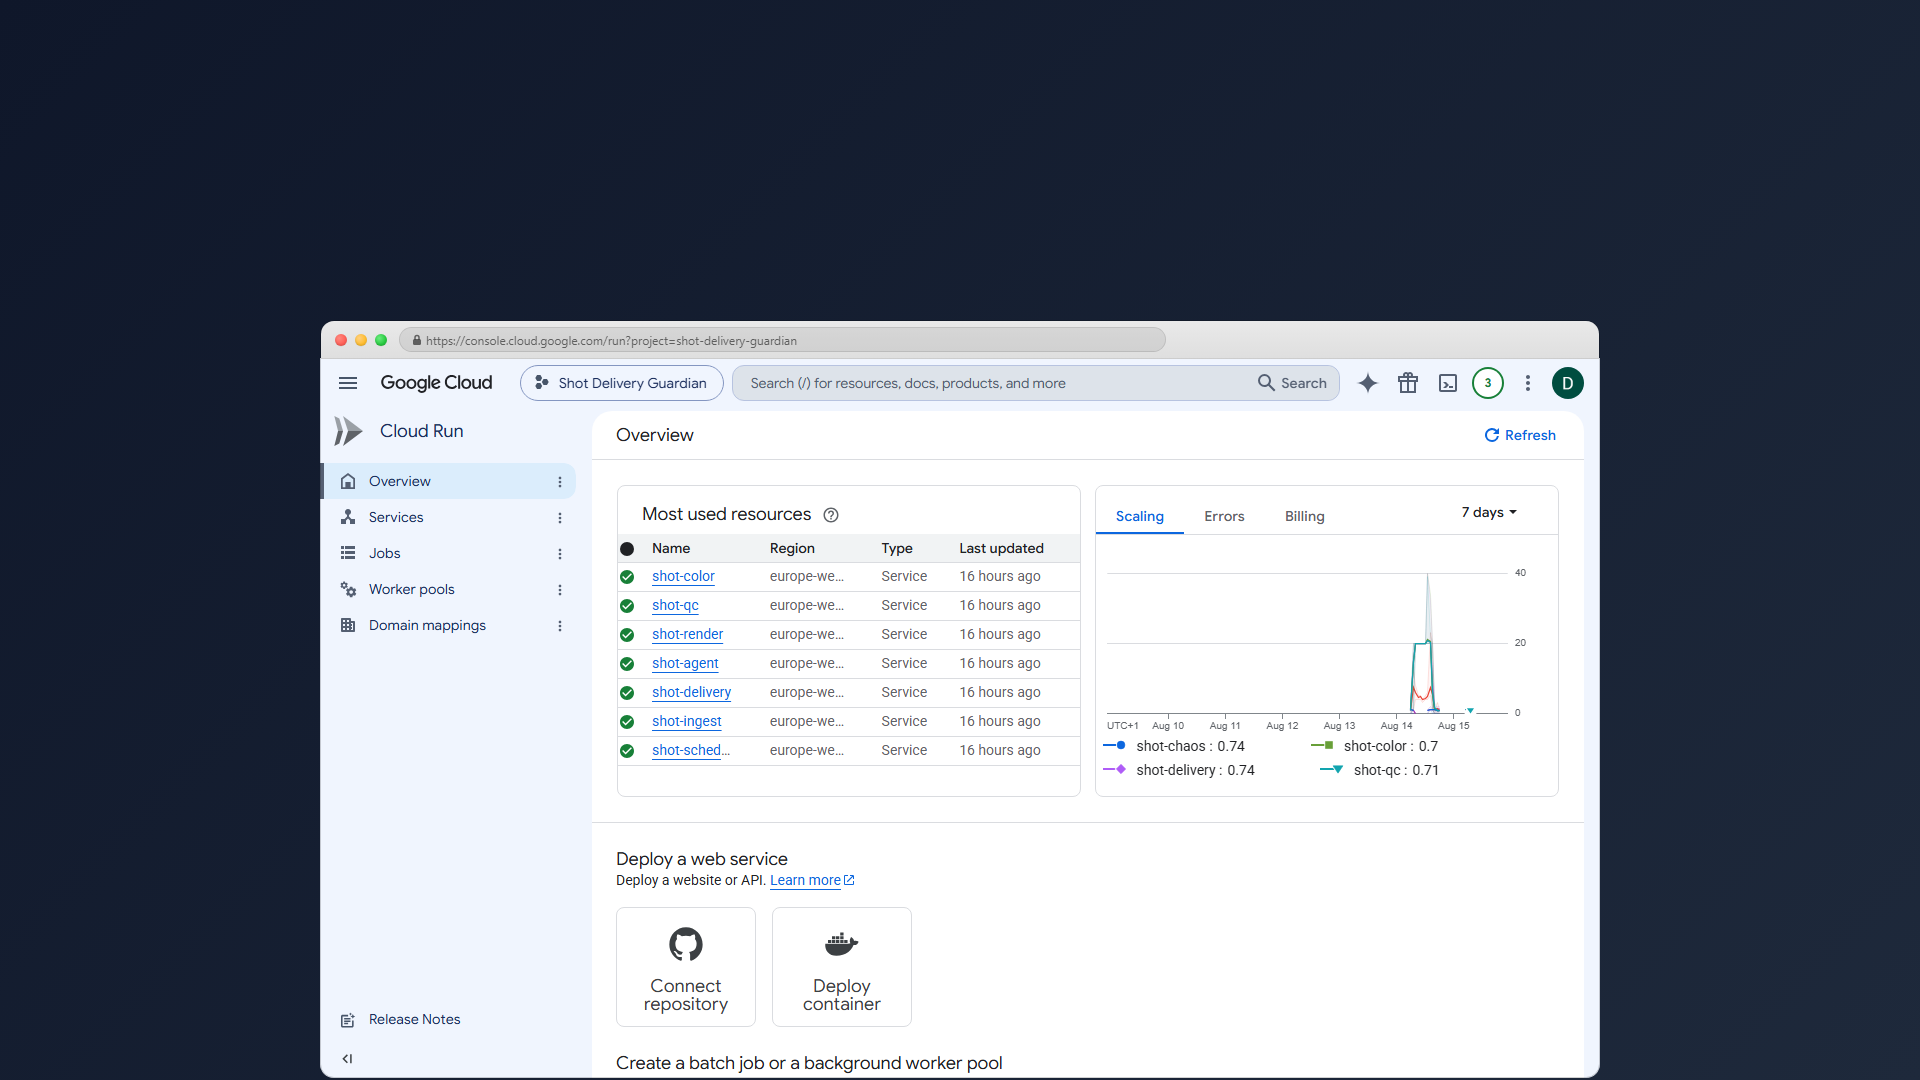
- Event-driven post-production microservices: 8 microservices deployed on Google Cloud Run modeling the episodic pipeline (
shot-scheduler,shot-ingest,shot-render,shot-color,shot-qc,shot-delivery,shot-chaos,shot-agent). - Telemetry engine: Custom OpenTelemetry instrumentation exports Prometheus metrics (
render_queue_depth,stage_completions_total), Loki high-cardinality JSON logs (episode_id,shot_id,depends_on,client_approved,deadline), and Tempo distributed traces over OTLP directly to Grafana Cloud. - Grafana MCP triage agent: Built with
google-adkand Google Gemini 2.5 to investigate post-production bottlenecks. It communicates with Grafana Cloud via themcp-grafanabinary over stdio. - Deterministic candidate scoring: Rather than relying on unconstrained LLM hallucination for mathematical prioritization, Gemini gathers live telemetry via MCP and invokes a deterministic scoring engine (
score_bump_candidates) that ranks eligible bump candidates based on:- Client approval: Locked shots are strictly protected.
- Dependency graph: Shots blocking downstream dependencies cannot be bumped.
- Director flags: High-priority director-flagged shots are protected.
- Slack calculation: Remaining slack hours relative to delivery deadlines.
Challenges we ran into
- Tooling compliance and workflow reset: Partway through development, the hackathon organizers clarified on their official forum that AI coding assistants, specifically naming Claude Code, were prohibited anywhere in the development workflow rather than just at runtime. Having started initial development in Claude Code, I immediately reset the repository to a clean baseline under Google's approved Antigravity CLI to ensure strict adherence to hackathon tooling guidelines and completed the project before the deadline.
- Missing metric and log telemetry export paths: Early on, our services only wired distributed traces to Grafana Cloud, leaving Prometheus metrics and Loki logs without an export path. We resolved this by re-architecting the instrumentation layer with OpenTelemetry's
OTLPMetricExporterandOTLPLogExporterover OTLP HTTP. - Grafana datasource UID mismatches: Dashboard panels and alert rules silently broke during automated provisioning because they referenced human-readable datasource display names instead of Grafana Cloud's immutable datasource UIDs.
- PromQL multi-series evaluation collisions: The initial alert query matched two concurrent time series because both ingest and render pipeline steps touched
stage="render". We updated the rule to aggregate across series withsum()so the threshold evaluator received a single unambiguous scalar value. - Cloud Run environment variable overwrites: Our automated deployment script repeatedly wiped
GOOGLE_GENAI_USE_VERTEXAIduring service updates because the gcloud--set-env-varsflag overwrites the complete environment map rather than patching individual keys. We permanently resolved this by parameterizing the full environment configuration inside our deployment scripts.
Accomplishments that we're proud of
- Verified end-to-end autonomous triage loop: The complete operational loop was independently tested against live infrastructure on GCP Cloud Run. When simulated backlog chaos triggers an alert, the webhook invokes
shot-agent, which queries Prometheus, Loki, and Tempo via Grafana MCP and writes a live root-cause annotation back to the Grafana dashboard. - Structural policy safety across live trials: In 5 live end-to-end trials across episodes
ep01-ep05(averaging 44.28s investigation latency with 60.0% optimal decision accuracy, 3/5), the system achieved 0 policy violations. In the 2 suboptimal trials, the runner stream returned before serializing final synthesis text, but delegating candidate selection strictly to the deterministic scoring function ensured policy constraints remained mathematically isolated from LLM variance, preventing any client-approved, director-flagged, or dependency-blocking shots from being deprioritized.
What we learned
- LLMs excel at synthesis, but operational dispatch requires deterministic guardrails: Language models are exceptionally good at navigating complex telemetry, correlating logs with traces, and explaining root causes. However, critical decisions like queue bumping cannot rely on probabilistic guesswork where hallucination risks breaking downstream dependencies. Pairing LLM reasoning with a deterministic scoring algorithm gave us the best of both worlds: cognitive flexibility with mathematical safety.
- Model Context Protocol enables in-dashboard operations: Traditional assistants demand conversational attention and manual copy-pasting. Integrating Gemini directly into Grafana via MCP demonstrated how agentic workflows operate best in production: autonomous background guardians designed for zero context switching, querying live systems when triggered and posting root-cause findings directly onto the team's existing dashboards.
- Observability hygiene is the foundation of agentic AI: An agent is only as competent as the telemetry it can query. Structuring logs with high-cardinality JSON attributes (such as shot IDs, dependency links, and deadlines) and adopting unified OTLP export standards made multi-signal triage possible in seconds.
What's next for Shot-Delivery Guardian
- Automated Pub/Sub throttle scaling: Allow the agent to dynamically adjust GCP Pub/Sub push rate limits or scale Cloud Run concurrency.
- Multi-studio federated dashboards: Extend the MCP integration to query cross-studio render farms and cloud GPU spot instances.

Log in or sign up for Devpost to join the conversation.