Inspiration
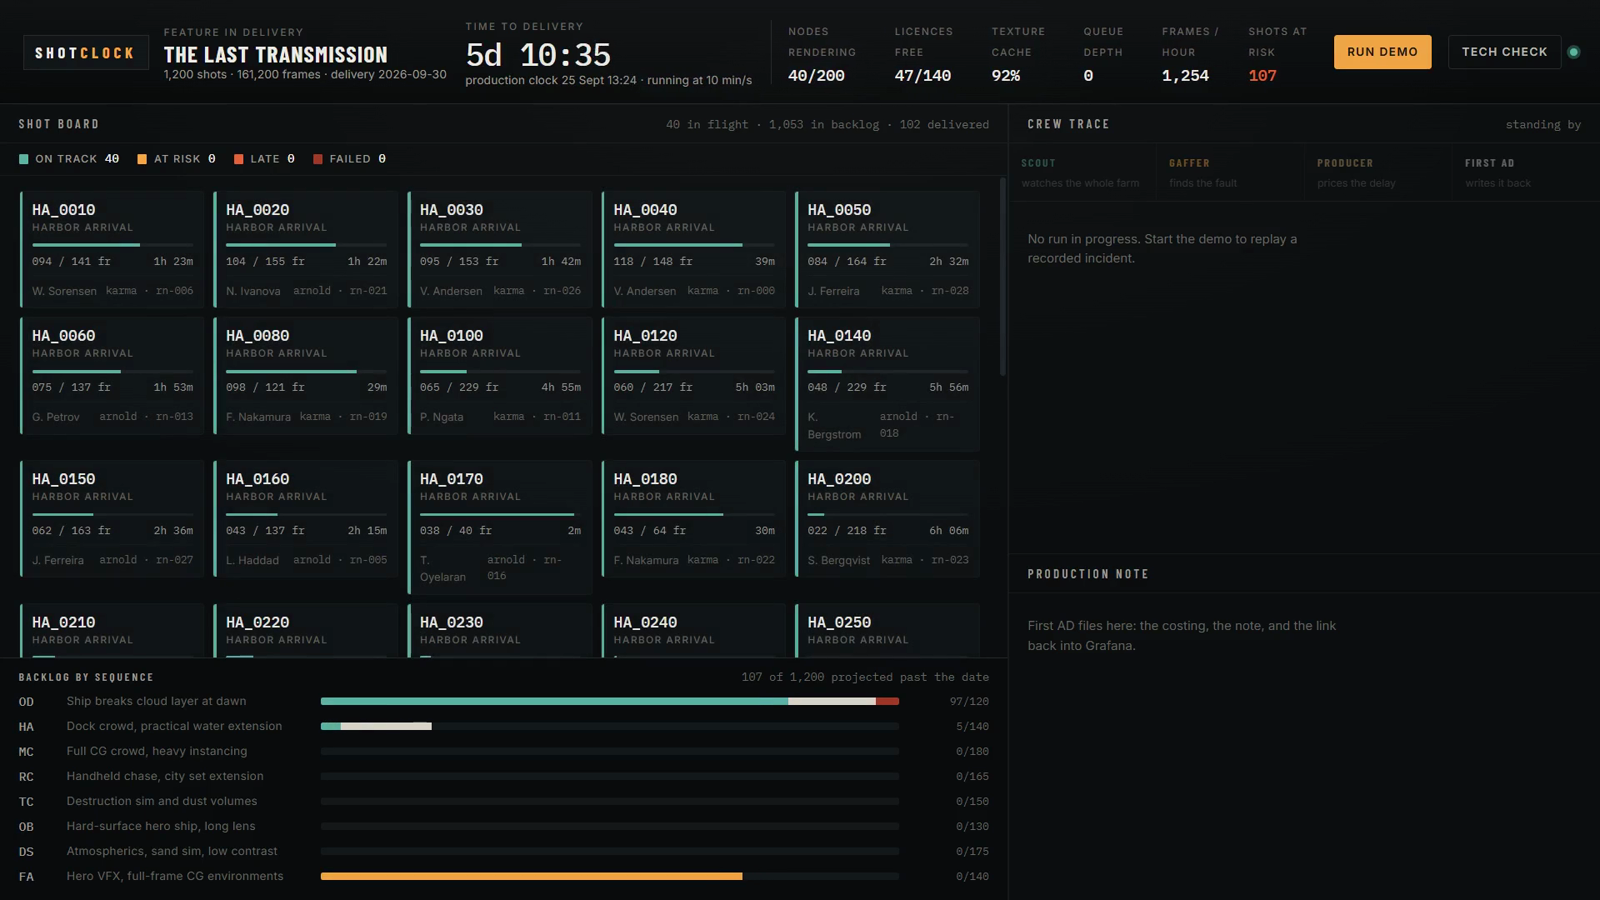
Render farms are one of the few places in filmmaking where metrics, logs and traces genuinely are the product. A studio sells a delivery date years in advance, then spends six weeks pushing 1,200 shots through a few hundred machines. Jobs die at 90%. Licence pools starve. A texture cache thrashes and every frame on the farm quietly takes twice as long.
Nobody finds out until the shots are late — because the information that would have told you is spread across a dashboard nobody is watching at 4am.
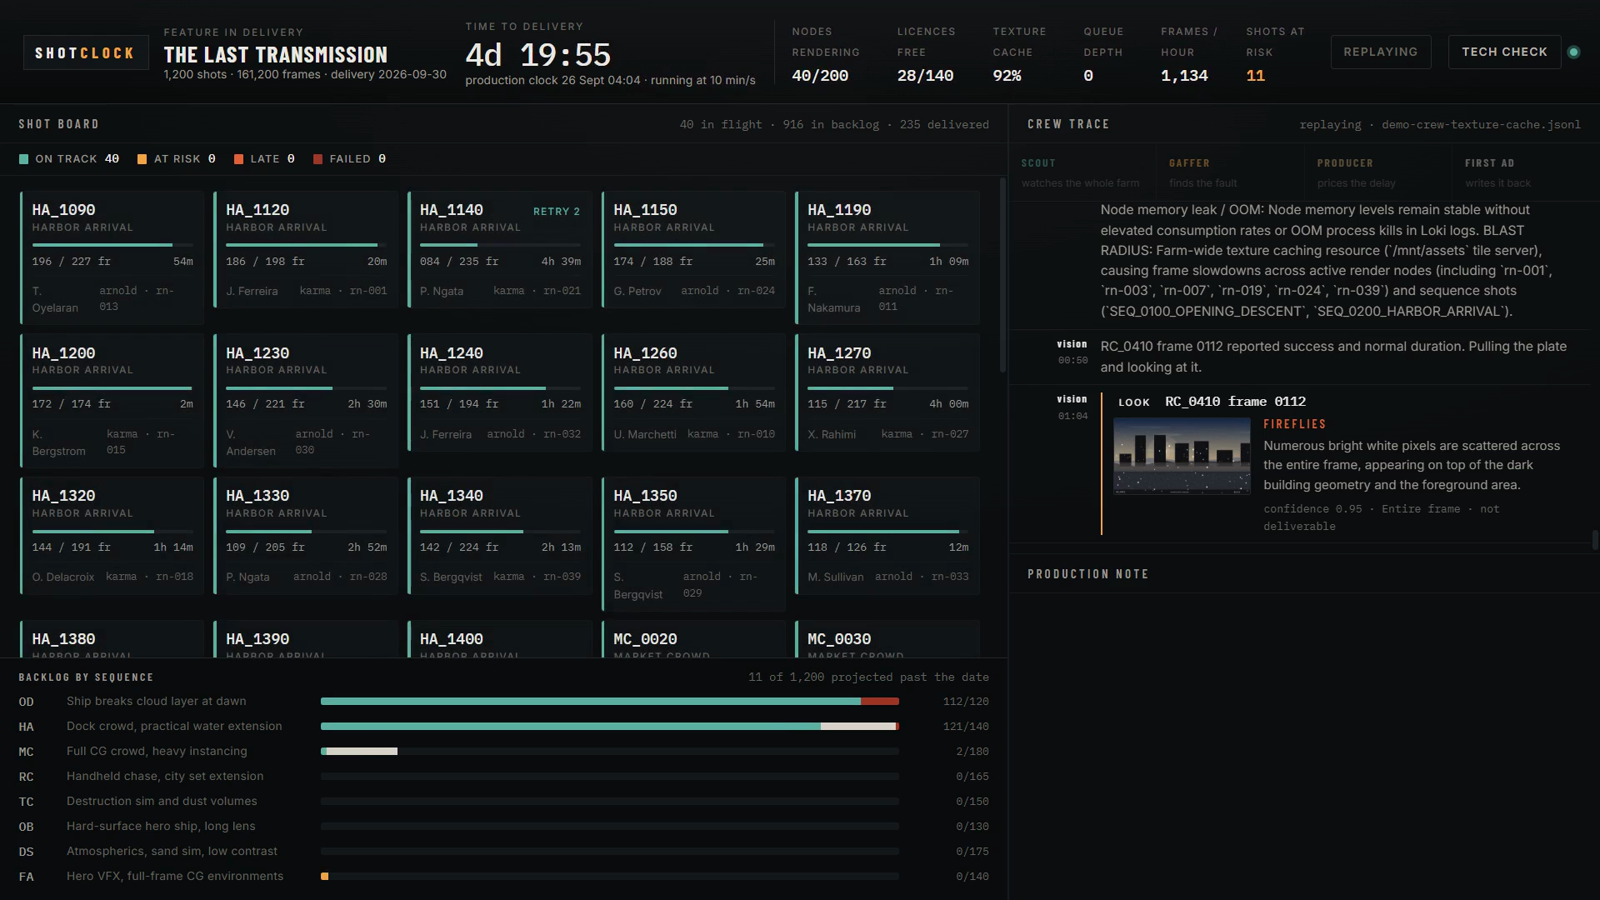
The other half of the idea came from a specific gap. Telemetry can tell you a render succeeded. It cannot tell you the plate came back black, or crawling with fireflies, or missing a texture map. Those are failures that exit 0, and every VFX house pays people to catch them by eye in dailies. That is not missing instrumentation. The renderer genuinely does not know the image is wrong. It is a job that needs eyes.
What it does
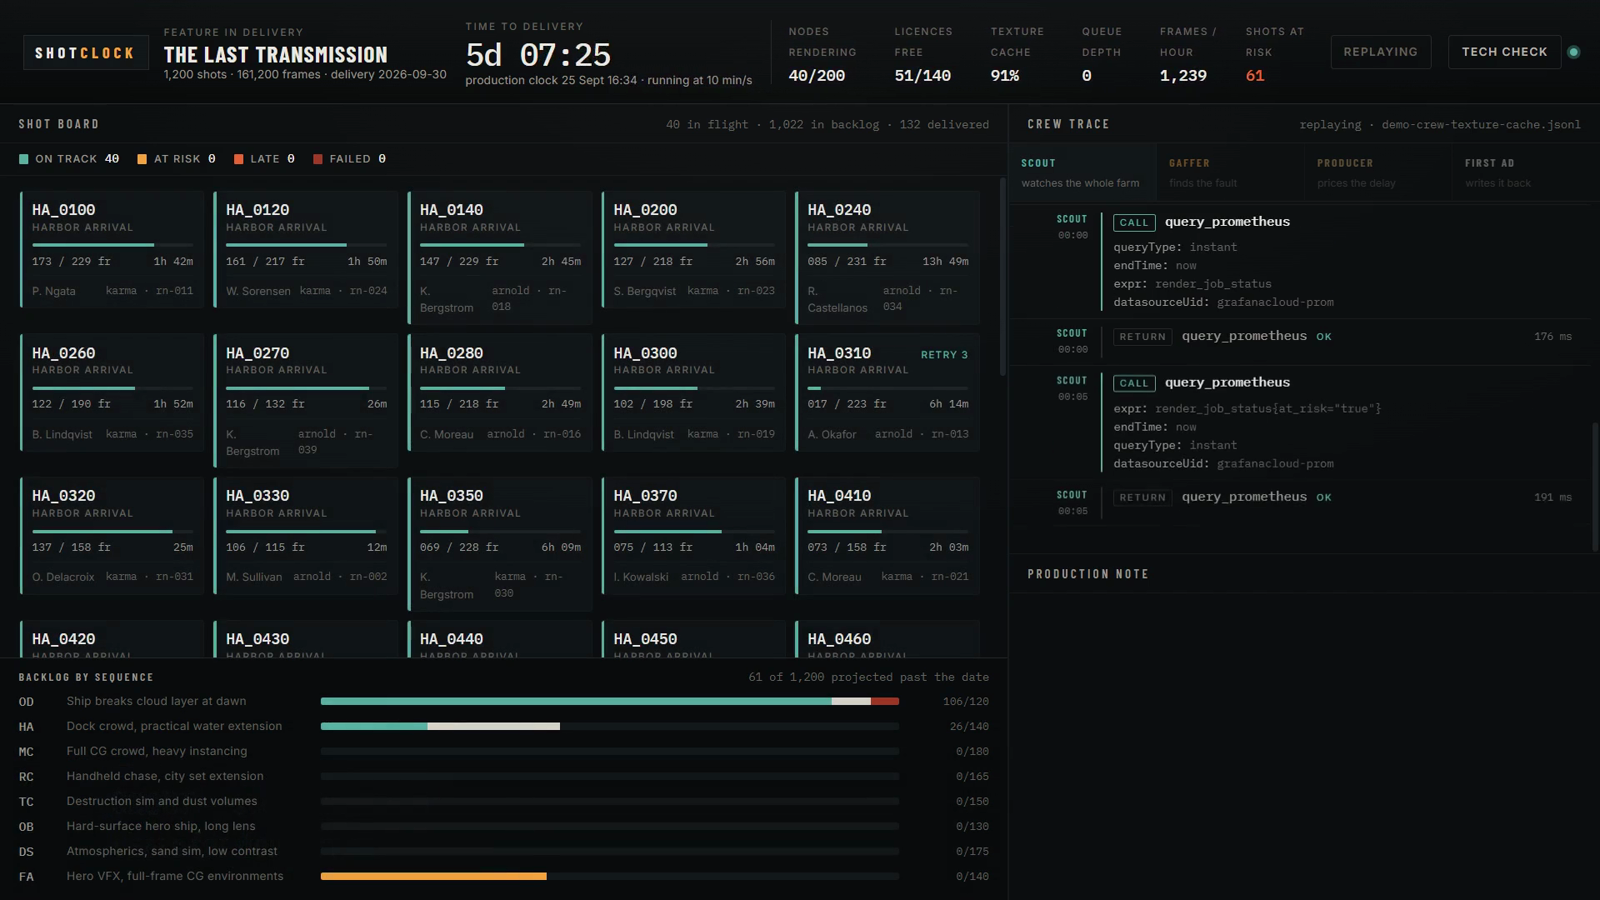
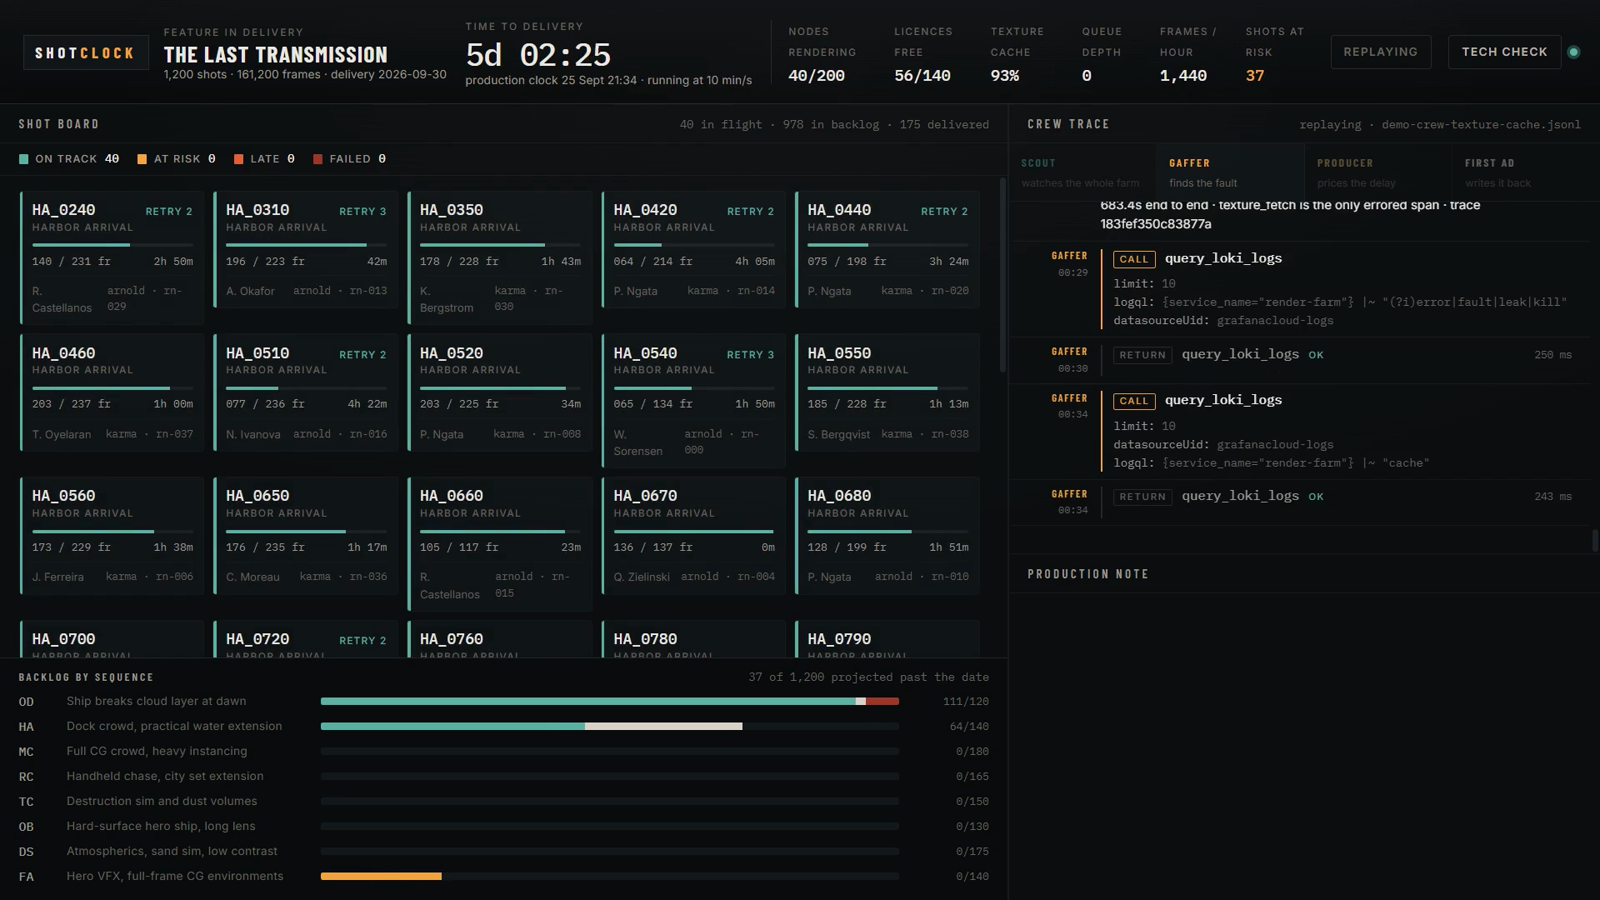
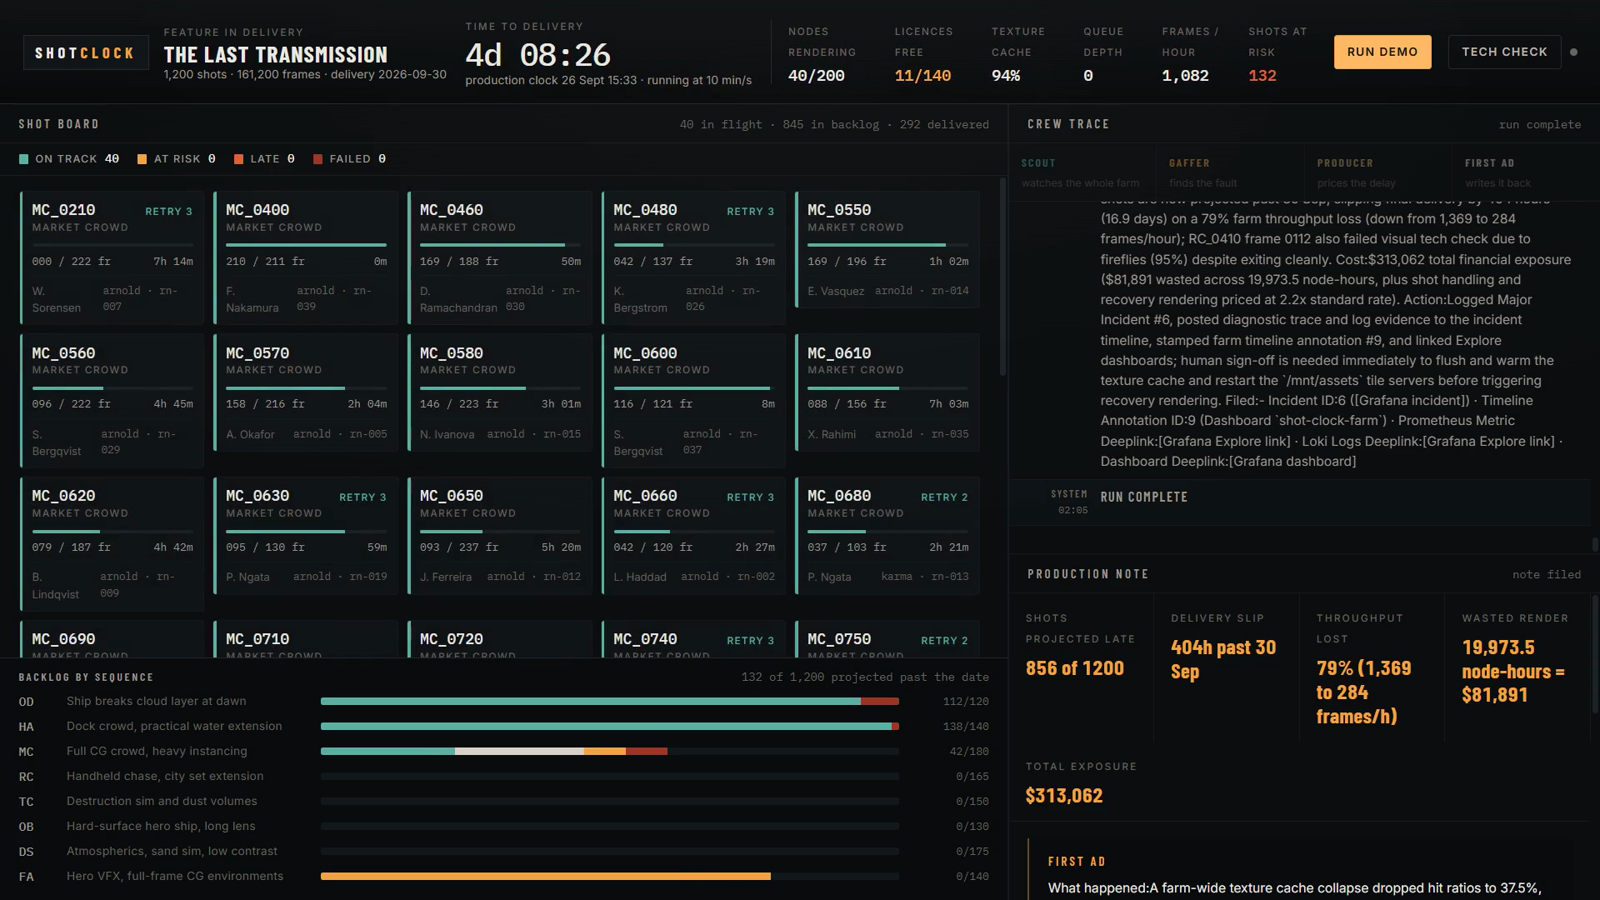
Four Gemini agents run in a fixed order over a simulated 200-node farm:
- Scout sweeps 1,200 shots and finds which are projected past the date.
- Gaffer proves the cause — metrics say which shot, logs say which node — and states what it ruled out.
- A tech check pulls the actual rendered frame and asks Gemini to look at it. It is never told which defect to expect, or that one exists.
- Producer turns the fault into a delivery slip and a dollar exposure.
- First AD stops reading and acts: opens a Grafana incident, adds the diagnosis to its timeline, stamps an annotation on the dashboard at the minute the fault began, and files the production note.
The artefacts outlive the run. Whoever opens that dashboard next morning finds the investigation already written down.
You can make it run
The hosted war room replays a real recorded run, which is what makes it instant and safe to leave on a public URL. But a replay can only show that agents did the work, so there is a Run the crew live button: press it and four Gemini agents investigate the farm right then, over MCP, streaming into the same console. Capped at six runs a day, one at a time, and hidden when no simulator is feeding Grafana — because a button that fails is worse than no button.
How we built it
google-adk agents on Gemini, wired to Grafana Cloud through Grafana's own mcp-grafana MCP server over stdio. A simulator exports real OTLP metrics, logs and traces — one trace per frame — into Grafana Cloud, so the agents query the same stack a human would. GOOGLE_GENAI_USE_VERTEXAI=TRUE moves the identical code onto Vertex AI, which is how the deployed build runs on Cloud Run.
Two rules shaped the design more than anything else:
No model computes a number. An early build let the agent read the metrics and pass them into the costing tool. It produced $172,515 and $283,720 for the same farm a minute apart. The maths is now Python that asserts its own components reconcile, and it reads its own telemetry — so the agent decides when to price the risk and has no say in what the numbers are.
Missing telemetry raises, never defaults. Defaulting one absent metric to zero once produced a 6,691-day slip and $132m of exposure from an idle farm. A number built on absent data is worse than an error, because it looks like an answer.
Challenges we ran into
The free tier's quota is per model, per day. Twenty requests, and one crew member is roughly one model's entire daily budget. So each role runs on its own model against its own quota, and stages checkpoint as they finish — a run that dies on a 429 resumes the next day instead of starting over.
Vertex AI and AI Studio expose disjoint model sets. Not a version skew — on the AI Studio project the 3.x line works and 2.5 is refused; on Vertex it is exactly reversed. A build tested only against AI Studio 404s for every visitor the moment it deploys.
client.models.list() advertises models the key cannot call. The only availability check that means anything is a real request.
The trace pillar was ingested and never read. The MCP server's only route to Tempo runs a Sift investigation, which on our stack returns an internal error — so a three-signal claim was resting on two signals. Traces now go through the Grafana datasource proxy instead. Fixing it surfaced a second bug: the simulator boosted the texture_fetch span on a cold cache without compressing the other stages, so child spans outlasted the parent they sat inside — impossible in a real trace, and obvious in a Tempo waterfall.
The costing was measuring the wrong clock. The farm runs in production time, anchored six days before the delivery date. The costing measured that same deadline against the wall clock, which on a day months from the fictional date hands back hundreds of hours that do not exist — enough that a farm crippled to a third of its throughput still "delivered early" at zero exposure. There was already a note in the code that the farm's own at-risk gauge disagreed with the model. That disagreement was this bug, and the gauge had been right all along.
Accomplishments that we're proud of
The tech check returning clean when the plate is clean. It is not told a defect exists, so it has to be capable of saying nothing is wrong — and on a good frame it reads the film grain as "an artistic choice rather than a render defect." A detector that only ever detects is not a detector.
And the write-back. Most observability agents read. This one leaves the investigation behind in the tool the team already opens.
What we learned
That the interesting failures in an agent system are almost never the model. They were quota shapes, two products exposing different models under one SDK, a listing endpoint that lies, and two different clocks being compared as though they were one. The agents were the easy part.
What's next for Shot Clock
Real render farm adapters — Deadline and Tractor both expose job state that maps onto the same shapes. And the tech check generalises past fireflies: the same step could run every frame that exits 0, which is the check no studio can afford to do by hand.
Built With
- cloud-run
- fastapi
- gemini
- google-adk
- google-cloud
- grafana
- loki
- mcp
- opentelemetry
- prometheus
- python
- tempo
- vertex-ai

Log in or sign up for Devpost to join the conversation.