Inspiration
The headline inflation rate is built on an average basket. A household that drives a lot, or rents instead of owning, can live through a very different year than that average. I wanted a small page that keeps every price official and lets the weights come from you.
What it does
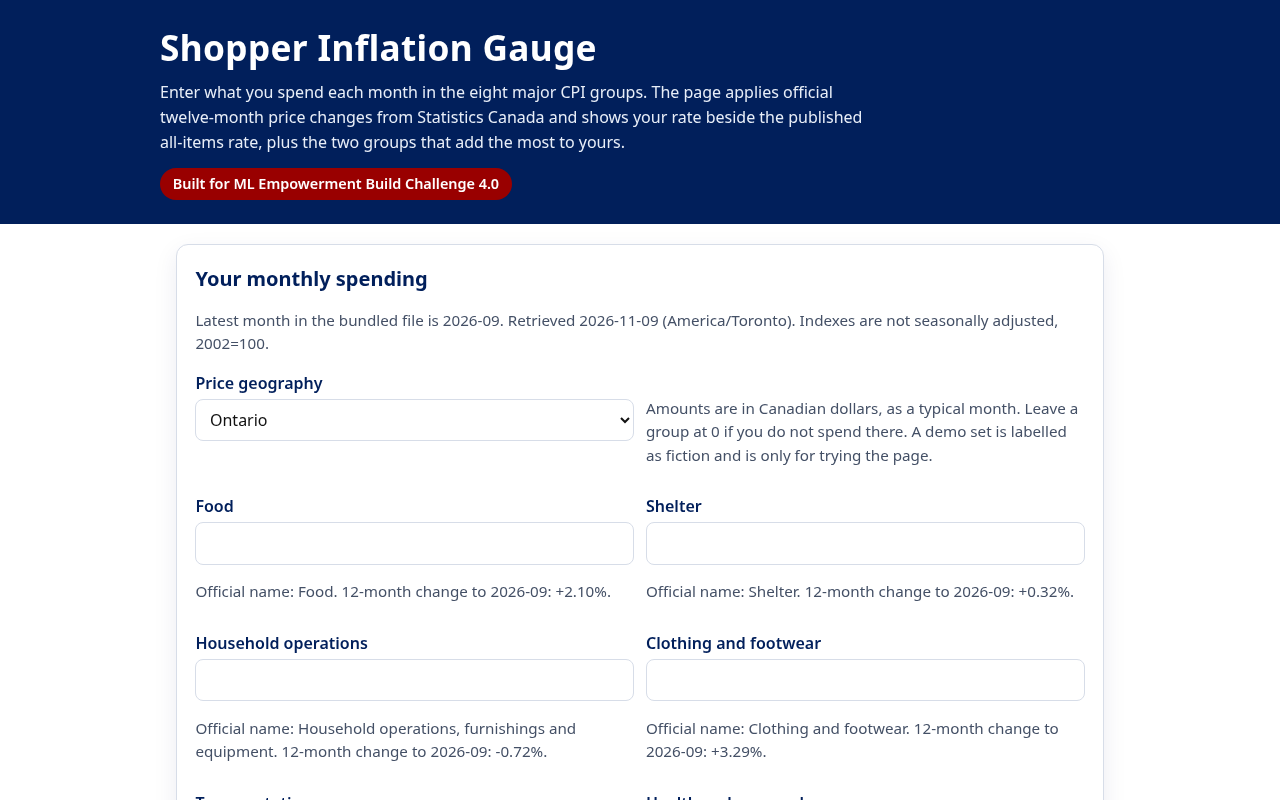
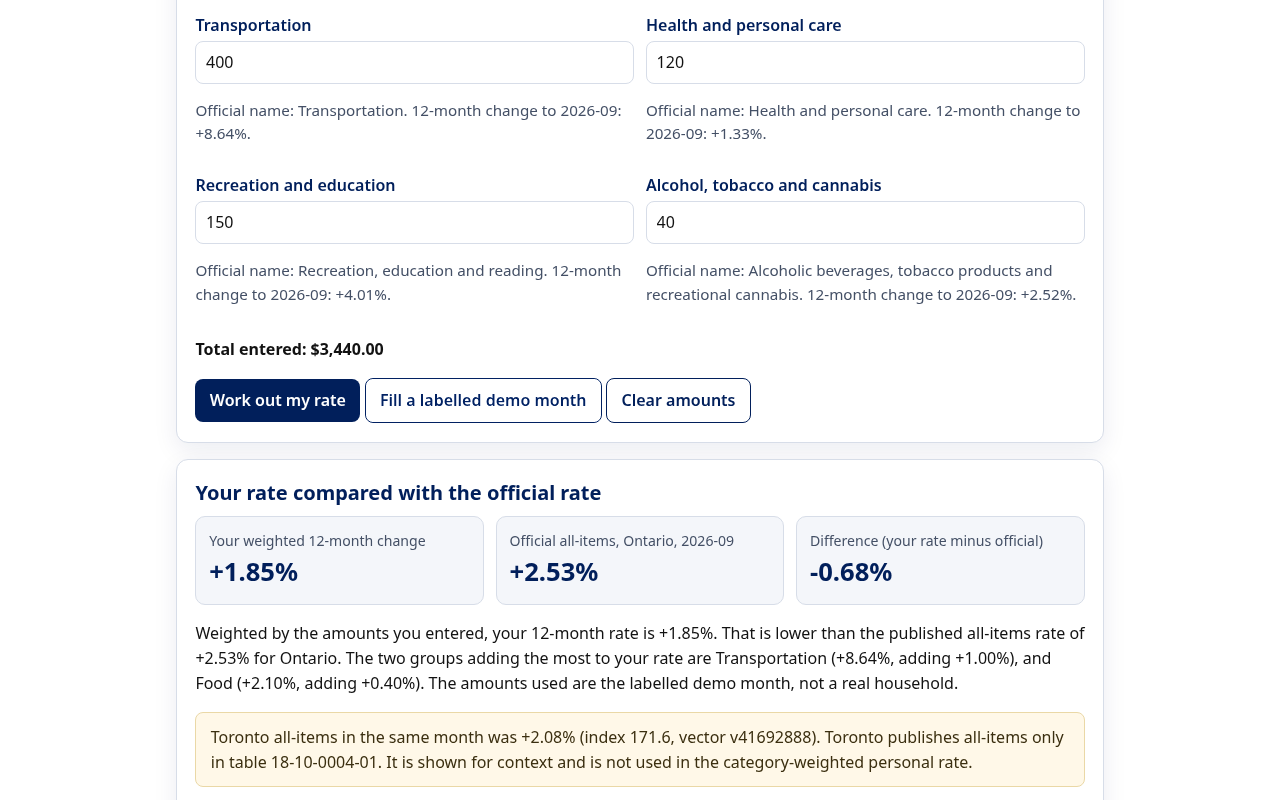
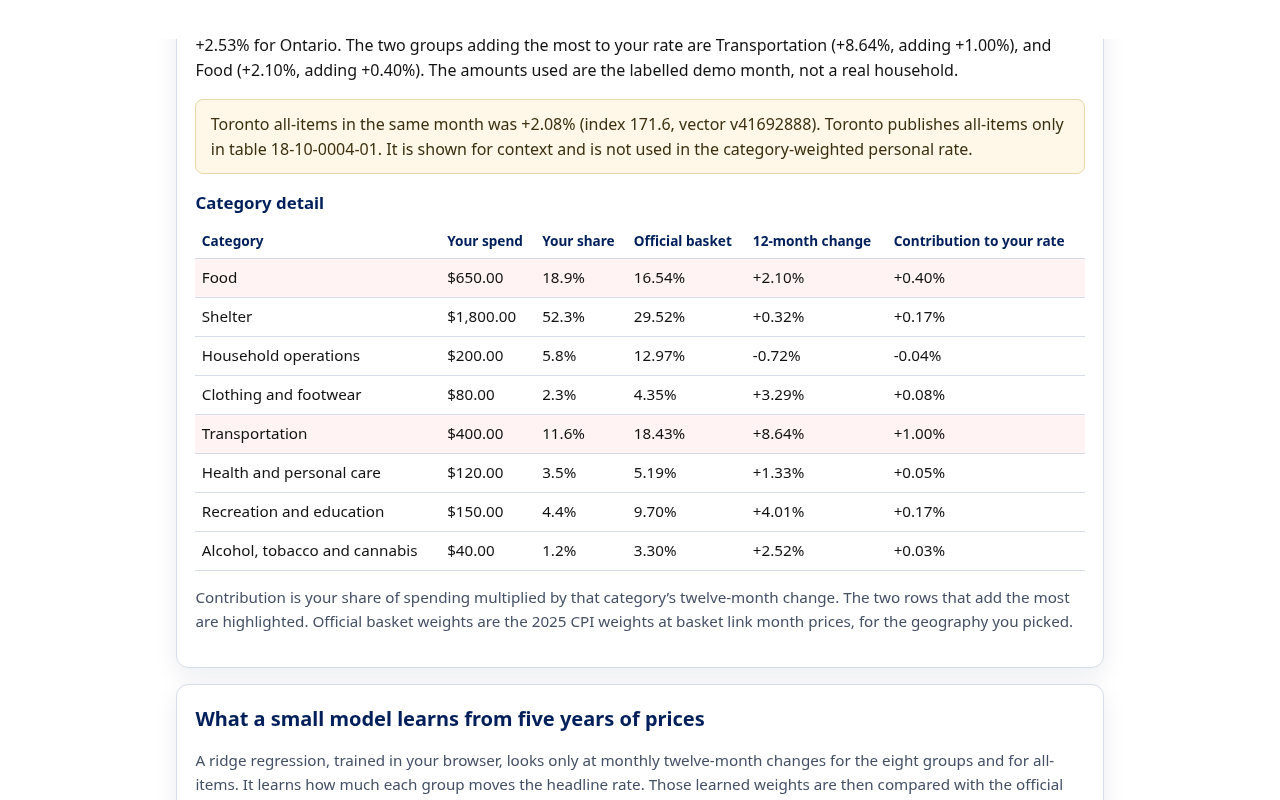
Shopper Inflation Gauge asks for a typical month of spending in the eight major CPI groups, such as food, shelter and transportation. It applies the official twelve-month price change for each group in Ontario or Canada, builds a personal rate weighted by your spending, and sets it beside the published all-items rate. It highlights the two groups that add the most to your number and shows the official 2025 basket weights, so you can see exactly where your month differs from the average. Toronto's all-items rate is shown for context only, because the city series does not have the eight-group split. A demo month is clearly labelled as made up.
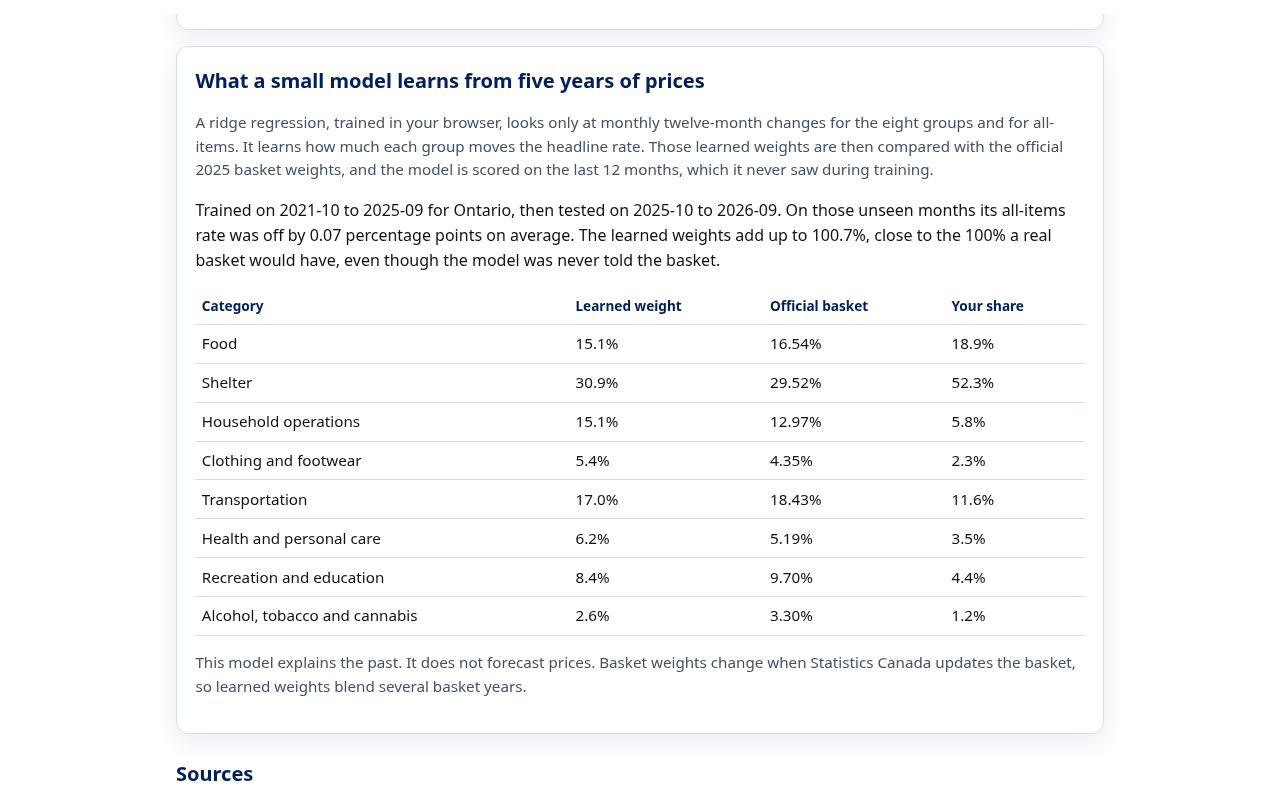
A second panel trains a small machine learning model right in the browser. A ridge regression looks only at five years of monthly price changes for the eight groups and for all-items, and learns how much each group moves the headline rate. It is never told the official basket. On the last 12 months, which it never saw in training, its Ontario all-items rate was off by 0.07 percentage points on average (0.05 for Canada), and its learned weights land close to the official basket: about 31% for shelter against an official 29.5%, and 17% for transportation against 18.4%. Your own spending shares sit in the same table, so you can see how far your month is from both.
How I built it
Plain HTML, CSS and JavaScript with no build step, hosted on GitHub Pages. The index values and basket weights live in one JSON file, taken from Statistics Canada tables 18-10-0004-01 (Consumer Price Index, monthly, not seasonally adjusted) and 18-10-0007-01 (basket weights). The latest month is September 2026. On 13 November 2026 I checked every bundled index and weight against the Statistics Canada Web Data Service, vector by vector, and all of them matched. Node tests lock those figures, recompute each twelve-month change from the raw indexes, and check that the weights add up to 100. The model is a ridge regression with no intercept, solved with the normal equations and Gaussian elimination in about 100 lines of JavaScript with no libraries. It trains on October 2021 to September 2025 and is scored on October 2025 to September 2026. Tests check the solver on known systems, confirm the model recovers exact weights on synthetic data, and fail if the holdout error rises above 0.2 points. A GitHub Actions workflow runs the tests before each deploy.
Challenges I ran into
Keeping the city and provincial series straight, so a Toronto food index that does not exist in the table was never invented. Explaining why a personal rate can sit far from the official rate even when every price is official: the weights are yours. Rounding twelve-month changes so they still match the source indexes. For the model, the eight groups move together a lot, so plain least squares gave unstable weights; a small ridge penalty fixed that, and I chose it by checking the error on held out months rather than on the training data.
Accomplishments that I'm proud of
A working gauge on real public data, with a clear gap between your rate and the official one. In September 2026, Ontario transportation prices were up 8.64% over the year while shelter was up only 0.32%, so a household that spends more on driving than the average basket sees a noticeably higher personal rate. A model that recovers the shape of the official basket from prices alone, which shows the gauge is weighting groups in a way that matches how the headline rate actually behaves. Tests fail if any bundled figure drifts from the source.
What I learned
People do not need a new price survey to understand why their month felt different. They need the official category changes and an honest place to type their own spending. I also learned how CPI basket weights are set at basket link month prices, and why that matters when you compare a personal basket to the official one.
Problem statement
The single headline inflation rate hides how differently prices are moving across spending groups, so many households cannot tell why their own costs feel higher or lower than the news.
Solution overview
Keep every price official, let the weights come from the household, and show both the personal rate and a model that explains how the headline rate is built.
Key features
Personal weighted inflation rate for Ontario or Canada. Side by side comparison with the official all-items rate. The two groups adding most to your rate. A ridge regression trained in the browser that learns group weights and is scored on unseen months. Sources and vector ids shown for every figure.
Technologies used
HTML, CSS and JavaScript, a ridge regression written from scratch, Python for the data download, the Statistics Canada Web Data Service, Node.js tests, GitHub Pages and GitHub Actions.
Target users
Households in Ontario and across Canada who budget closely, students learning how a price index works, and anyone who wants to check the headline number against their own spending.
Social impact
Households budgeting on a fixed income can see which part of their spending is driving their costs, using only public data and with nothing leaving their browser.
What's next
A chart of the official all-items line next to a recalculated personal line, from the same table. Optional saving of amounts in the browser only. An update each month when Statistics Canada publishes new figures.
Built With
- css
- github
- github-actions
- html
- javascript
- machine-learning
- node.js
- python
- ridge-regression
- statistics-canada