
Inspiration
One of us worked on a factory floor on a day/night rotation. When a defect showed up, everyone had an opinion about the cause — and no one had time to open the 45 sensor columns that might actually hold the answer. We wanted the question "why did this fail?" to be something you could just ask out loud.
What it does
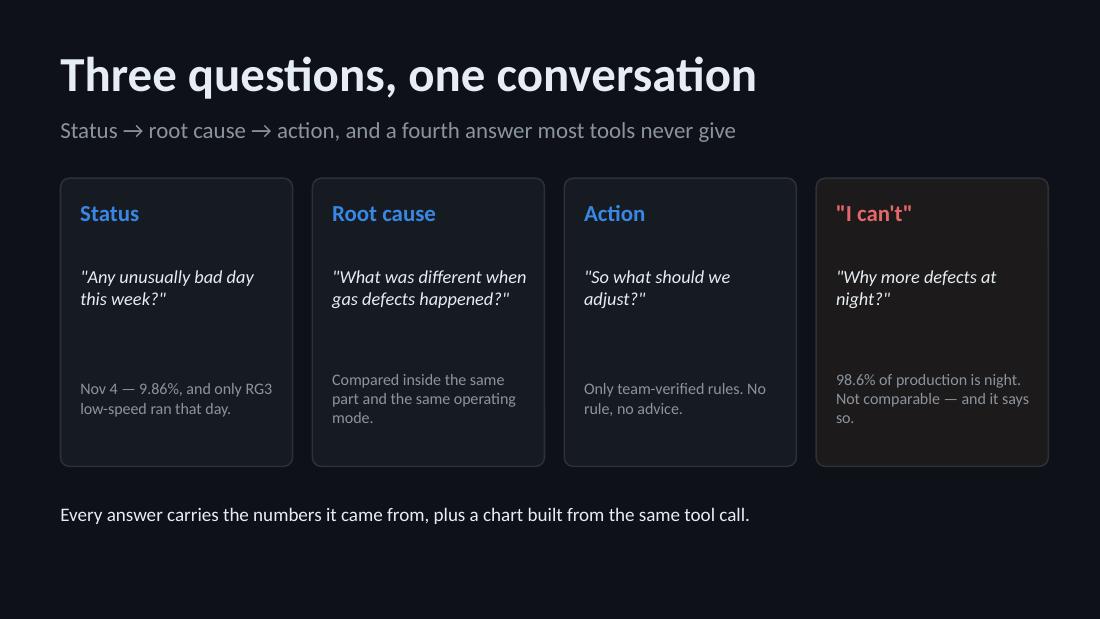
ShopFloor Copilot lets anyone ask about injection-molding production data in plain Korean or English, and answers with numbers computed from the real data, together with the chart the numbers came from.
The point is not that it finds differences. Any tool can do that. The point is that it removes the differences that only look real:
- Same part. Our first version confidently blamed injection speed: 101 for defects vs 67 for normal parts. It was wrong — each part simply runs at its own speed. Inside a single part, the difference vanished.
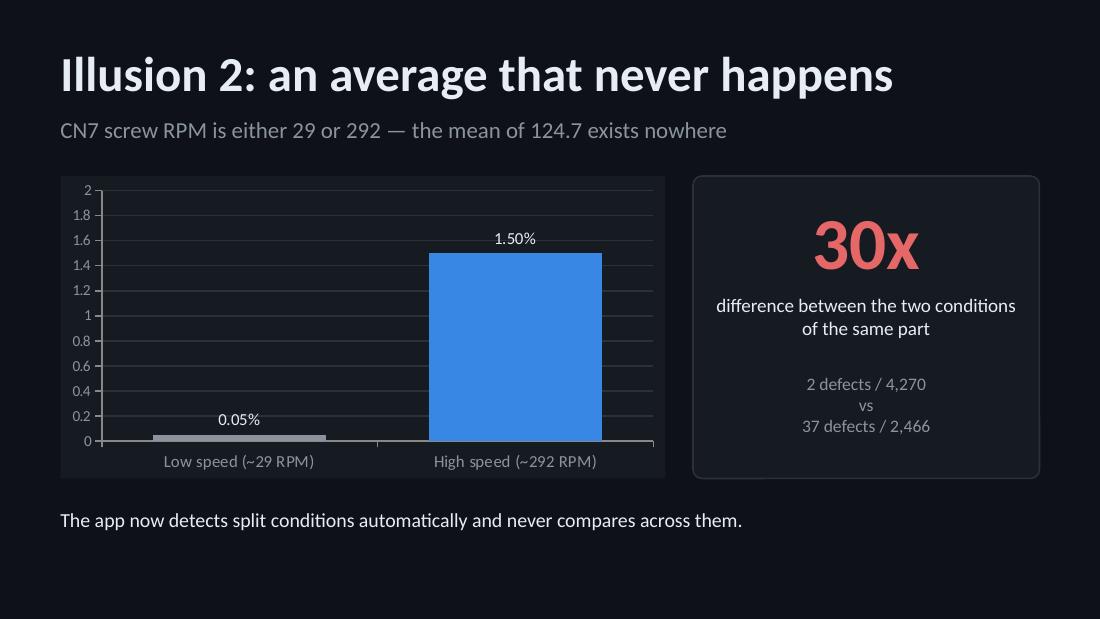
- Same operating mode. CN7 runs at either 29 or 292 RPM. Its average, 124.7, is a number that never actually happens on the floor.
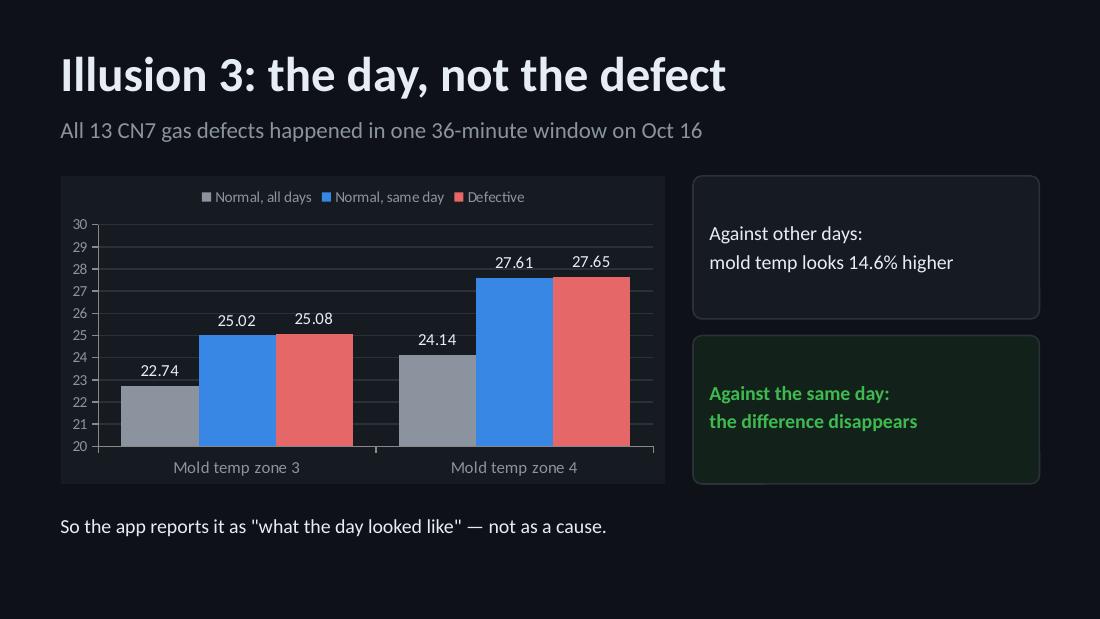
- Same day. All 13 gas defects hit inside a 36-minute window on Oct 16. That day, the good parts had the same mold temperature as the bad ones. So the app reports it as the day's condition, not as a cause.
It also refuses. 98.6% of our dataset is night production, so when you ask "why more defects at night?", it says day and night cannot be compared here — and shows the 1.4% figure behind that refusal instead of inventing a story.
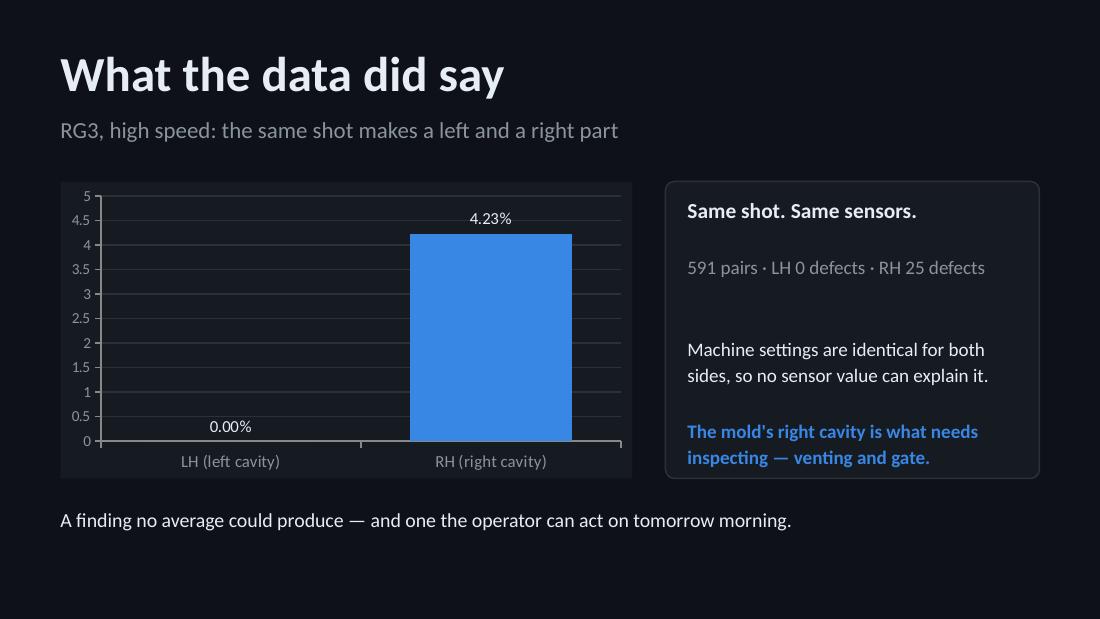
One finding survived all three filters: on RG3 at high speed, 591 shots were molded with both cavities under identical sensor readings, and the right cavity produced 25 defects while the left produced zero. That is a mold problem, not a process setting — and it is the kind of answer worth acting on.
How we built it
- Streamlit for the UI, deployed on Streamlit Community Cloud
- Claude Haiku with tool use: the model reads the question and chooses one of 10 analysis tools. Every number in the answer is computed in Python by pandas — the model only decides what to compute and how to say it. It never generates a figure itself.
- pandas + a two-proportion z-test for the statistics
- Plotly charts, generated from the same tool result the text was written from, so the chart and the sentence can never disagree
- Data: the public KAMP injection-molding dataset — 7,996 shots, 71 defects
- Korean and English throughout, including a synthetic sample CSV users can download in the app to try the upload feature
Challenges we ran into
All three of us are beginners in AI and Python, so the hardest part was not the code — it was learning that a confident wrong answer is worse than no answer.
Our English mode silently broke: asking about "gas" defects returned nothing, because the tools only knew the Korean label, and the model covered the gap by inventing an explanation about the data not being linked. We fixed it by normalizing every term before it reaches a tool, and by forbidding the model from claiming a value is unmeasured without checking first.
We also learned that mixing defect reasons hides real signals: gas defects ran hot on mold temperature while startup scrap ran cold, and averaged together they cancelled out into "no relationship". Splitting by reason brought the signal back.
And we found 2,764 duplicate rows in the source data, which we documented rather than quietly dropped.
What we learned
Confounding is not a statistics-class abstraction — it is the default state of factory data. Parts, operating modes, and production days are all tangled together, and almost every difference you find is one of them in disguise.
The most valuable thing an analysis tool can do is know the difference between "this is the cause" and "this happened to be true that day."
What's next
- Automatic column mapping so any plant's CSV works, not just the KAMP format
- Alerts when a defect rate crosses a threshold, instead of waiting to be asked
- Feeding the surviving findings back as verified action rules, so the tool gets better at the specific plant it runs in
Built With
- anthropic
- claude-haiku
- plotly
- streamlit-cloud


Log in or sign up for Devpost to join the conversation.