-
-

concept
-
intro
-
architecture
-
architecture
-
inspection
Inspiration
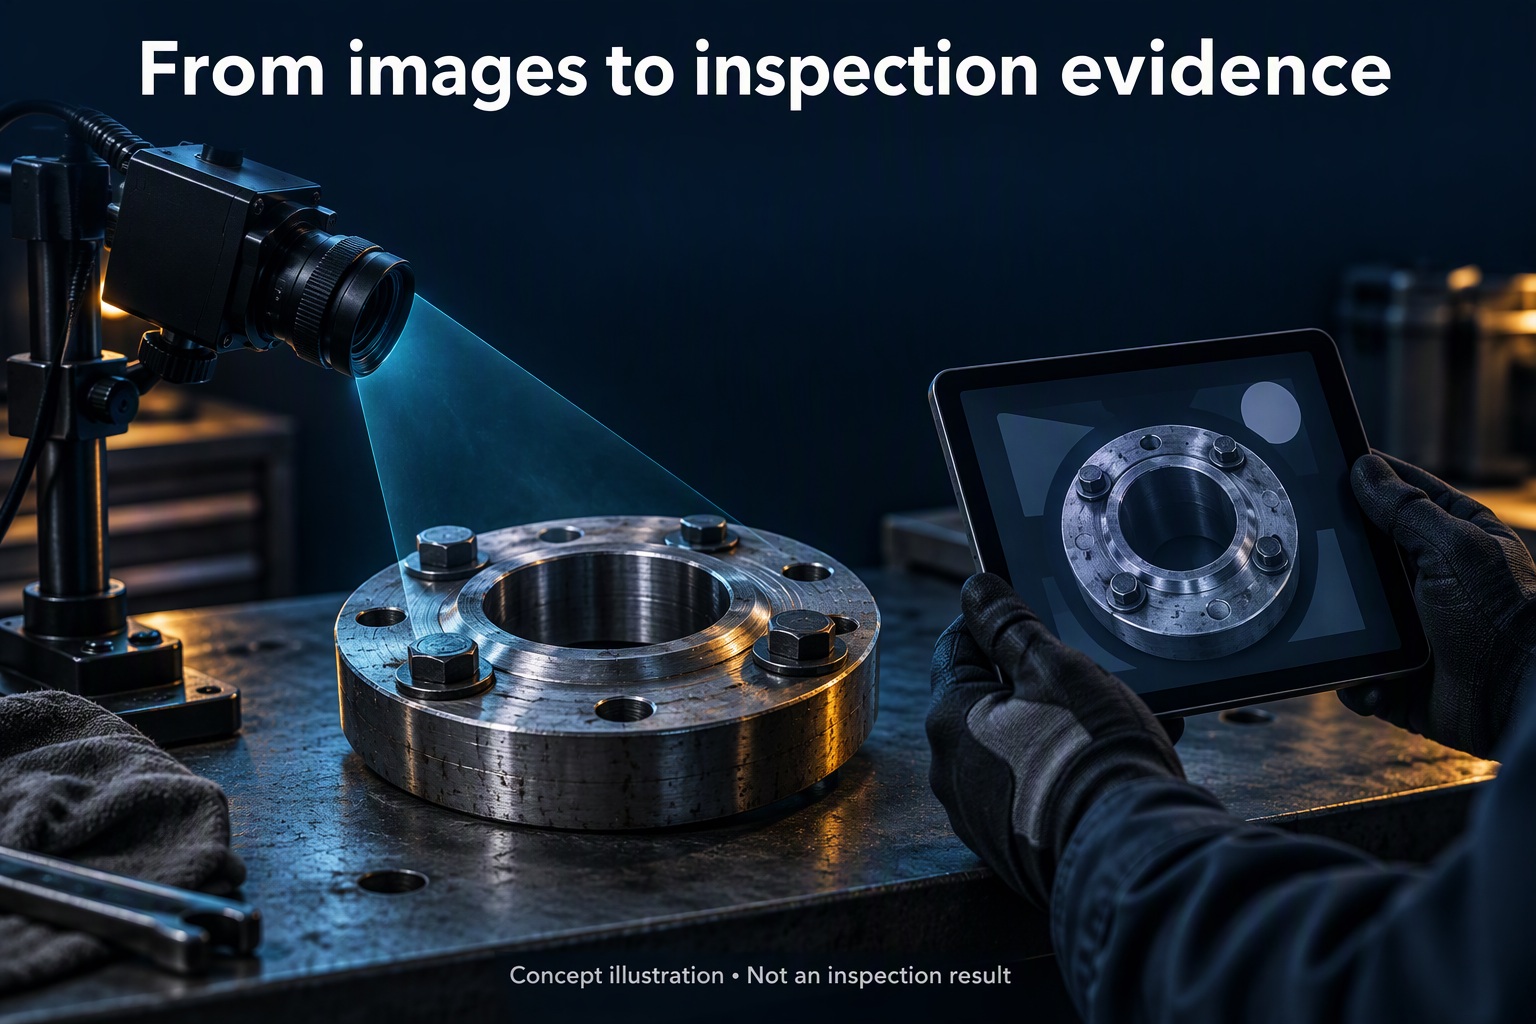
Industrial inspections still depend heavily on something surprisingly simple: a person walking around a facility, examining equipment, and recording what they see.
That approach works, but it has a fundamental limitation. How can someone confidently tell whether a machine has changed since its last inspection? The lighting might be different. The camera angle might have shifted. A shadow could look like damage, or a real defect might be hidden by glare.
We realized that the biggest challenge wasn't simply detecting rust, cracks, or surface damage. It was identifying meaningful changes over time without confusing environmental differences for actual defects.
That led us to a bigger question: What if a computer vision system could recognize when it doesn't have enough evidence?
Instead of producing a confident-looking answer from a blurry image, it could stop, explain the problem, and ask for another photograph. Instead of simply highlighting an anomaly, it could investigate further, preserve the evidence, and involve a human before creating a maintenance action.
That idea became Inspectra AI, an autonomous visual inspection platform built around one principle:
If the system cannot justify a result with actual measurements, it should not present that result as fact.
We wanted to build something beyond a computer vision demo with bounding boxes. We wanted a system that could observe, evaluate, decide what to do next, and leave behind a complete record of how it reached its conclusion.
What it does
Inspectra AI helps users inspect industrial equipment, compare its current appearance with previous reference images, identify visual changes, and turn supported findings into actionable maintenance records.
The workflow begins by registering equipment and uploading a reference photograph. During a later inspection, the user uploads a new image or video. Inspectra AI processes the visual evidence using OpenCV 5, evaluates its quality, attempts to align it with the reference, and identifies regions that may have changed.
But the most important part is what happens when the evidence is unreliable.
If an image is too blurry, the system pauses and requests a better capture. If alignment is weak, it can attempt additional processing and request a more suitable viewpoint. If the evidence supports a finding, the system records the observation and can create a maintenance ticket through its human-in-the-loop workflow.
Core capabilities
Visual quality assessment
Before analyzing potential defects, Inspectra AI measures image quality using actual computer vision operations, including Laplacian-based blur detection, exposure analysis, glare estimation, and image coverage.
Poor-quality evidence is not silently accepted.
Reference image registration
The system uses ORB feature detection, feature matching, RANSAC-based homography estimation, and perspective transformation to align inspection images with their references.
Alignment is evaluated using measurable indicators such as inlier ratio and reprojection error. A validity mask prevents empty regions introduced by image warping from being incorrectly classified as changes.
Visual change detection
Once images are aligned, Inspectra AI uses pixel differences, thresholding, morphological operations, contour extraction, and structural similarity (SSIM) to identify candidate changes.
The system distinguishes observed visual changes from confirmed equipment defects.
Agentic investigation
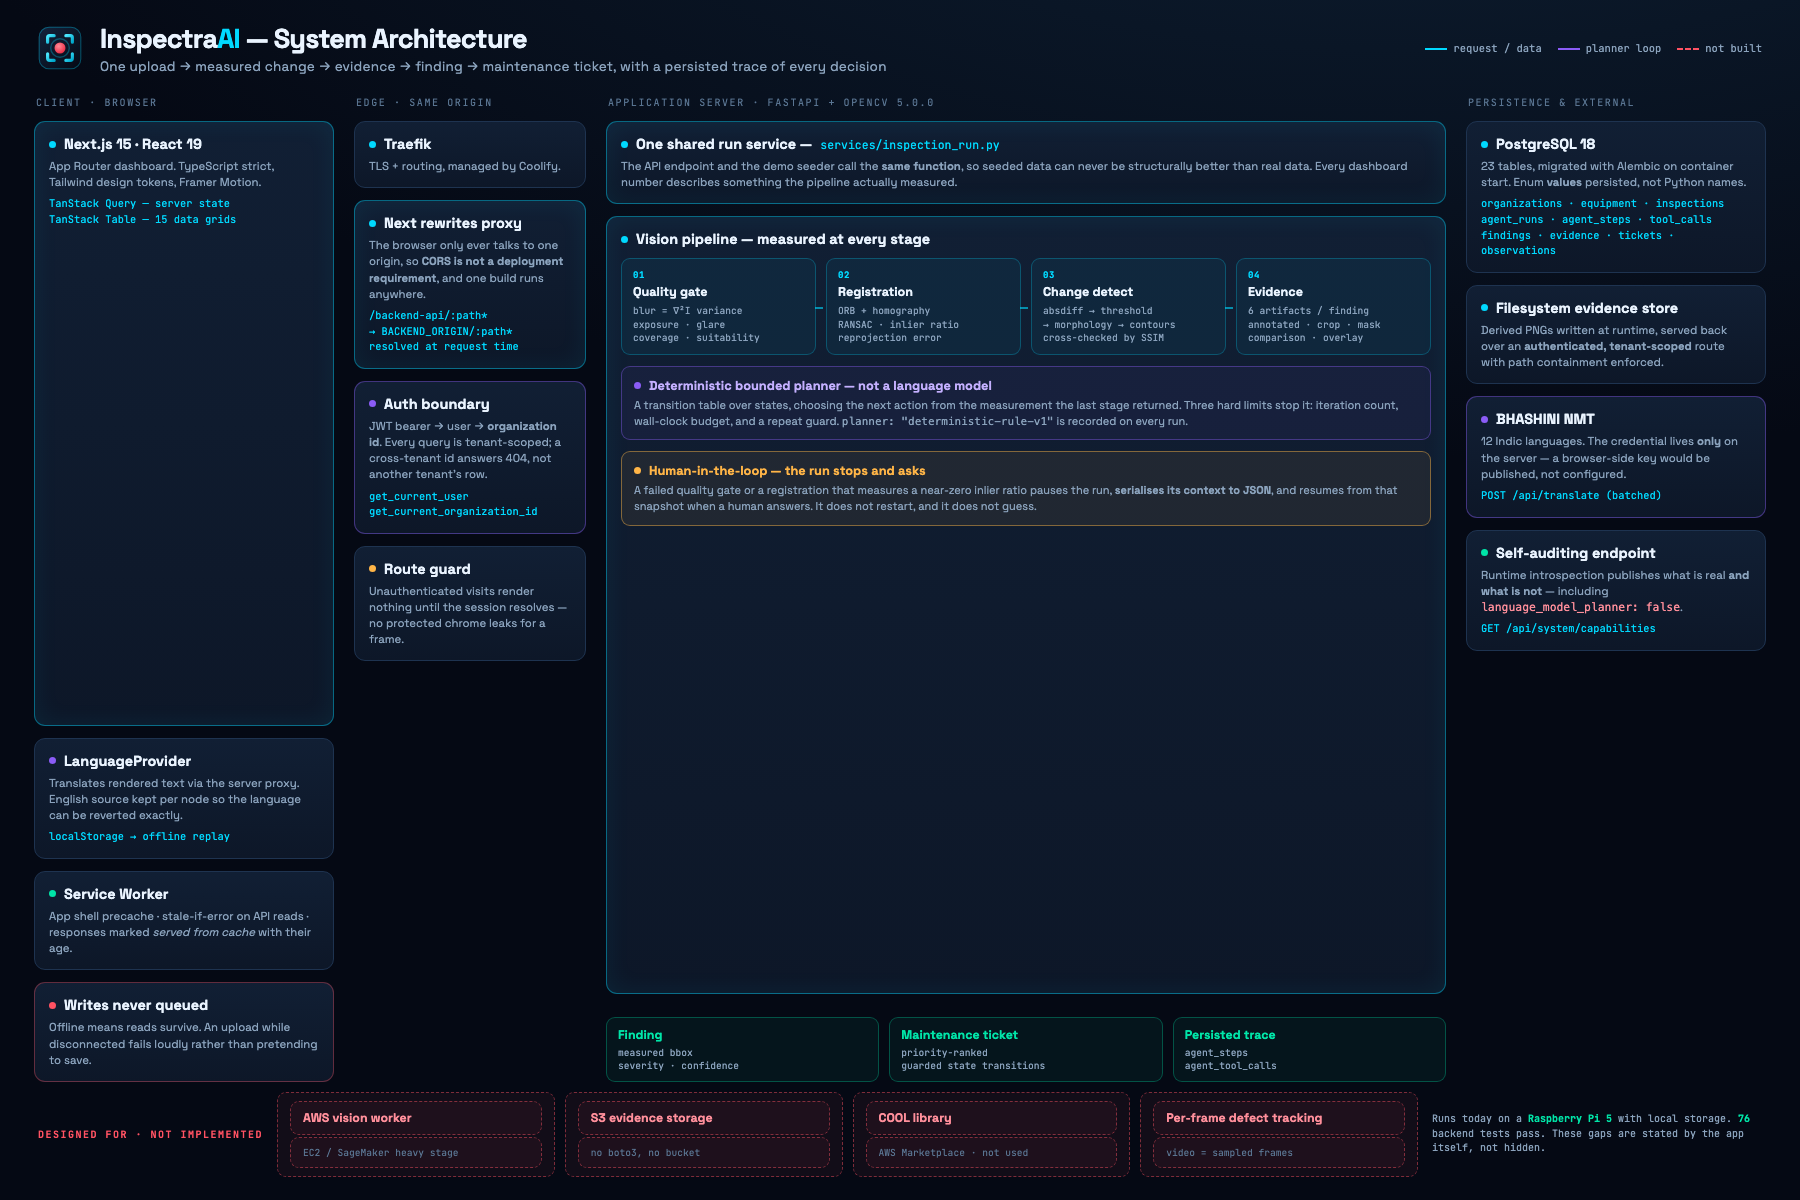
Inspectra AI uses a deterministic, bounded state machine to select its next action based on the results of actual vision tools.
It can continue analysis, request additional evidence, retry registration, create a finding, or pause for human input.
The agent has explicit iteration, execution-time, and repetition limits to prevent uncontrolled workflows.
Evidence-backed maintenance
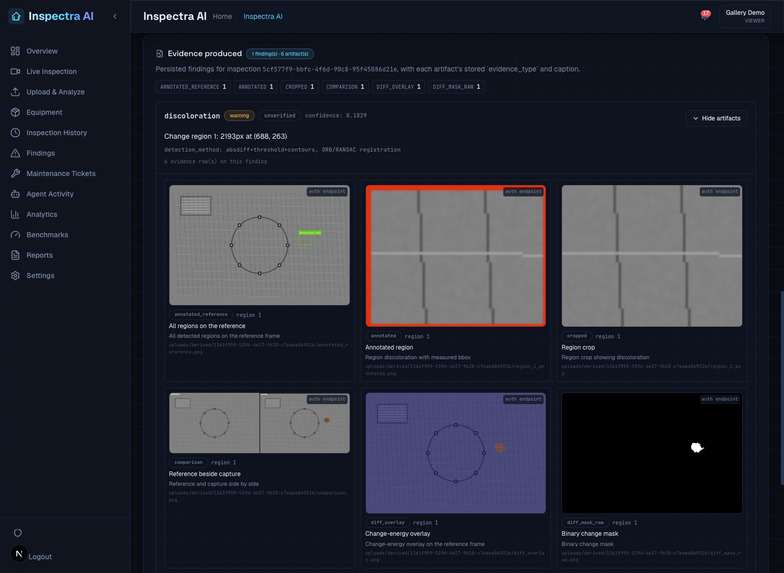
Findings are connected to their source images, annotated evidence, processing measurements, and execution history. Maintenance tickets preserve the context needed for human review.
Transparent agent console
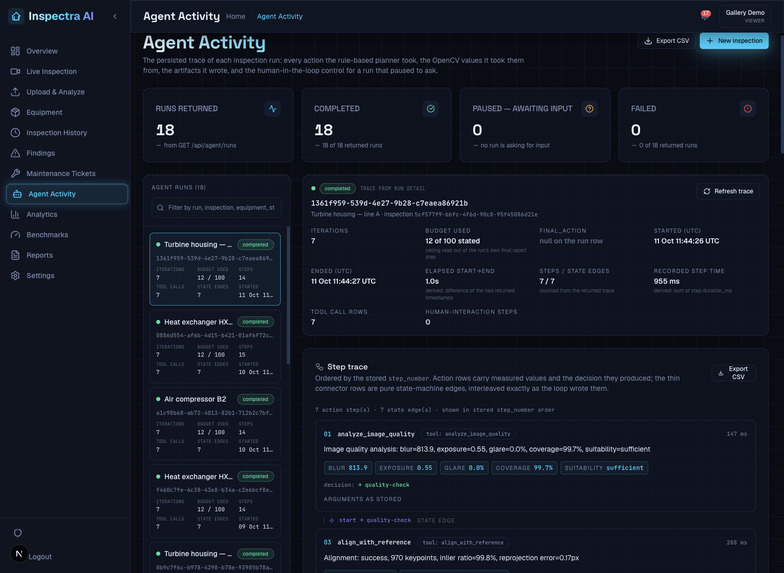
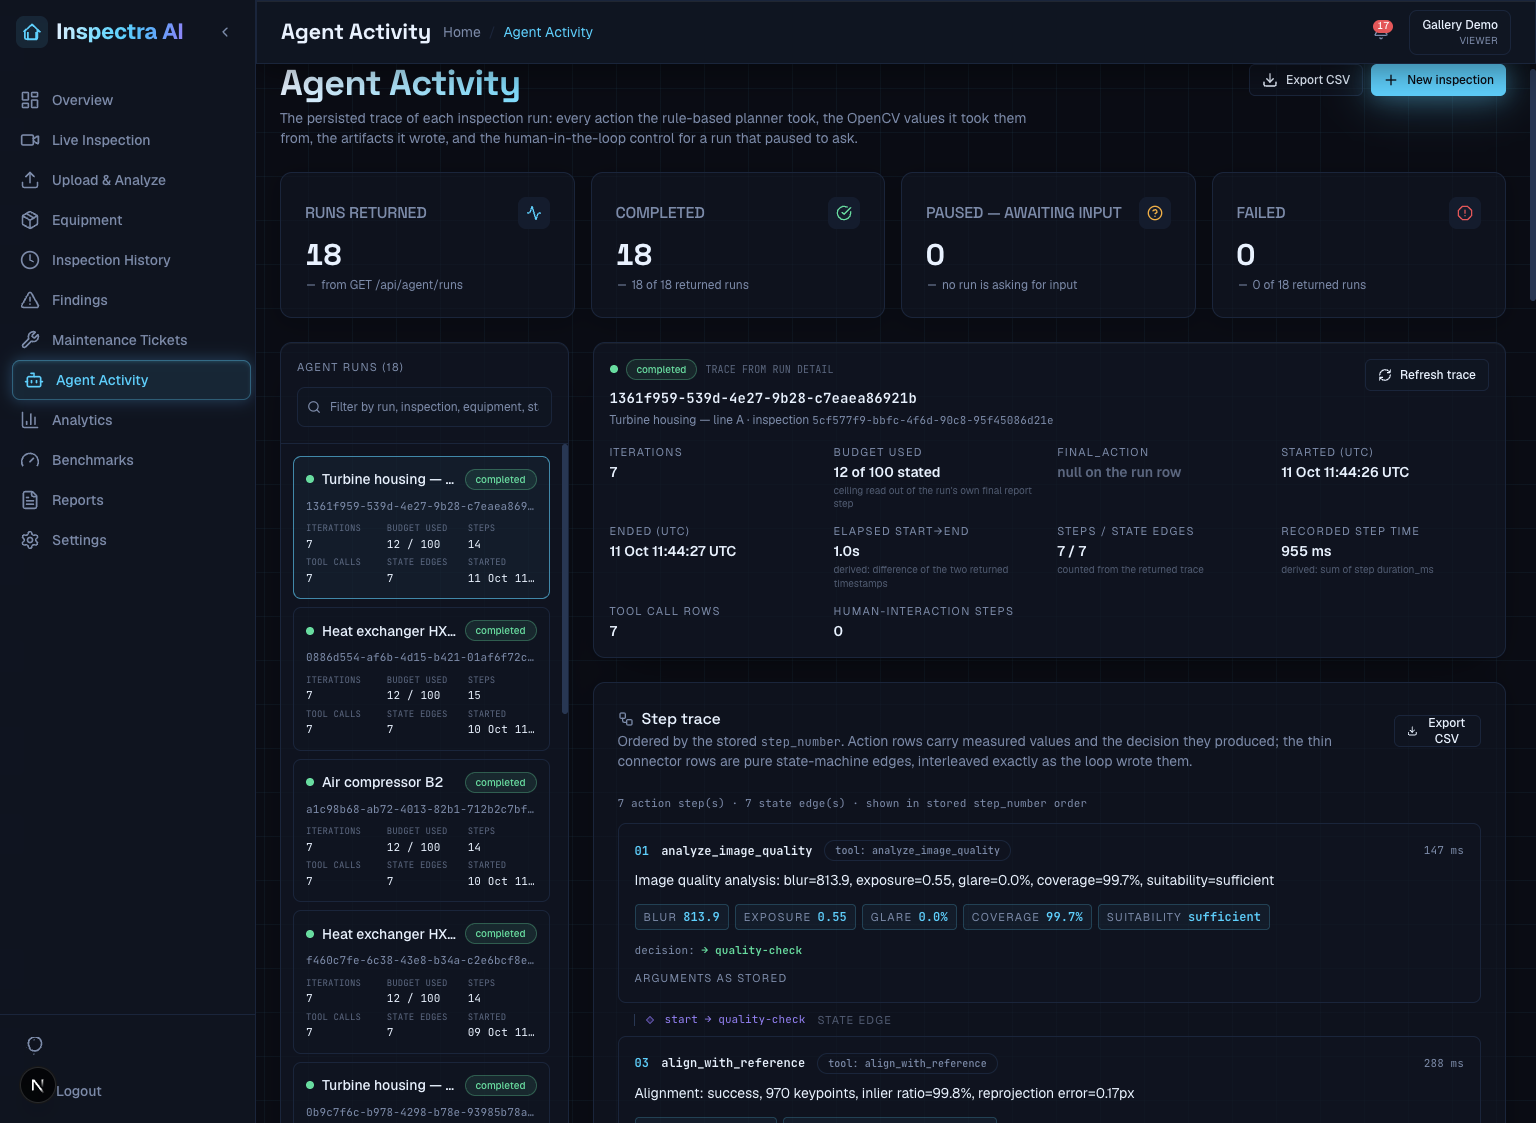
Every inspection produces an ordered execution trace showing the operations performed, measurements returned, execution duration, decisions made, and evidence generated.
Analytics and benchmarking
Inspection statistics, performance measurements, and reports are derived from stored application records rather than hardcoded values. The interface also identifies relevant endpoint limits so users understand the scope of displayed results.
Multilingual and offline-friendly experience
Inspectra AI includes a 12-language interface using the BHASHINI neural machine translation pipeline. Its offline mode preserves the application shell and previously retrieved information, with clear indicators showing when that information was last updated.
How we built it
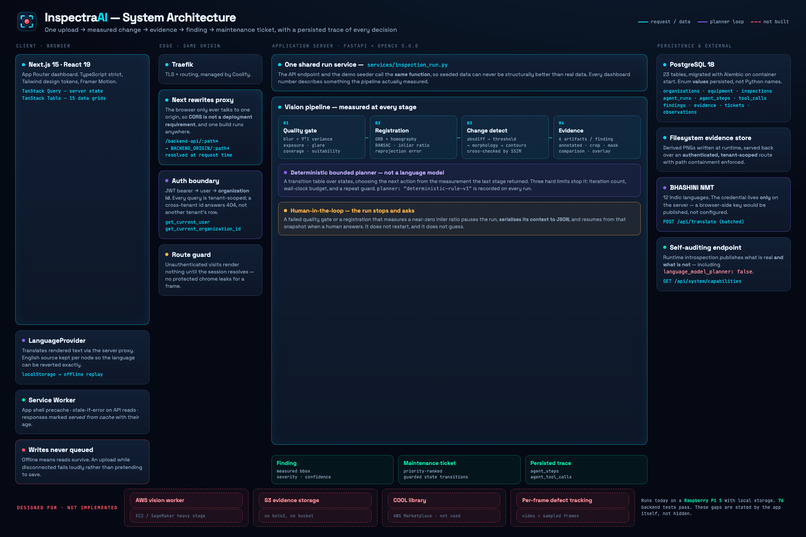
We developed Inspectra AI as a full-stack application with a dedicated computer vision backend and a traceable agentic workflow.
Our frontend uses Next.js 15, React 19, TypeScript, Tailwind CSS, Framer Motion, and TanStack Query.
The backend is built with FastAPI, SQLAlchemy 2, Alembic, Pydantic v2, OpenCV 5.0.0, NumPy, and Pillow, with PostgreSQL 18 providing persistent storage.
The application is containerized using Docker and deployed through Coolify behind Traefik on a Raspberry Pi 5.
One important architectural decision was to use the same inspection service for both normal user requests and our demonstration data seeder.
The inspection endpoint, POST /api/inspections/{id}/run, and the seeding workflow invoke the same underlying processing logic. This prevents demonstration data from taking a shortcut around the actual computer vision pipeline.
We also made the agent's state persistent.
When an inspection pauses to request additional evidence, its workflow context is serialized into the database. Once the user responds, the system resumes from the saved state rather than restarting the entire investigation.
That distinction matters because it turns human-in-the-loop inspection into an actual workflow instead of a decorative confirmation dialog.
For agent orchestration, we deliberately chose a deterministic state machine rather than relying on a language model to invent decisions. Each run records its planner identity as deterministic-rule-v1, and every transition is tied to an observed condition or tool result.
We also took care with external services. Translation credentials remain on the server, and the frontend communicates through a protected translation endpoint instead of exposing secrets in the browser bundle.
Challenges we ran into
Building Inspectra AI taught us that the most difficult bugs are often the ones that make a system look more accurate than it really is.
1. Our test data was creating defects that didn't exist
During evaluation, we noticed something strange: the system was confidently identifying large visual changes in images that were supposed to contain no defects.
Some detections reached a reported confidence of 0.96.
After investigating the image generation process, we discovered that our synthetic test fixtures used affine transformations with replicated image borders. Those artificial edge regions looked like real changes to the detection pipeline.
At the same time, our image registration process wasn't correctly preserving the validity mask for warped regions. Empty pixels introduced during alignment were being interpreted as changed areas.
The result was a pipeline that appeared accurate in certain tests while producing misleading findings.
We corrected the fixture generation and the alignment mask handling, then reran the evaluation.
Evaluation before and after the corrections
| Metric | Before | After |
|---|---|---|
| Evaluated pairs | 8 | 32 |
| Precision | 0.900 | 0.8857 |
| Recall | 1.000 | 0.6889 |
| F1 score | 0.947 | 0.775 |
| Mean IoU | 0.641 | 0.572 |
The corrected results were lower, but they were more trustworthy.
That was an important milestone. We weren't trying to make the numbers look impressive; we were trying to make them meaningful.
2. Two correct benchmark results looked contradictory
At another point, one evaluation reported approximately 0.886 precision and 0.689 recall, while another reported only 0.486 precision and 0.378 recall.
Initially, it looked like the detection system had regressed.
The actual difference was the Intersection over Union (IoU) threshold used to match predicted regions against ground truth.
| IoU threshold | Precision | Recall | Mean IoU |
|---|---|---|---|
| 0.3 | 0.8857 | 0.6889 | 0.572 |
| 0.5 | 0.4857 | 0.3778 | 0.732 |
A stricter threshold rejected more imperfectly localized detections, reducing both precision and recall while increasing the average overlap among accepted matches.
We updated the evaluation interface to display the threshold explicitly and aligned its default with the published baseline.
The lesson was simple: a performance number without its evaluation settings is incomplete information.
3. Deployment issues that only appeared outside development
Our deployment environment exposed several problems that local builds hadn't caught.
SQLAlchemy 2 no longer accepted the legacy postgres:// connection scheme used in part of our configuration, causing startup failures.
We also encountered a health-check mismatch: the application listened on a dynamically assigned port, while the Docker health check continued probing port 8000.
Later, we discovered that our health endpoint opened database connections on every probe. On a Raspberry Pi running numerous containers, this occasionally caused a healthy application to be marked unhealthy during temporary database slowdowns.
We separated process liveness from dependency readiness, allowing the platform to distinguish a running application from an unavailable downstream service.
4. Code that built locally but failed after deployment
One release passed local linting, type checking, and production builds but failed when deployed.
The cause was simple: some imported files existed locally but had never been committed to Git.
We added a verification step that builds the application from git archive HEAD, ensuring the committed repository contains everything required for deployment.
5. Even our testing tools had bugs
During a defect-injection experiment, our test harness unintentionally modified the reference image because NumPy array views were used instead of independent copies.
This made the inserted defect appear in both images and caused an apparent recall of zero across 16 test cases.
The vision engine wasn't responsible. The evaluation harness was.
Fixing the test itself reinforced one of our most important engineering lessons: the tools used to measure correctness must also be tested.
Accomplishments that we're proud of
Our biggest accomplishment is that Inspectra AI performs a real, traceable inspection workflow rather than presenting a simulated AI experience.
In one verified end-to-end run, a single upload generated a 14-step persisted execution trace, including measured results such as:
- Blur score: 1529.0
- Detected keypoints: 1,612
- Registration inlier ratio: 99.9%
- Structural similarity: 0.986
- Changed image area: 2.41%
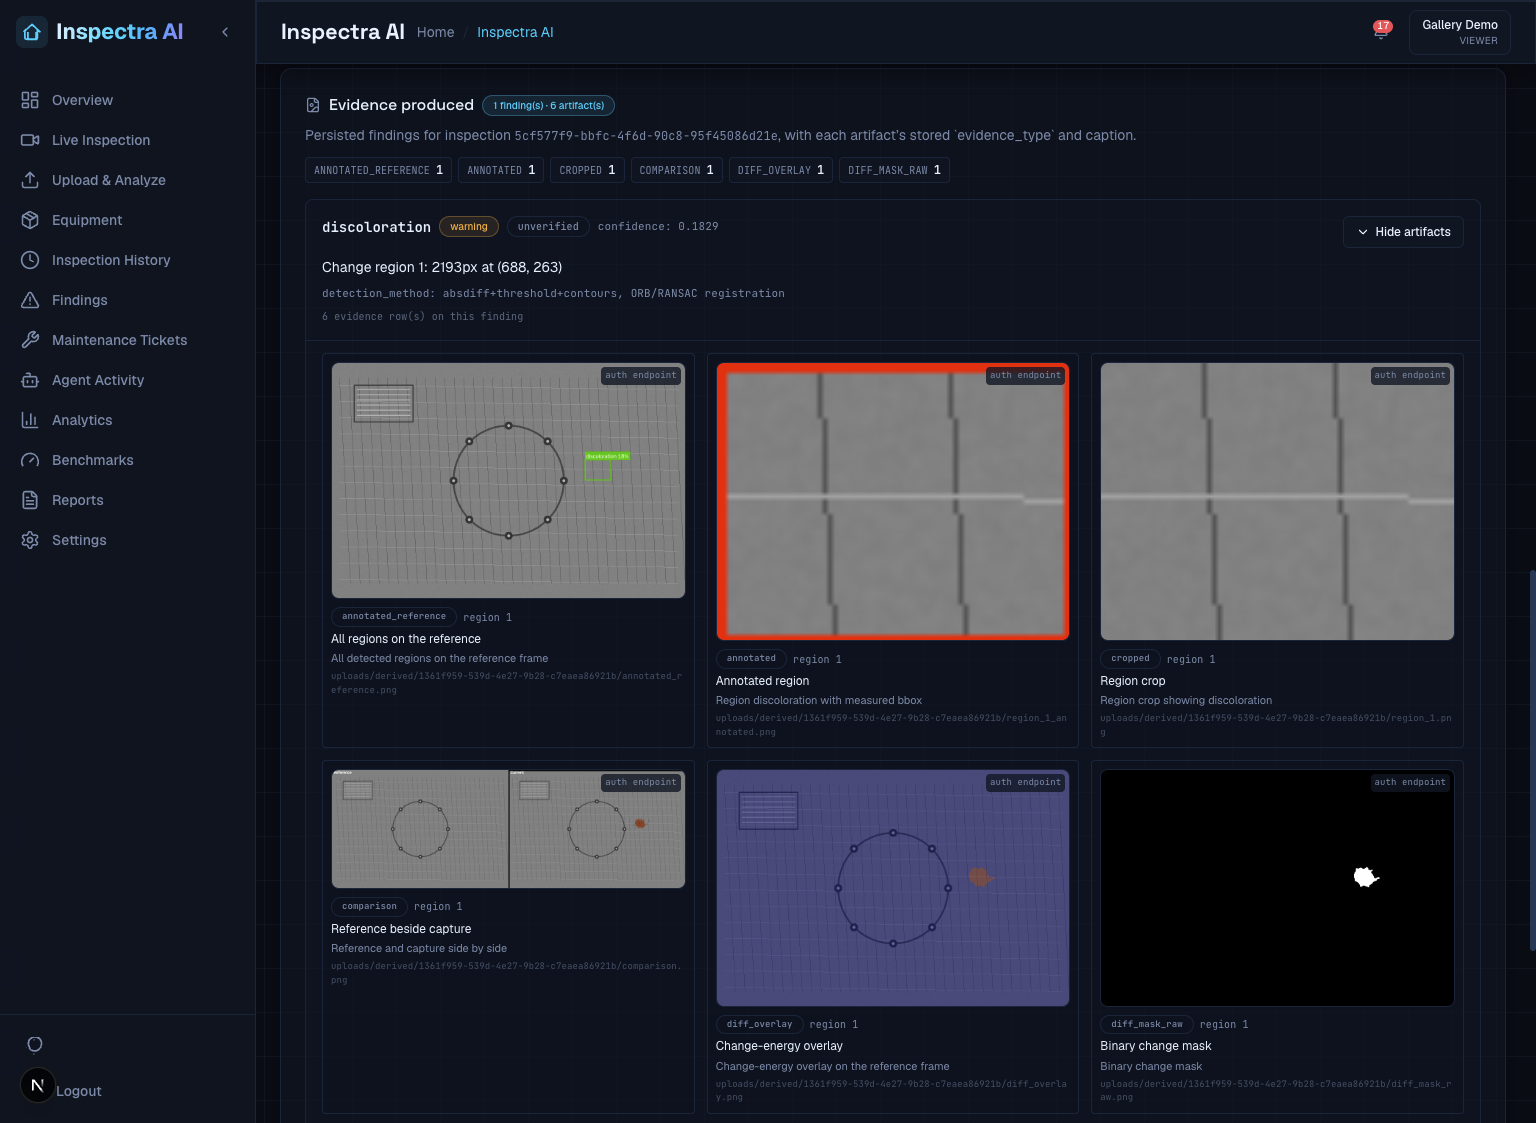
The same run generated six evidence artifacts, which were retrieved through authenticated endpoints and verified as valid PNG files. It also produced a finding and a high-priority maintenance ticket.
We verified five distinct adaptive workflow branches: defect detected, clean image, insufficient image quality, weak registration, and human override.
In the human-override scenario, the system attempted registration multiple times, measured the inlier ratio falling to 6.5%, and requested another specific piece of evidence instead of blindly continuing.
We also eliminated the false change regions caused by our earlier fixture and alignment issues. In subsequent tests, 36 clean image pairs produced no spurious regions, and eight clean benchmark pairs produced no false-positive pairs.
Another accomplishment is transparency about limitations.
Our /api/system/capabilities endpoint explicitly reports that the planner is not language-model-driven and identifies features such as per-frame defect tracking, live camera capture, and real-world accuracy claims as not yet implemented.
Rather than hiding unfinished capabilities, we made them machine-readable.
Finally, 76 backend tests pass, and our evaluation now identifies a specific weakness: the detail_loss category accounted for 13 cases, of which nine were missed.
That gives us a concrete direction for improvement instead of hiding weaknesses inside an overall average.
What we learned
The biggest lesson from building Inspectra AI is that trustworthy computer vision depends as much on evaluation and engineering discipline as it does on detection algorithms.
We learned that a benchmark score must include its threshold, dataset, and evaluation configuration. Otherwise, even correct measurements can become misleading.
We learned that realistic sequences of images can expose problems that isolated unit tests miss. Our most important visual bugs only became obvious when multiple captures were processed consecutively.
We learned that improving the correctness of an evaluation can make reported performance decrease, and that this is sometimes exactly what progress looks like.
We also learned to separate different kinds of failure. An authentication service being temporarily unreachable should not be treated as proof that a user is unauthorized. A slow database should not automatically make a healthy application appear dead.
And we learned that the most reliable deployment test is one performed against the actual files that will be deployed, not just the files present on a developer's machine.
Perhaps most importantly, we learned the value of restraint.
We removed UI elements that displayed hardcoded values, eliminated an unsupported AI summary feature, and stopped presenting unverified accuracy claims.
Inspectra AI became more credible by doing fewer things and demonstrating them properly.
What's next for Inspectra AI
Inspectra AI is already capable of running an evidence-backed inspection workflow, but there is much more we want to build.
AWS-powered hybrid processing
Our planned architecture separates lightweight edge capture from heavier cloud processing. Inspection evidence would be stored in Amazon S3, with an EC2 or SageMaker worker executing suitable OpenCV workloads.
This integration is not yet implemented in the current build, which runs on a Raspberry Pi 5 using local storage.
Real-world industrial evaluation
Our current benchmark results come from a controlled synthetic dataset. The next step is evaluating against properly annotated industrial imagery, with documented capture conditions and independent annotation review.
Temporal defect tracking
We want to extend video analysis beyond selecting useful frames and begin tracking candidate anomalies across time.
Compression-aware visual comparison
Video compression currently introduces additional low-confidence regions in some cases. We want to improve the pipeline's ability to distinguish compression artifacts from meaningful changes.
Consistent image-quality measurements
We plan to unify the blur calculation across processing paths so every displayed quality metric uses the same documented definition.
Expanded inspection operations
Future improvements include live camera capture, server-generated PDF reports, reviewer queues, and service-level tracking for unresolved findings.
Our long-term goal is to make Inspectra AI a practical visual intelligence platform that helps maintenance teams investigate changes, preserve evidence, and make better-informed decisions.
But one principle will remain unchanged:
If a feature cannot be demonstrated with real processing and verifiable evidence, we won't call it finished.
Built With
- alembic
- coolify
- docker
- fastapi
- framer-motion
- next.js
- numpy
- opencv
- opencv-5
- pillow
- postgresql
- pydantic
- python
- radix-ui
- react
- recharts
- sql
- sqlalchemy
- sqlite
- tailwind-css
- tanstack-query
- tanstack-table
- typescript
- zod


Log in or sign up for Devpost to join the conversation.