-
-
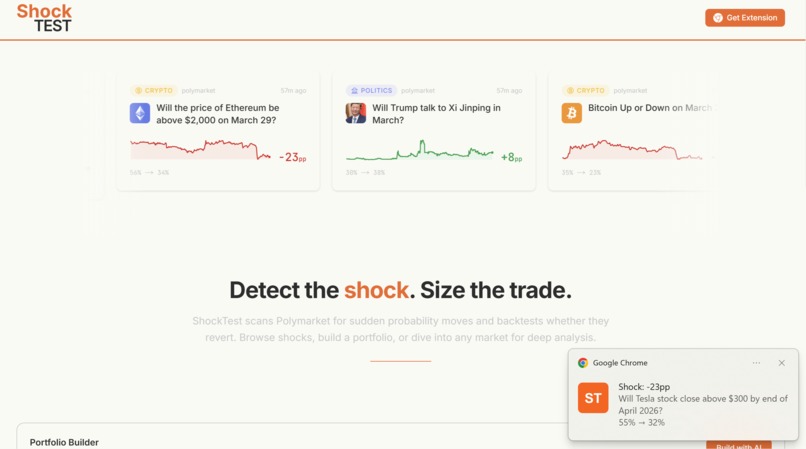
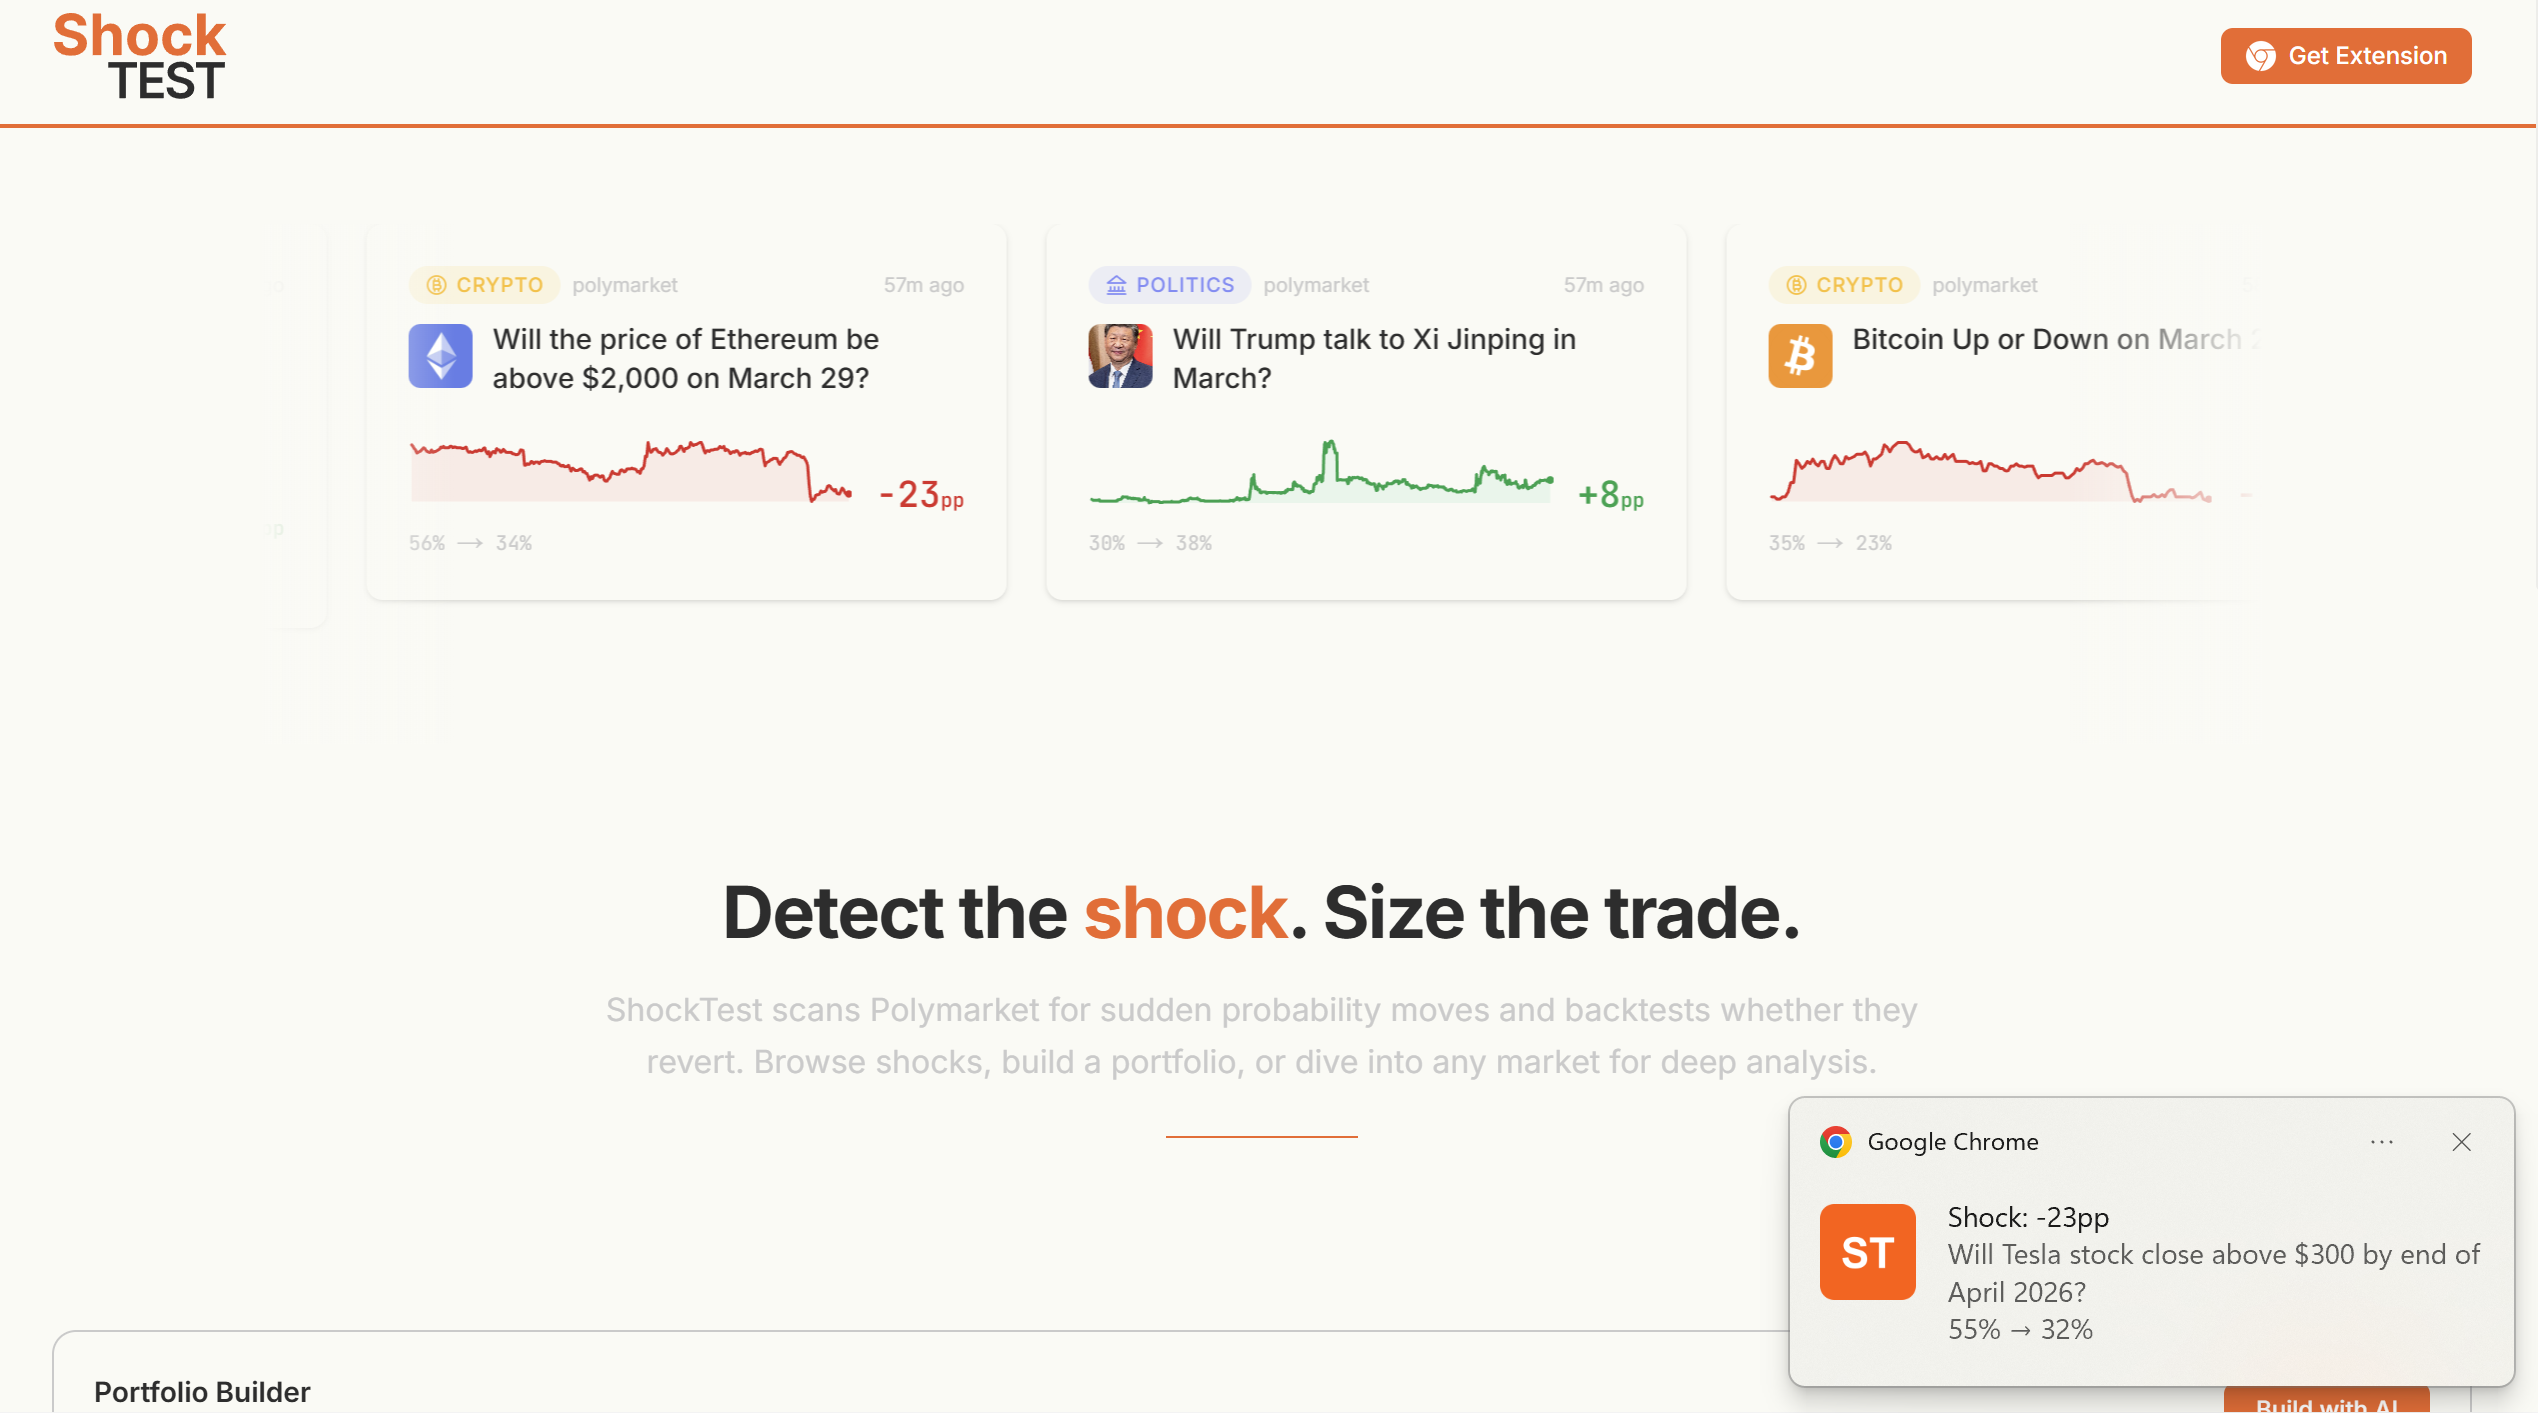
ShockTest sends real-time desktop notifications
-
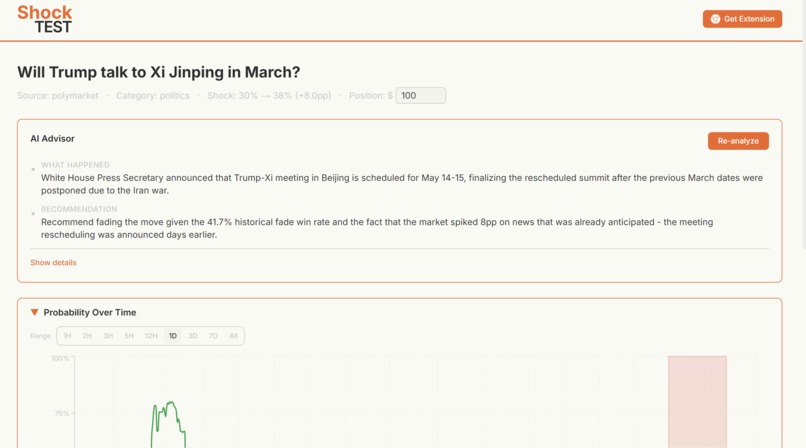
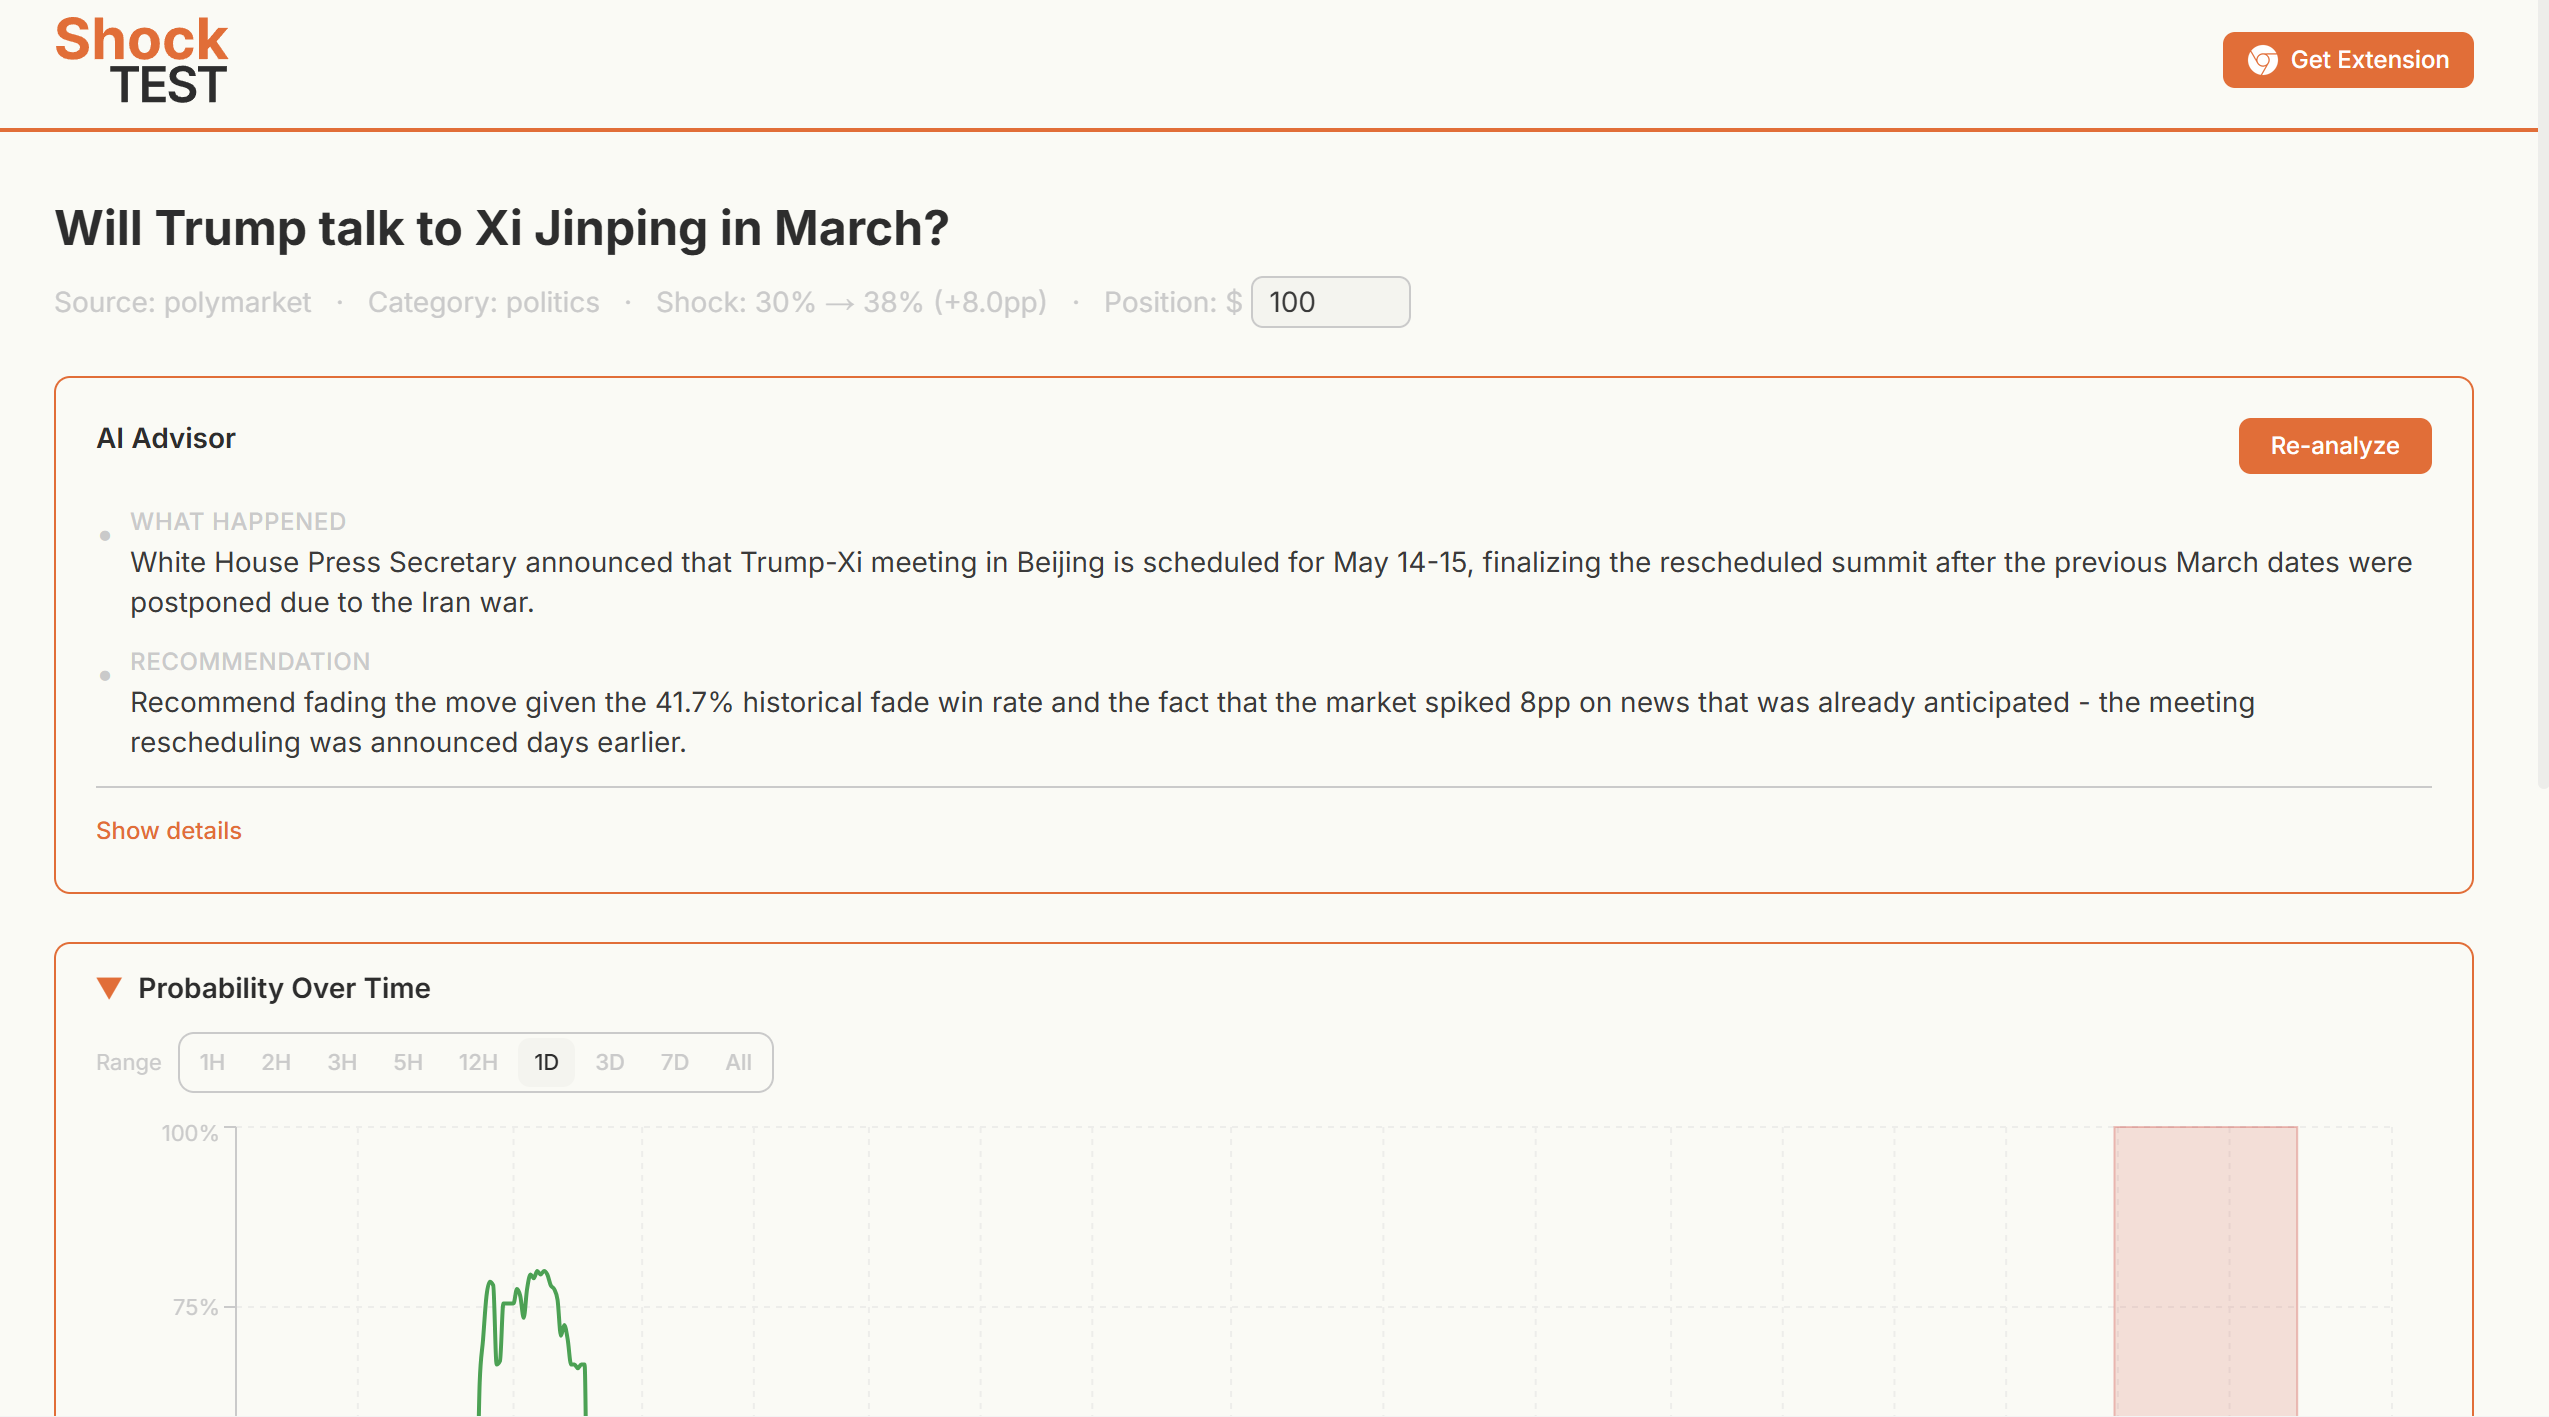
Shocks are analyzed to provide accurate advice
-
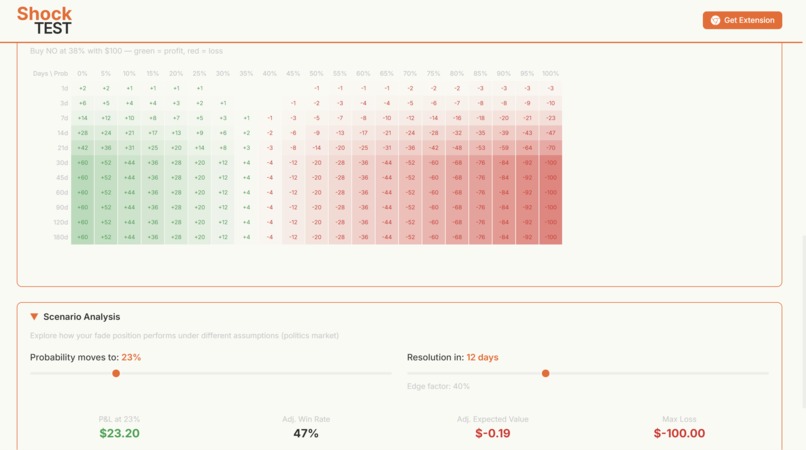
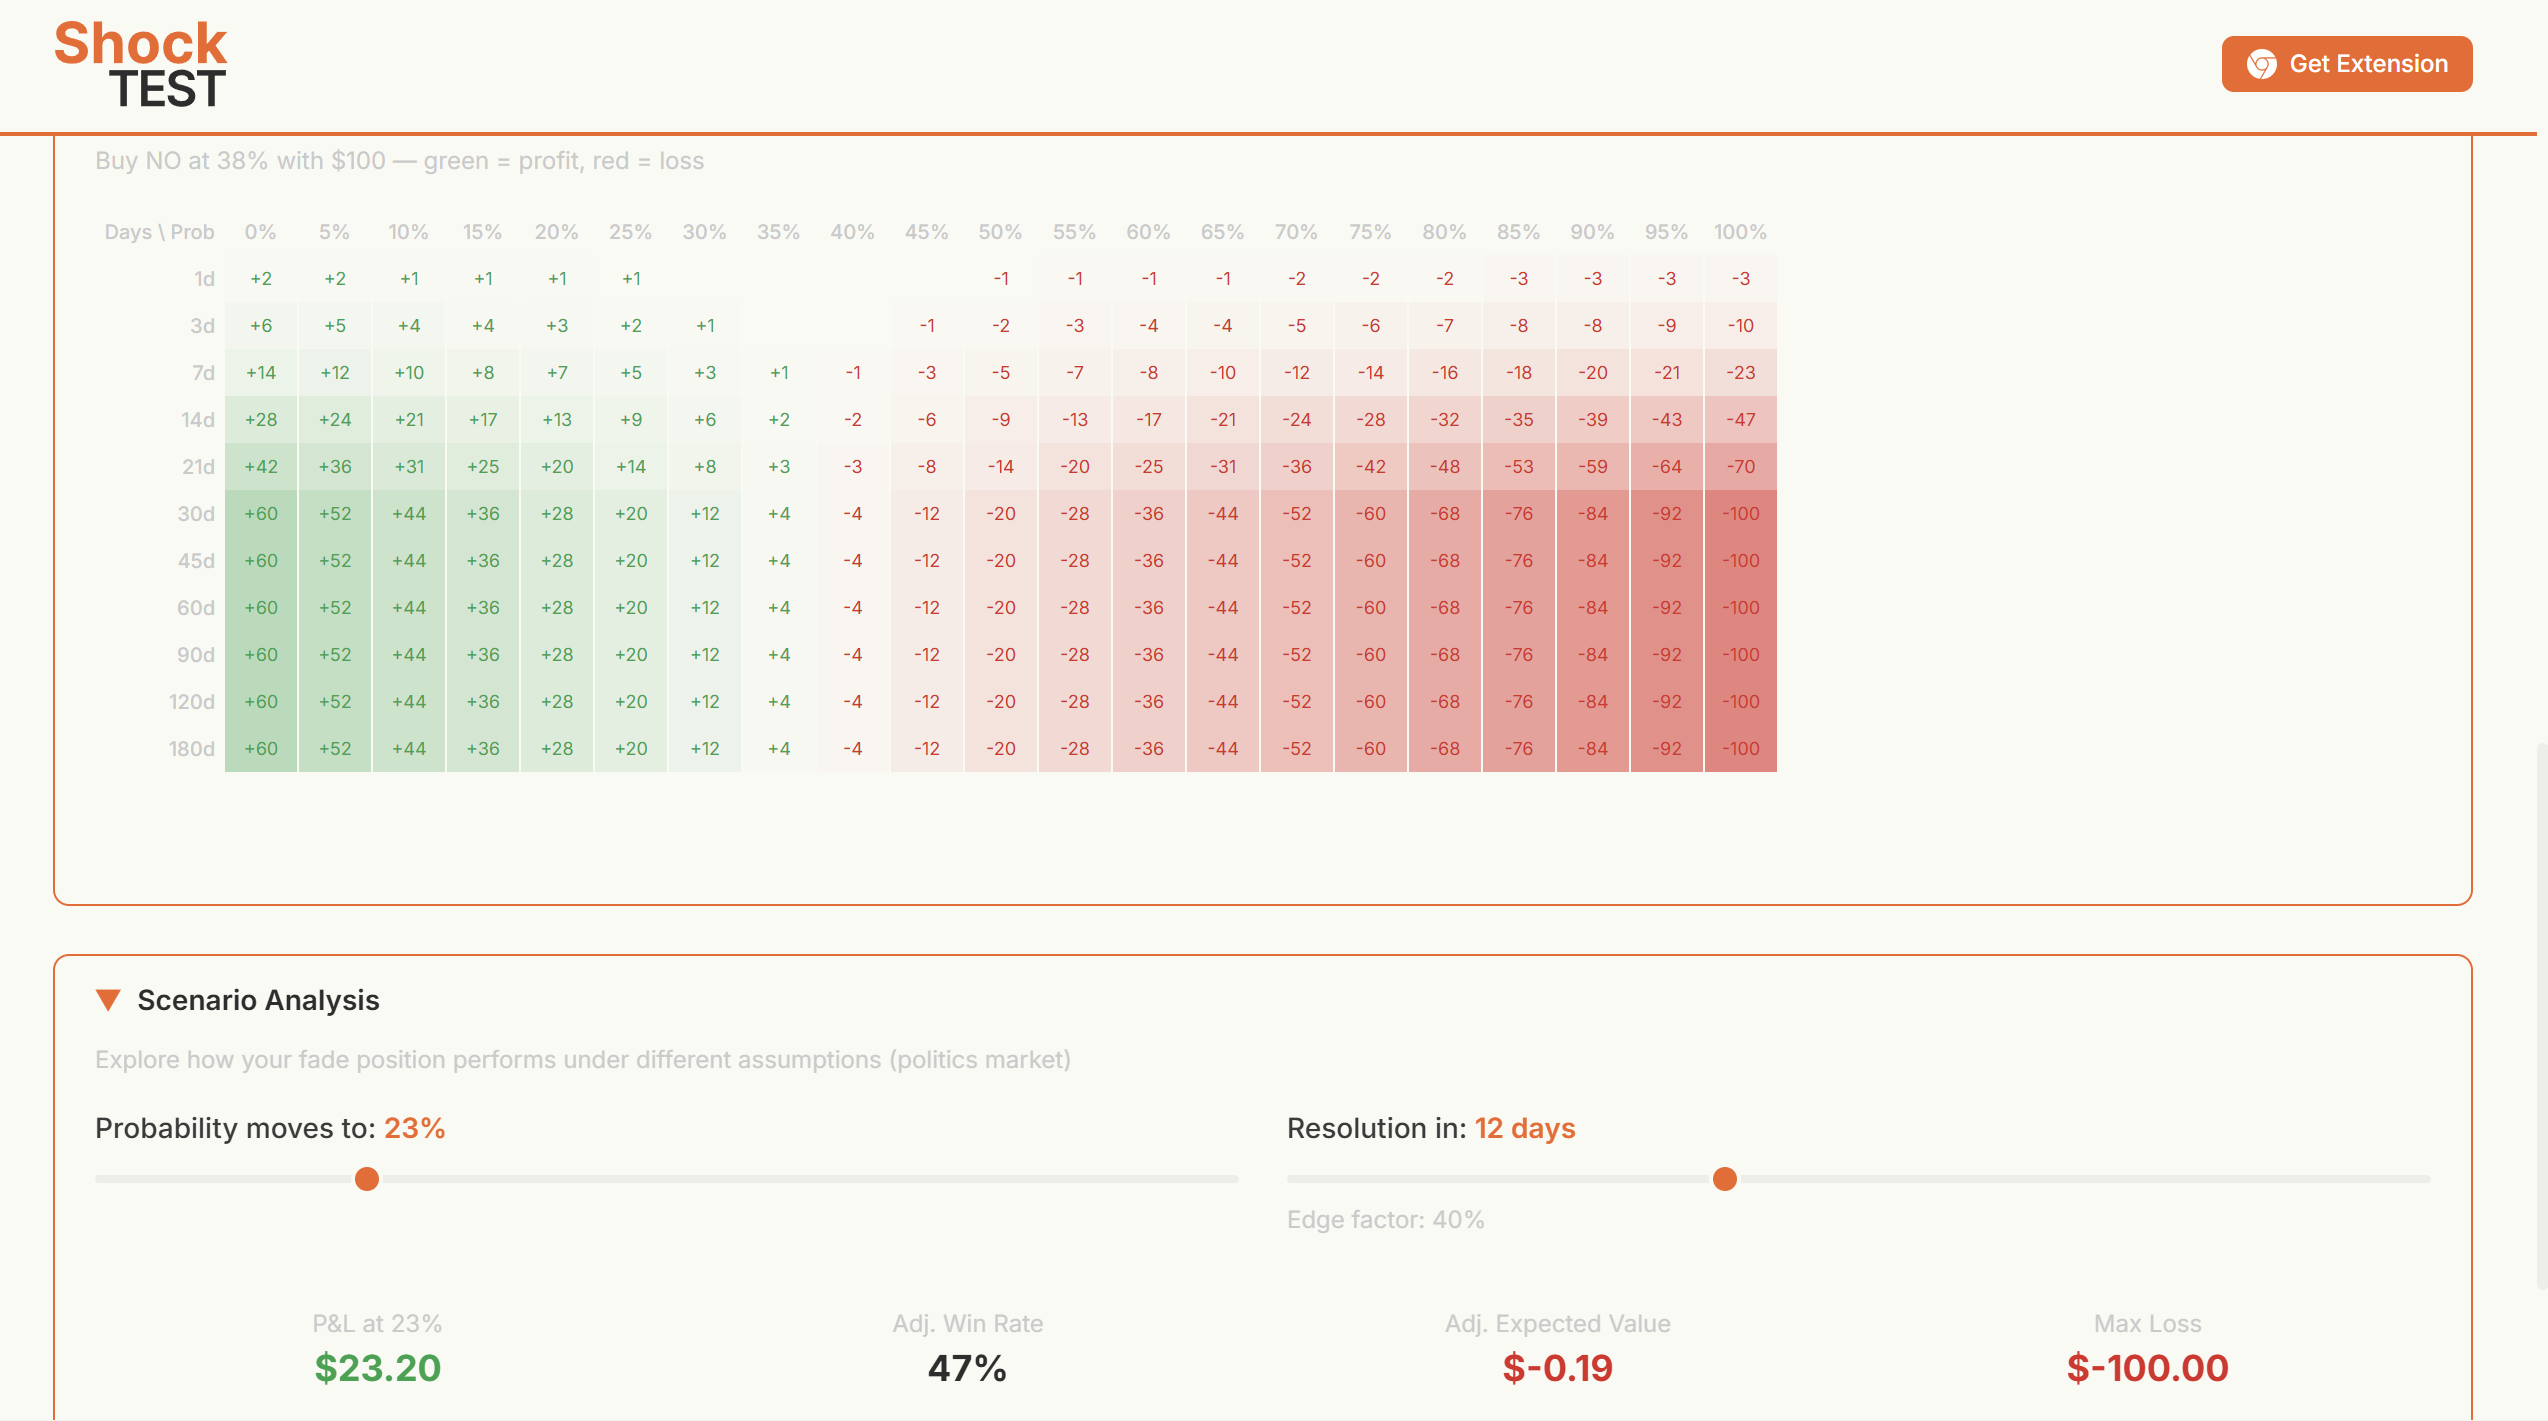
In-depth heatmaps inspired by https://www.optionsprofitcalculator.com/
-
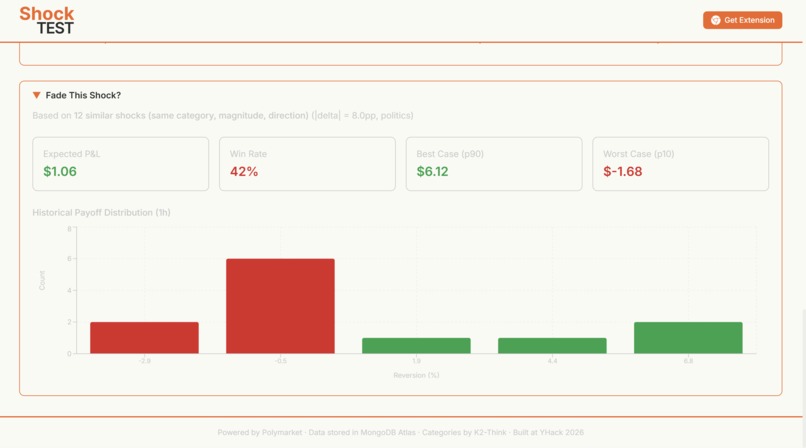
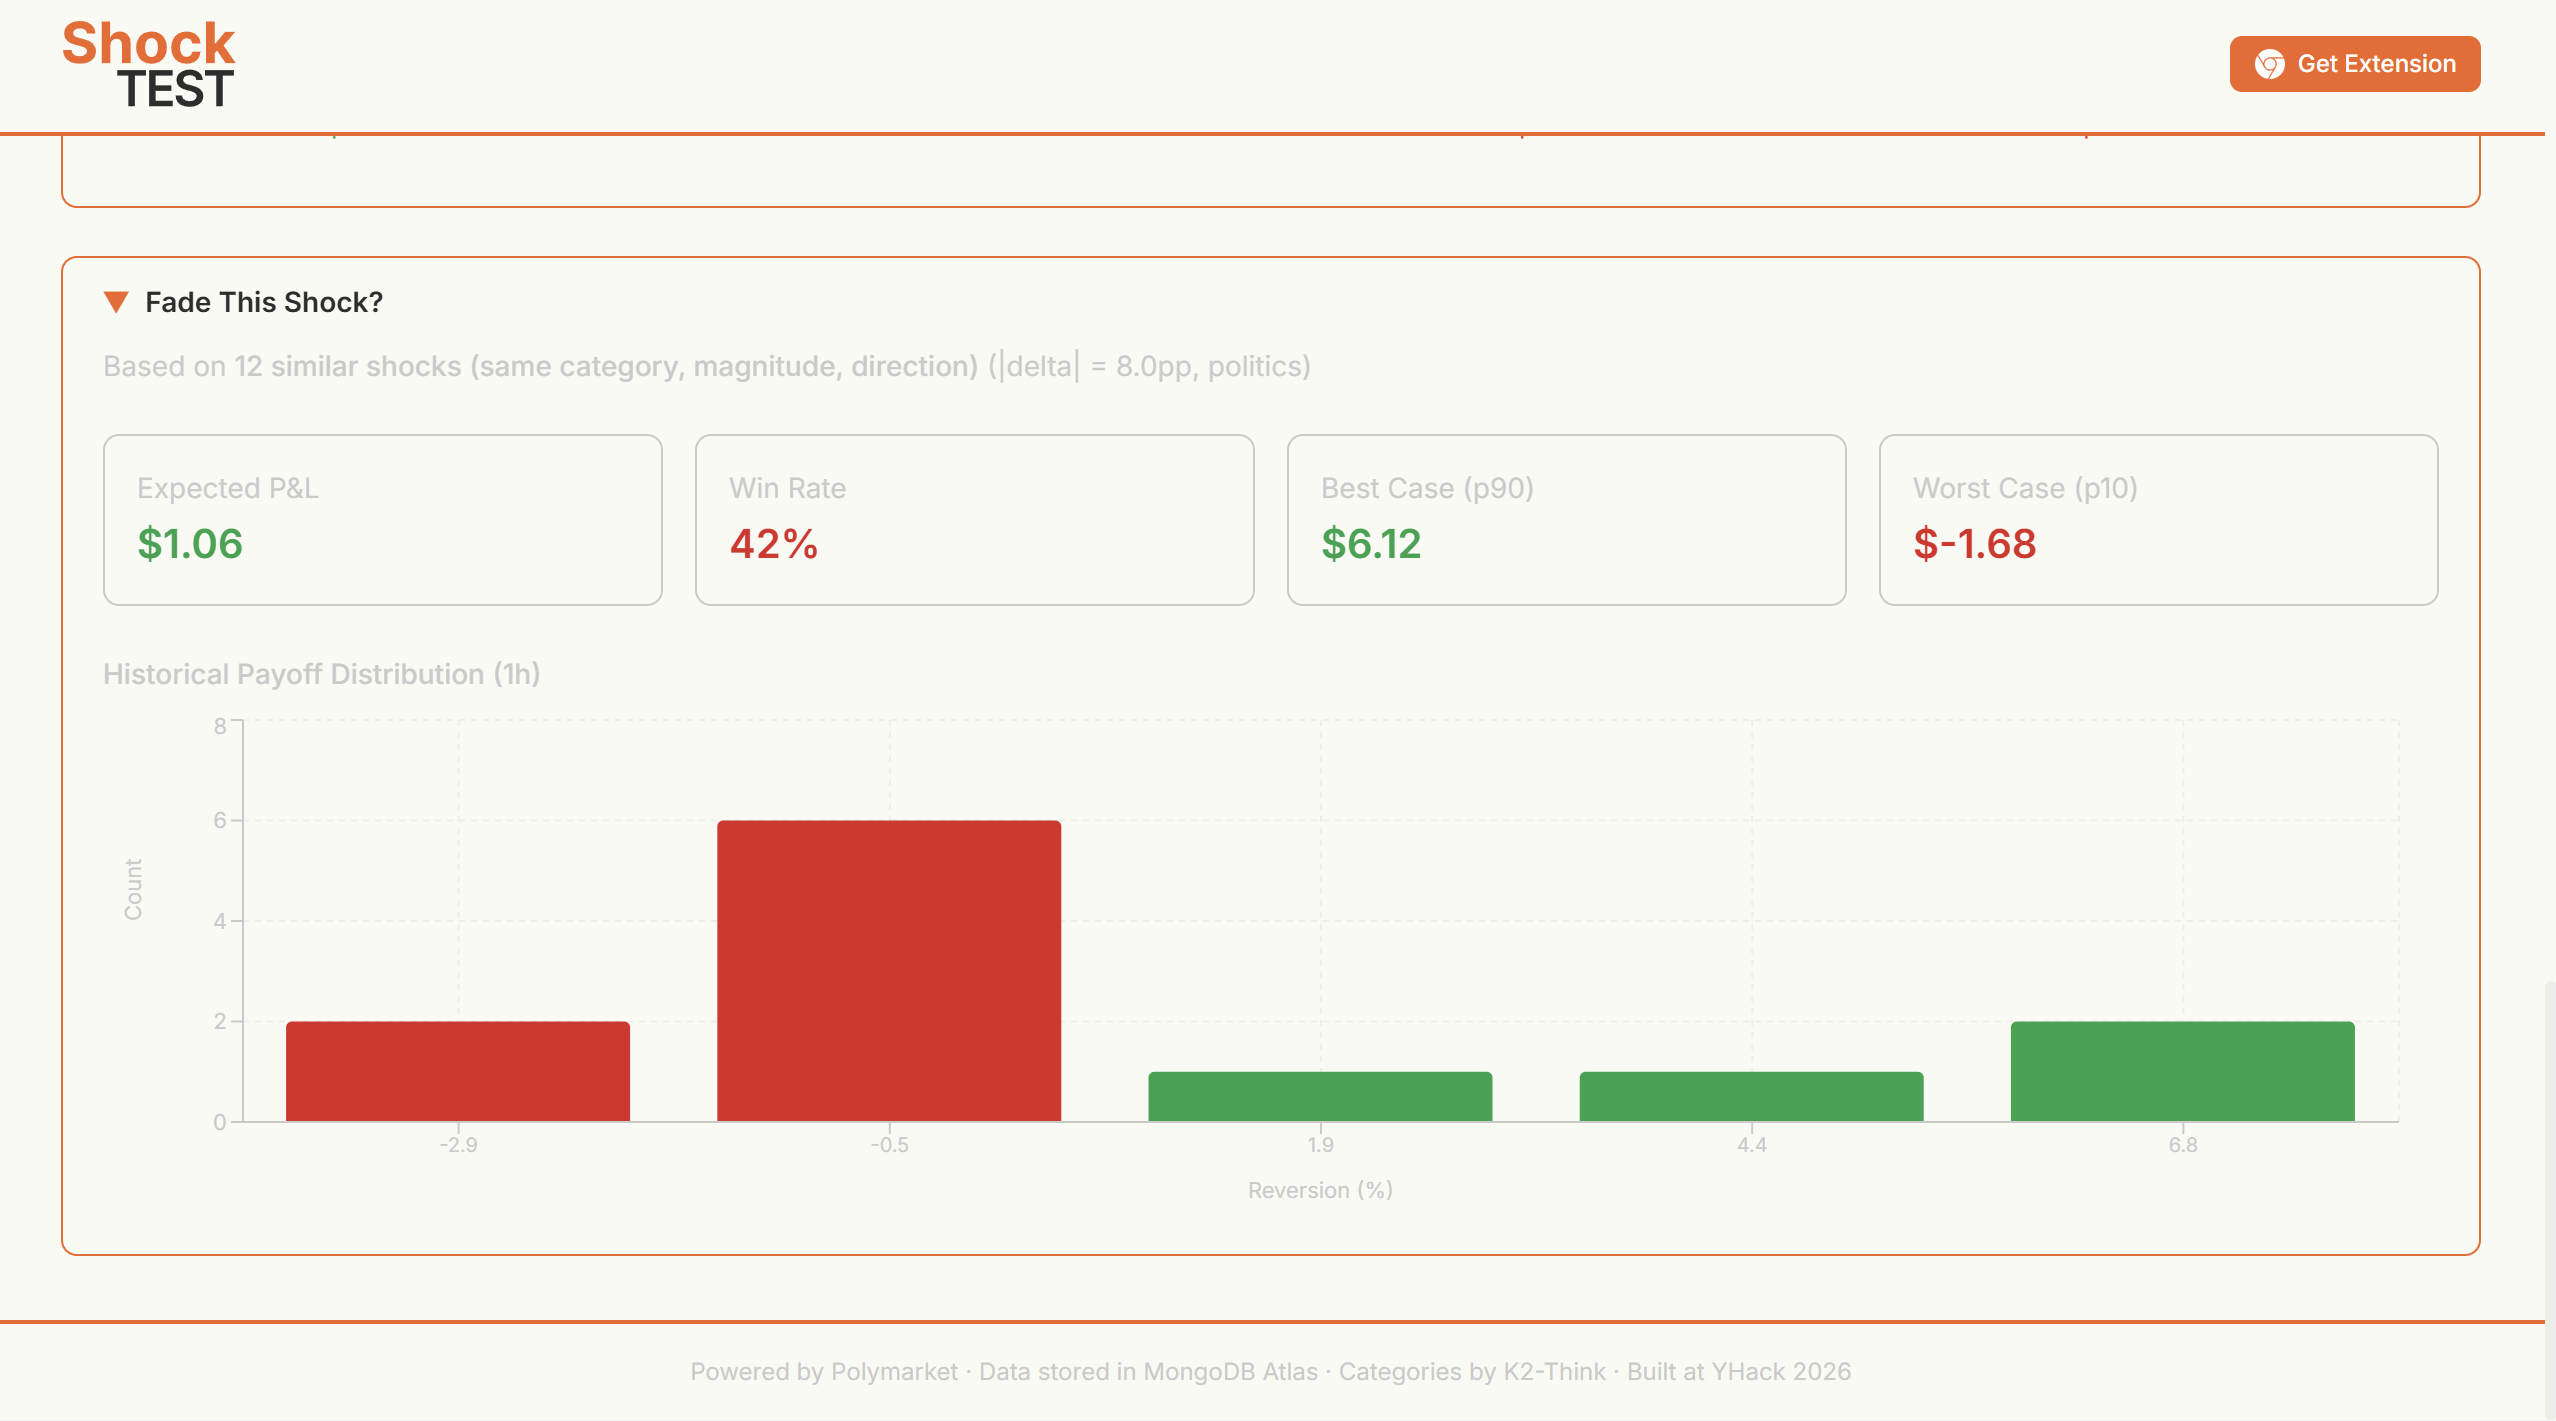
Post-shock mean-reversion calculated by comparing similar shocks in magnitude and direction
-
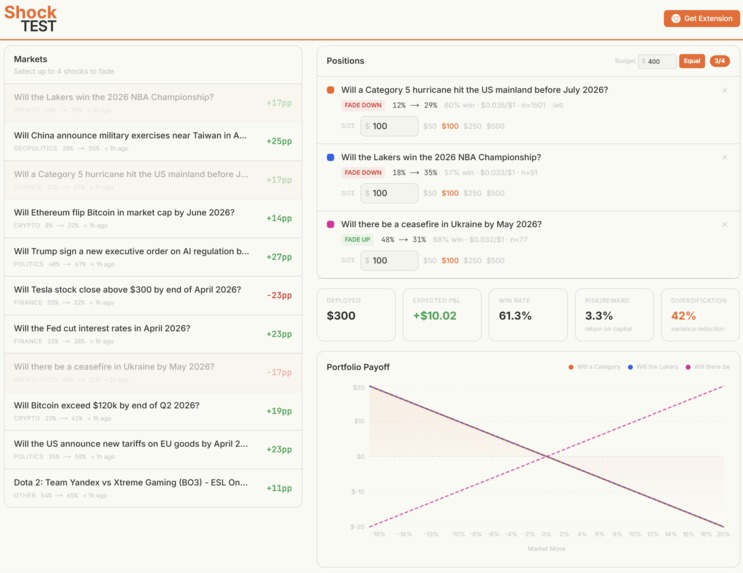
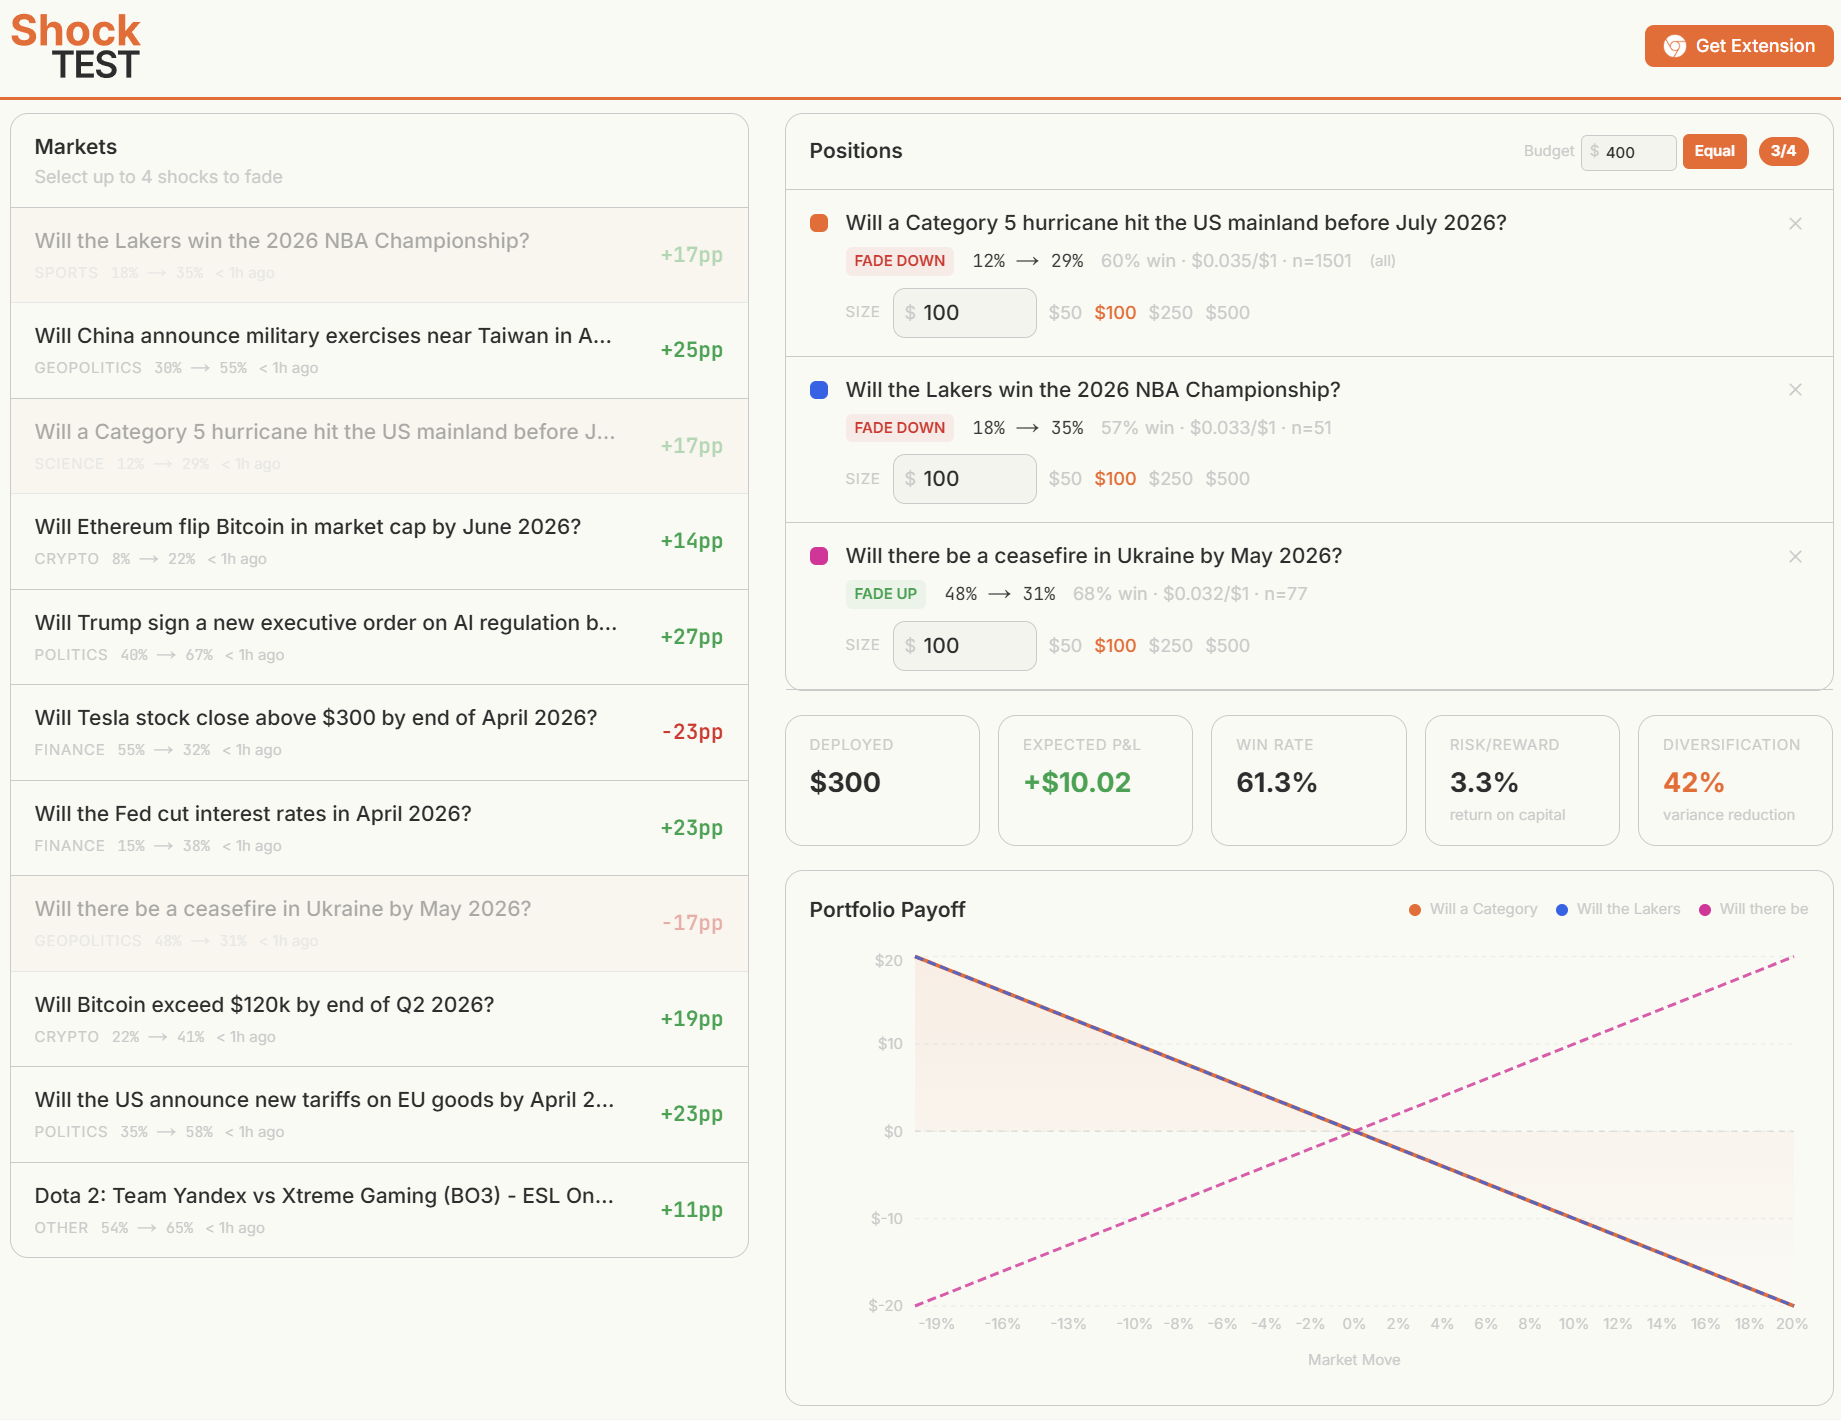
Portfolio making made simple, with state-of-the-art reasoning from K2 Think V2
Inspiration
Prediction markets are supposed to be efficient — but anyone who's watched Polymarket during a breaking news cycle knows they overreact. A headline drops, probability spikes 20 points in minutes, and then slowly drifts back. We wanted to test whether that pattern is real and tradeable. The question: if you systematically bet against every large, sudden price move, do you make money?
We were also inspired by tools like optionsprofitcalculator.com — options traders have had interactive payoff visualizers for years. Prediction market traders have nothing comparable. We wanted to build the equivalent: see a shock, understand the edge, visualize the payoff, size the trade.
What it does
ShockTest is a live trading signal system for Polymarket that detects probability shocks, measures whether markets systematically mean-revert, and gives traders the tools to act on it.
The finding: We analyzed 1,337 shocks across 107 markets. 59.9% revert within 6 hours (z = +7.13, p < 0.001). Political markets revert at 64.7%. This is a statistically significant, tradeable edge.
The product has five layers:
Detection — A Python monitor polls Polymarket every 2 minutes, detects large probability moves, and fires live alerts. Google Gemini auto-categorizes each market (politics, sports, crypto, etc.).
Analysis — For each shock, an AI agent (powered by Claude) searches the web for what caused the move and assesses whether it's an overreaction. Historical backtest data shows win rates and expected P&L for similar shocks.
Visualization — Interactive P&L heatmaps, payoff curves, scenario analysis panels, and trade simulators — all driven by real backtest data. Traders can adjust position size and see how their P&L changes across every possible outcome.
Portfolio Builder — Select multiple shocks, size positions with AI-powered Kelly criterion optimization (via K2-Think), and see combined portfolio payoff graphs with diversification benefits.
Chrome Extension — A browser extension that overlays shock data directly on Polymarket. When you visit a market page, you see shock bands highlighted on the price chart, reversion statistics in a floating panel, and desktop notifications for new shocks.
How we built it
Team of three, 24 hours, clear ownership:
Person 1 (Data Pipeline): Python scripts fetching from Polymarket's Gamma + CLOB APIs, shock detection algorithm, live monitor polling every 2 minutes, Google Gemini for market categorization. All data stored in MongoDB Atlas.
Person 2 (Analysis + AI Agents): Post-shock reversion analysis, statistical significance testing, backtest engine, Claude-powered web search agent for shock explanation, K2-Think AI for portfolio optimization, and the full Chrome extension (popup, Polymarket overlay with chart band positioning, notification system).
Person 3 (Dashboard): Next.js 14 App Router with TypeScript, Tailwind CSS, and Recharts. Single-page dashboard with featured shock carousel, interactive filtering, shock detail pages with payoff curves and scenario panels, portfolio builder page. Deployed on Vercel.
The Chrome extension intercepts Polymarket's own price history API calls to position shock bands with pixel accuracy on their visx SVG charts, reads axis tick data directly from the DOM, and uses a MutationObserver to handle Polymarket's React SPA navigation.
Challenges we ran into
Polymarket's API is undocumented. The Gamma API returns
clobTokenIdsas either a JSON string or a list depending on the market — we had to handle both. Price history lives on a completely separate CLOB endpoint that isn't referenced anywhere in their docs.Chrome Extension CSP. Polymarket's Content Security Policy blocks inline scripts. We had to move our fetch interceptor to a separate file loaded via
chrome.runtime.getURLand declared as a web-accessible resource.Multi-market event pages. A single Polymarket URL can have 5+ sub-markets (e.g. "Will X happen by March 31?" vs "...by April 5?"). Getting the overlay to show shock bands for only the currently-displayed sub-market required reading the chart title from the DOM via spatial proximity detection and cross-referencing against the URL slug.
K2-Think timeouts. The AI portfolio builder sends the full shock list to K2's API, which can take 60+ seconds to respond. Cloudflare's 100-second timeout kills the connection. We had to optimize prompt size and add server-side logging to debug.
Sports markets break the model. A basketball team scoring late in a close game causes a "shock" in win probability — but that's rational pricing, not an overreaction. We had to add sport-specific reasoning to the AI advisor so it doesn't recommend fading a team that's actually winning.
Accomplishments that we're proud of
Statistically significant result. 59.9% reversion rate with z = +7.13 isn't a fluke. We found a real, measurable inefficiency in prediction markets.
The Chrome extension. It reads Polymarket's visx chart axis ticks, intercepts their price history fetch calls, and draws pixel-accurate shock bands on the chart — all without any access to their source code. It feels native.
End-to-end trading workflow. Detect → Explain → Visualize → Size → Trade. Most hackathon projects stop at "here's a dashboard." We built the tools a trader would actually use to act on the signal.
151 commits in 24 hours across three people with zero merge conflicts that blocked anyone for more than 5 minutes.
What we learned
Prediction markets are efficient on average but systematically overreact to breaking news in the short term — especially in political markets. The edge is real but category-dependent.
Building browser extensions that interact with third-party SPAs is an exercise in reverse engineering. Every assumption about DOM structure can break. Spatial proximity detection (finding the nearest bold text above the chart) turned out more reliable than DOM traversal.
AI agents are powerful for analysis but unreliable for structured output. K2-Think sometimes returns valid JSON, sometimes wraps it in markdown code blocks, sometimes adds a preamble. The
extractJsonfunction that handles all these cases was written out of necessity.MongoDB's free tier (512MB) is tight when you're storing price series for 100+ markets. We had to project out the
seriesfield on list queries and batch our mini-series fetches.
What's next for ShockTest
Live trading integration — Connect to Polymarket's order API to execute fade trades directly from the dashboard, with configurable risk limits.
Out-of-sample validation — Our current results are in-sample. We need to run the detector forward on new data without peeking to confirm the edge persists.
More markets — Expand beyond Polymarket to Kalshi, Metaculus, and other platforms. Cross-platform arbitrage detection when the same event is priced differently.
Chrome Web Store release — Package the extension for public distribution with automatic API URL configuration.
Alert customization — Per-category notification rules, quiet hours, minimum shock thresholds, and Telegram/Discord webhook integration for teams.
Built With
- k2
- manifest
- mongodb
- next.js
- polymarket
- python
- react
- tailwind
- typescript
- vercel


Log in or sign up for Devpost to join the conversation.