-
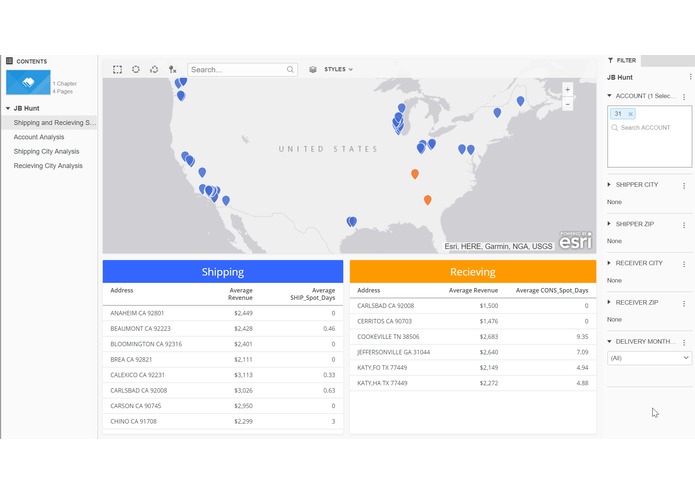
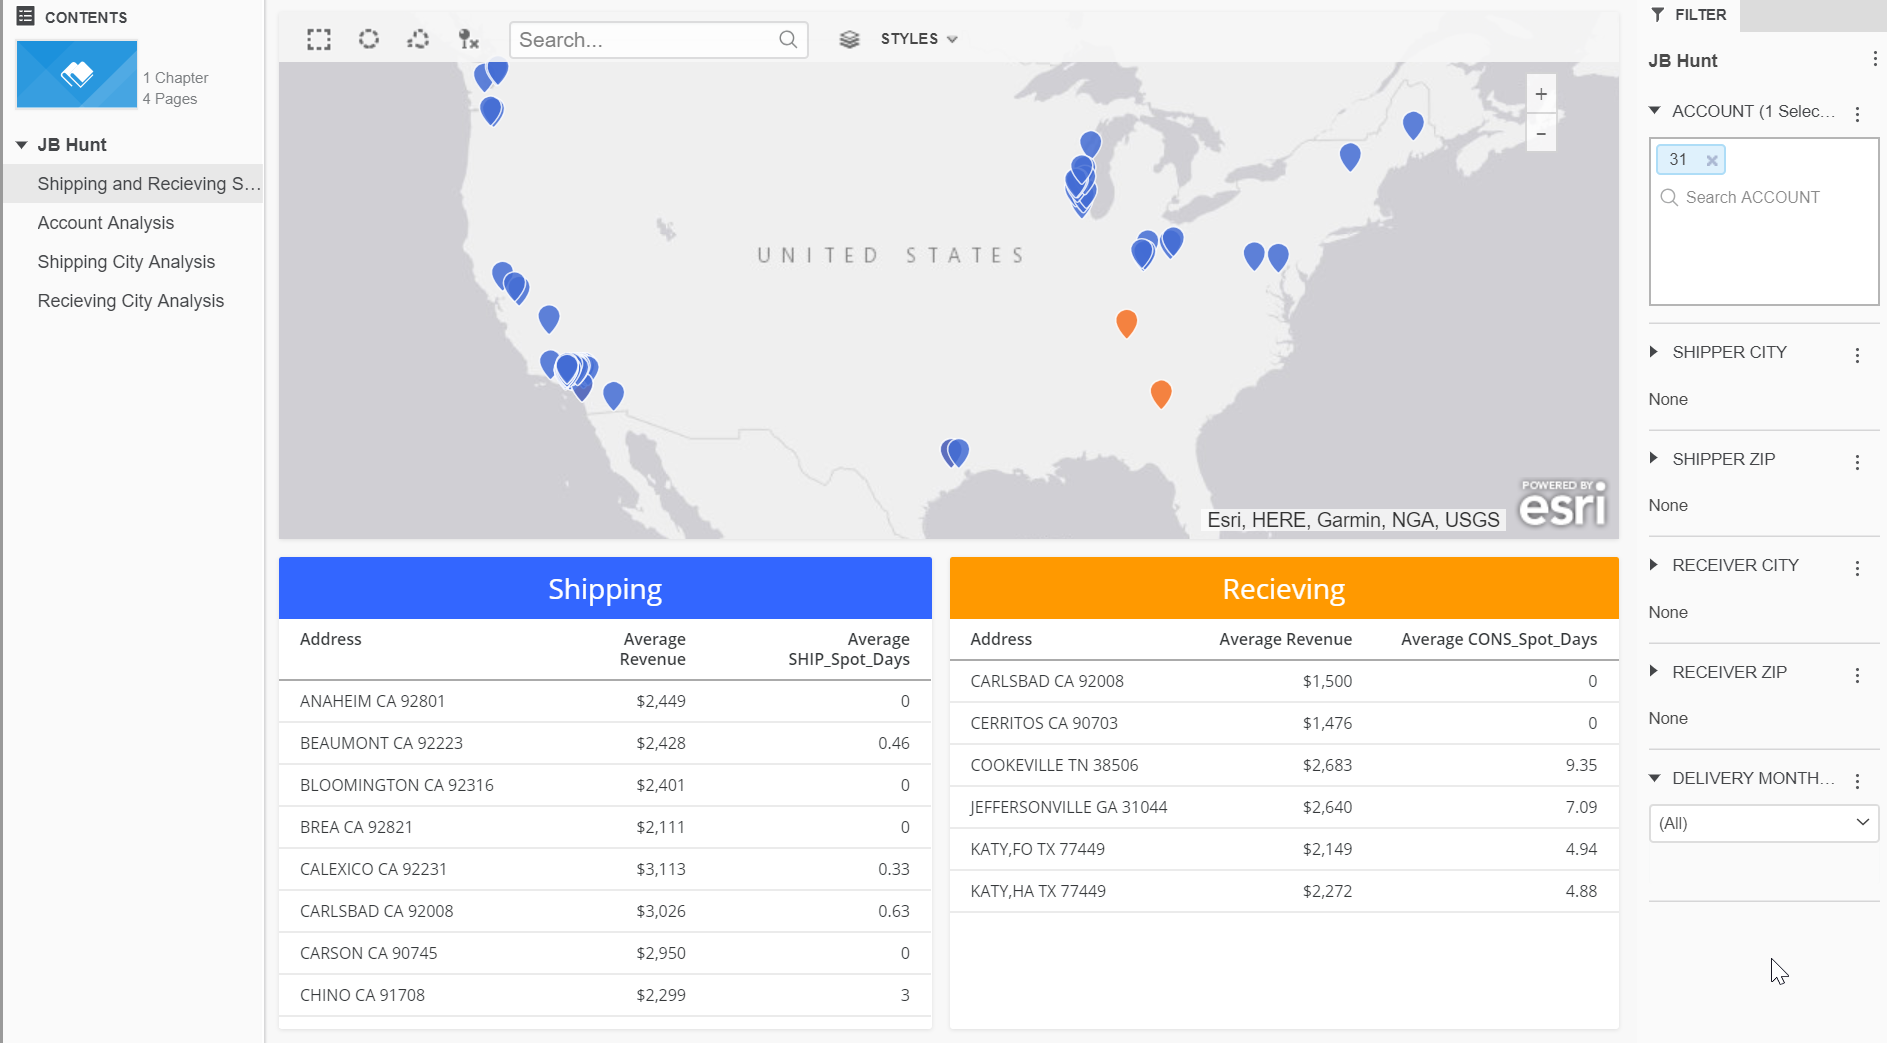
Map showing shipping and receiving cities that can be easily filtered to show certain information.
-
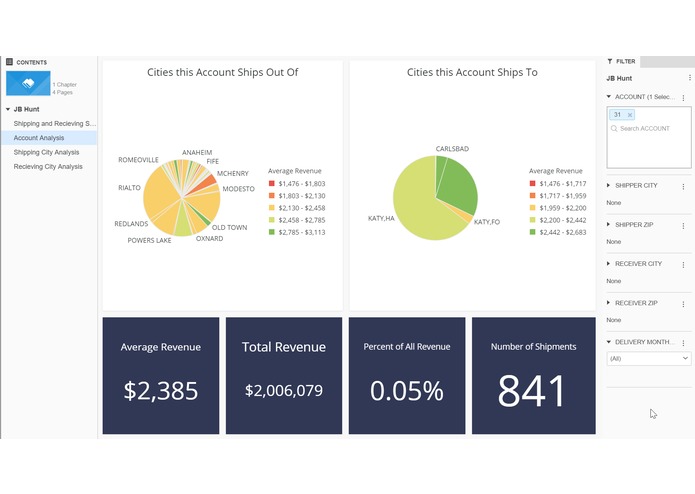
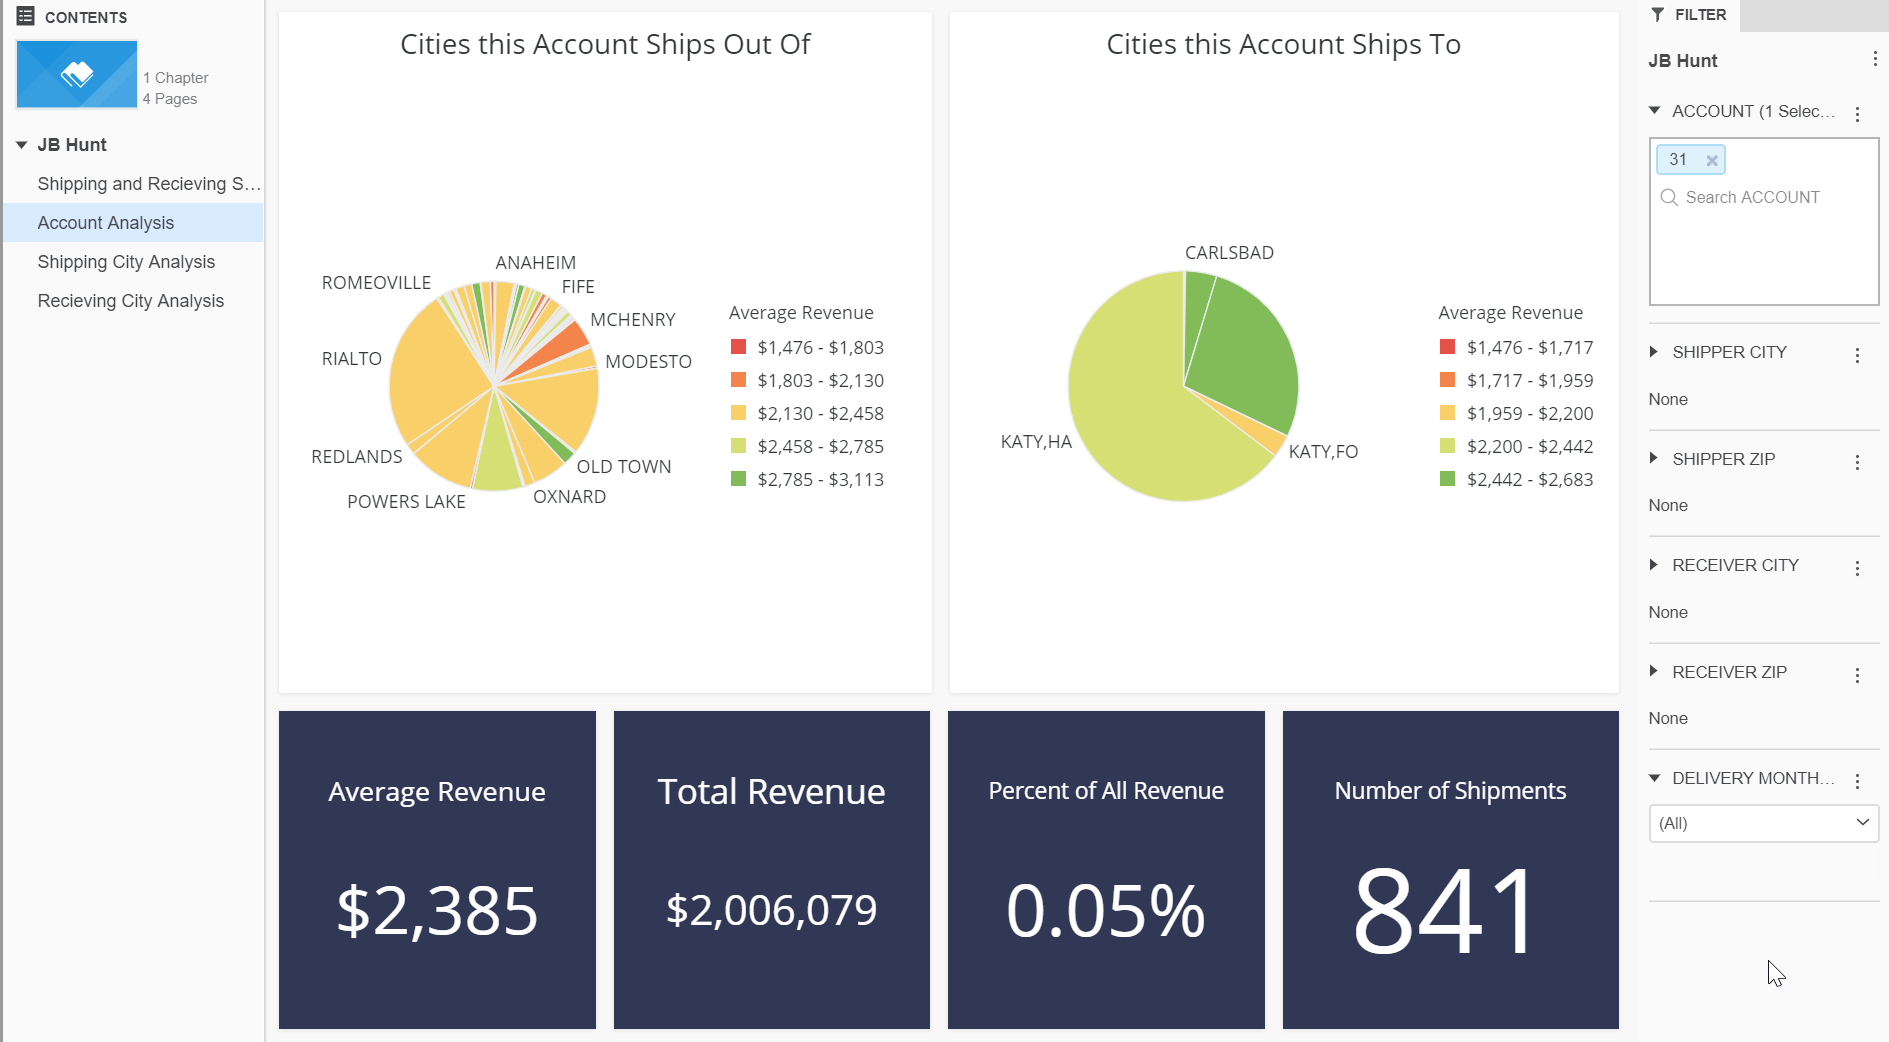
Analysis of a particular account.
-
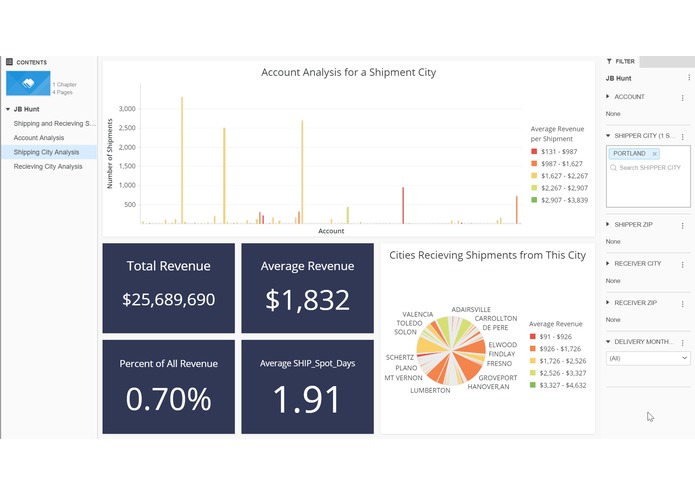
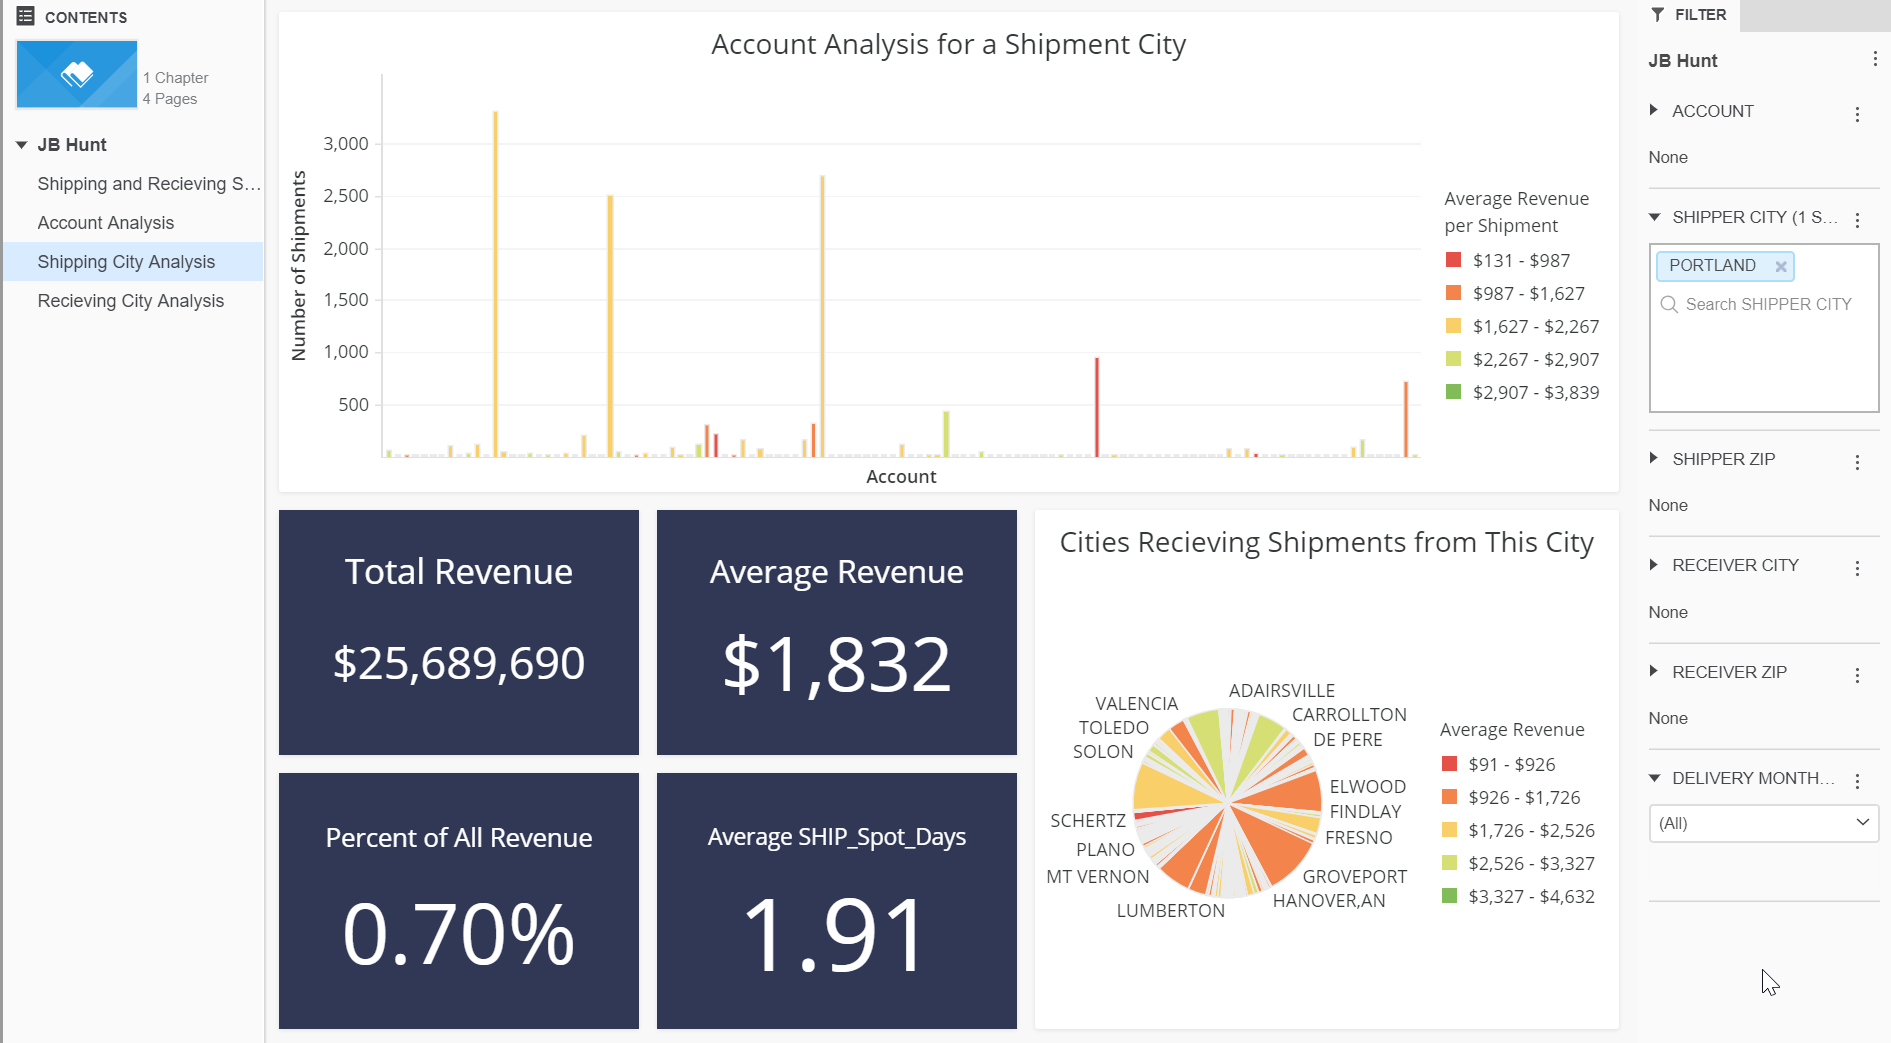
Analysis of a particular shipping city.
Inspiration
JB Hunt had an API for retrieving data and Microstrategy had tools to analyze data. We simply put the two together to made a tool to help JB Hunt analyze current shipping routes and find more efficient routes.
What it does
Gives a shipping company more insight into shipping routes allowing them to make better decisions for the company. Allows the user to go through and make a route of 5 cities, showing them information about the city and allowing them to pick the next city along the route. Lastly, we have a multi-threaded solution to the travelling salesman problem that tries to find the most efficient route given certain parameters. The data visualization with Microstrategy can be viewed on the web and on a mobile app.
How I built it
Using python scripts to run much of the back end code for a lot of the data gathering, data cleaning, and for running the algorithms of the modules using multi-threading. Using Microstrategy's tools to build a great look data visualization tool.
Challenges I ran into
Learning new technologies like Microstrategy's Dossier and debugging the python scripts and getting multi-threading to work in python.
Accomplishments that I'm proud of
Creating a great data analysis tool using data collected from an API and writing python scripts to connect it all.
What I learned
More experience with python and a bit more about data analysis and visualization. We also now know how to use Microstrategy's Dossier tool.
What's next for Shipping Route Analysis Tool (S.R.A.T)
We would've liked to have gotten a GUI for the two python scripts on the web page, so that is the obvious next step to get everything into a nice and neat website. Next we would have liked to use the Microstrategy Hyper Cards to give more information about the different Accounts in the JB Hunt data, but the account data was hidden from us by the API. Lastly maybe so improvements to the Python algorithms and some better data visualizations in our Dossier.


Log in or sign up for Devpost to join the conversation.