-
-
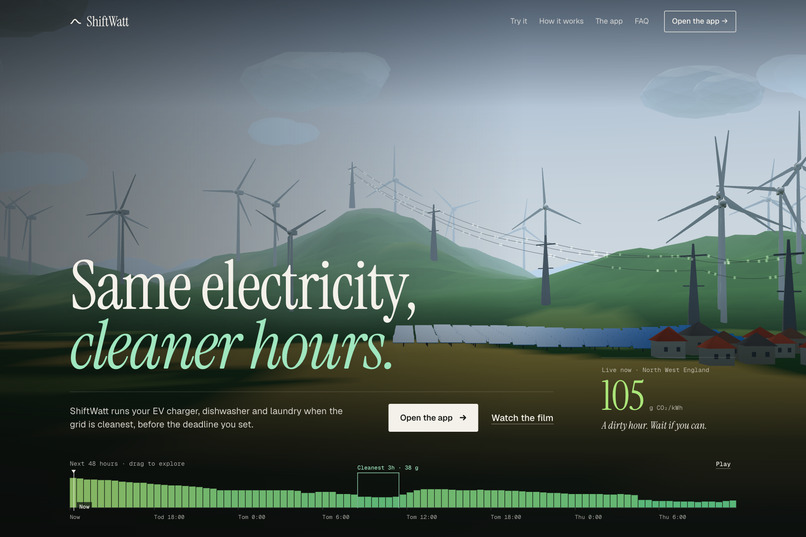
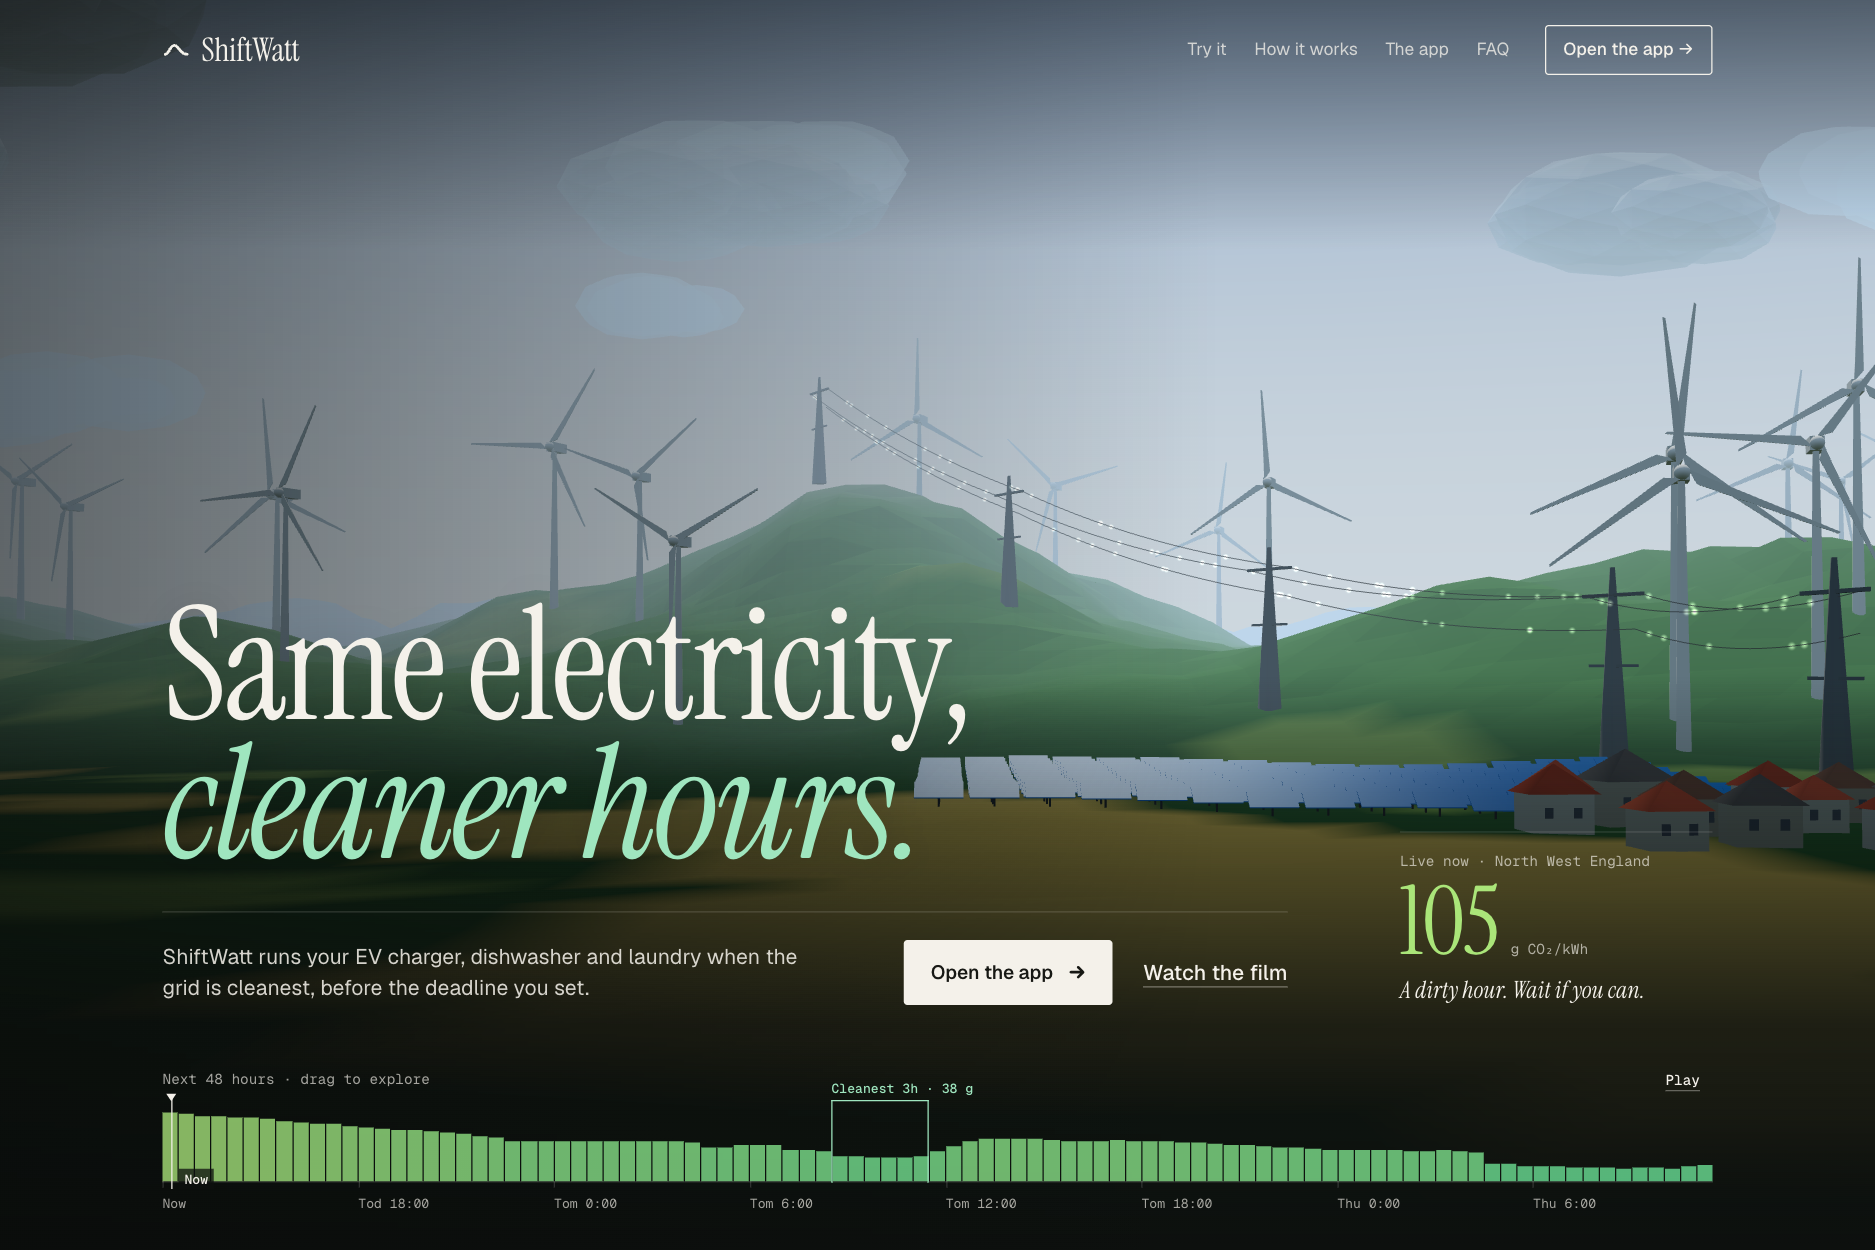
The website: a live 3D landscape drawn from the NESO 48-hour forecast. Drag the timeline and the scene follows the real grid.
-
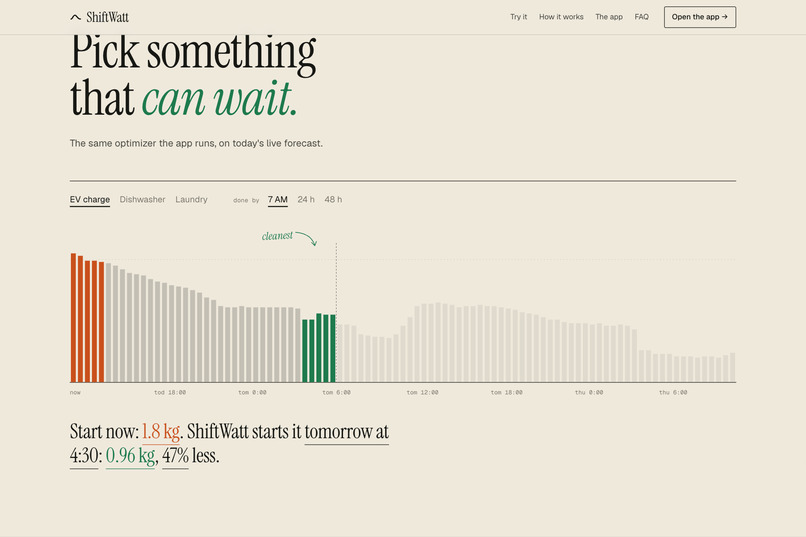
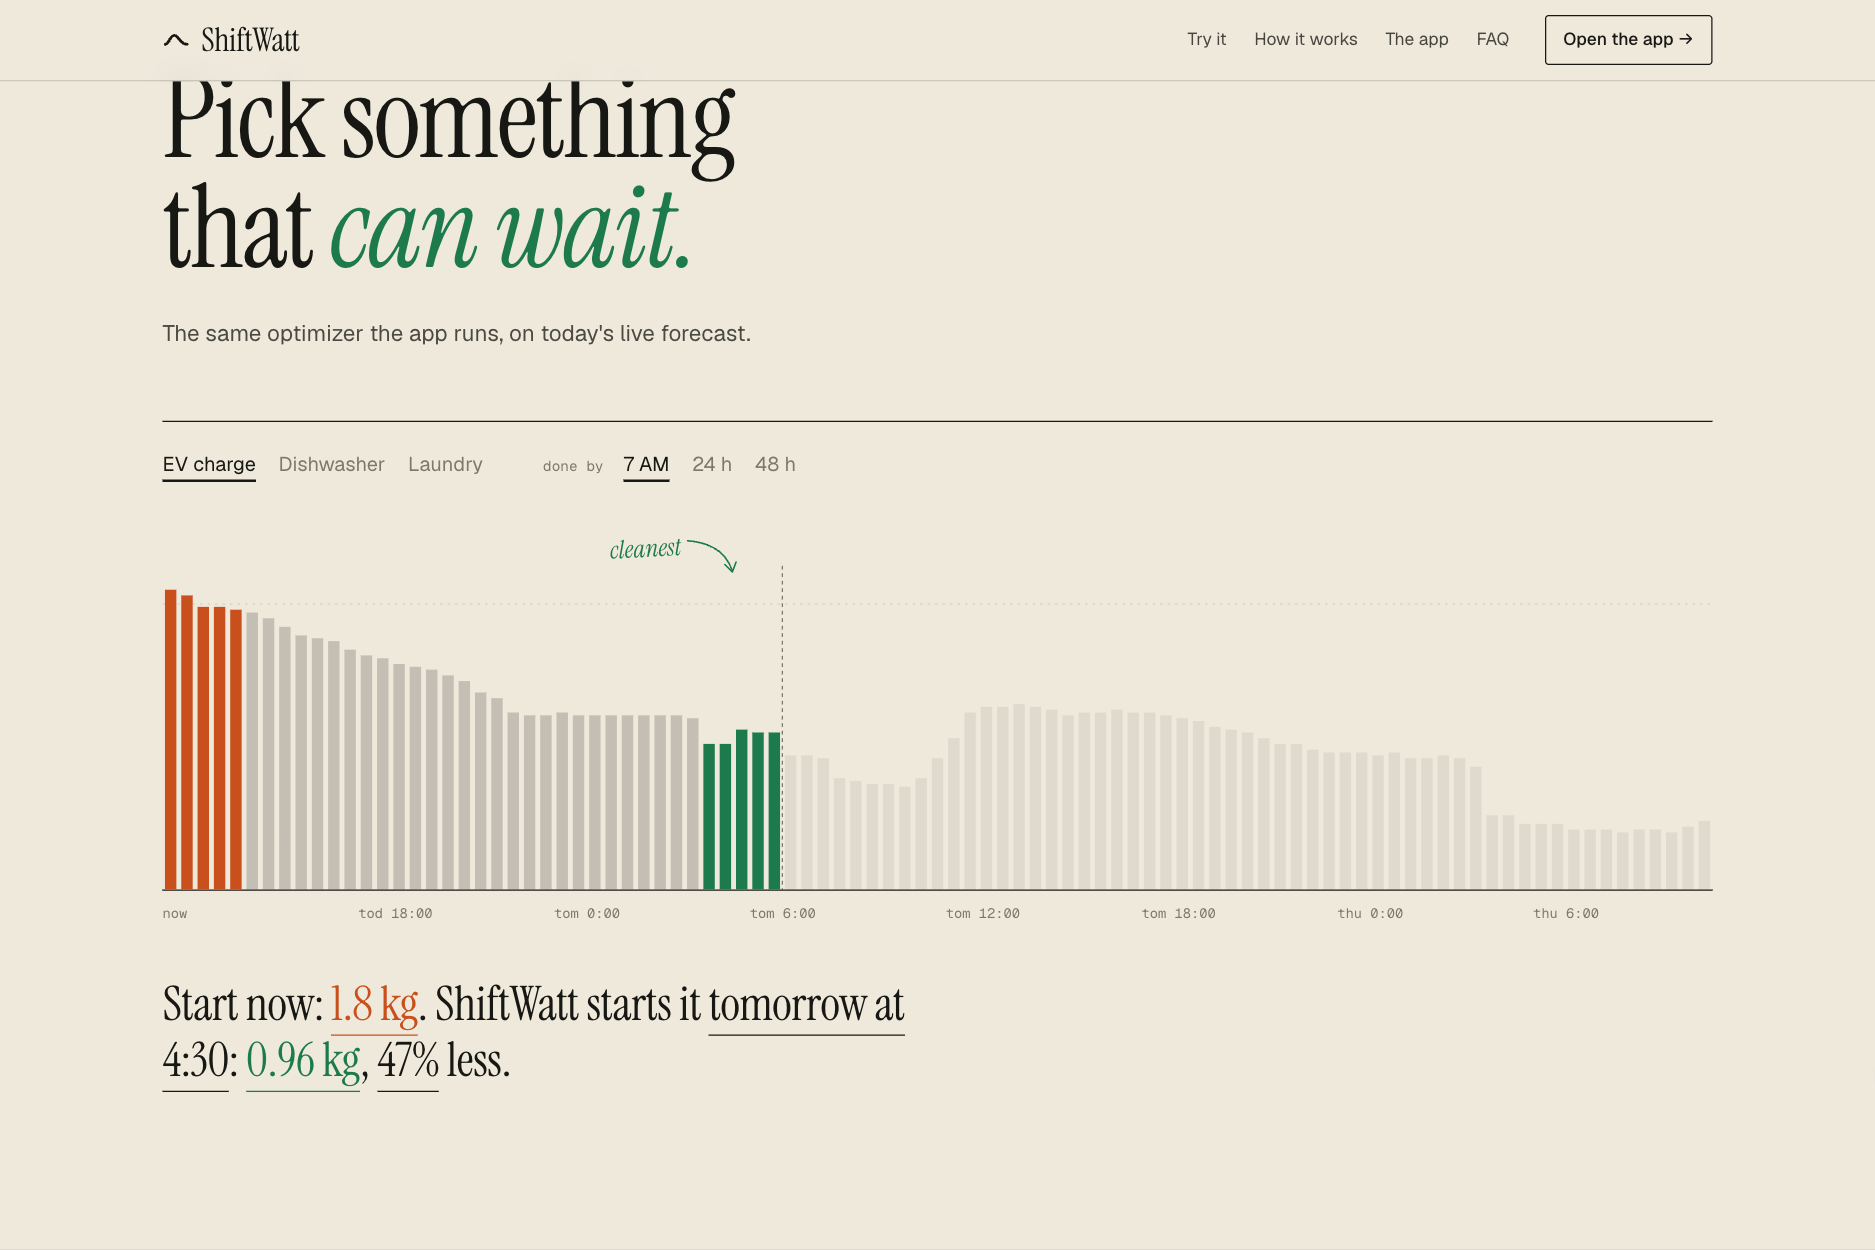
Try it on the live forecast: an EV charge started now vs. ShiftWatt's pick before 7 AM.
-
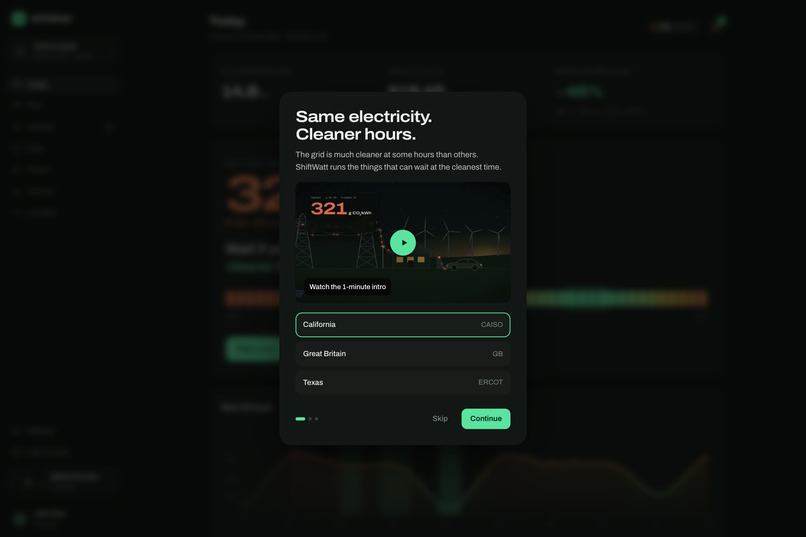
Today: the grid is dirty at the evening peak; ShiftWatt says when it gets 85% cleaner and what's already scheduled.
-
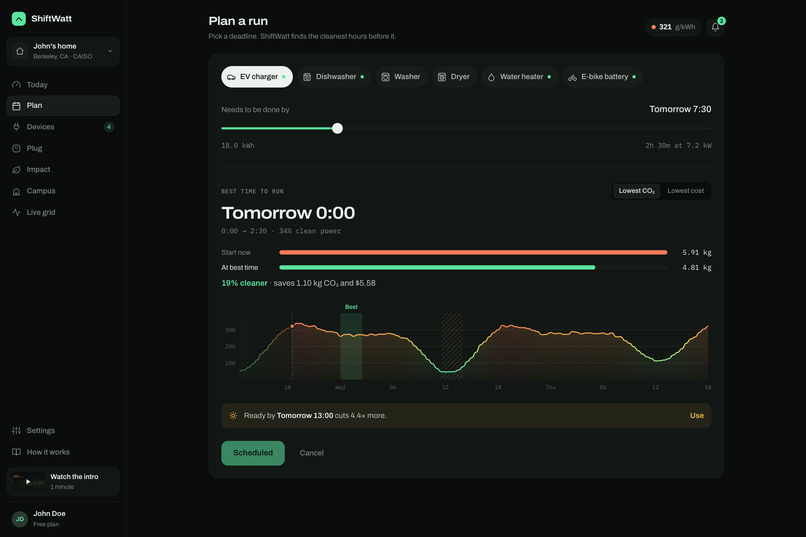
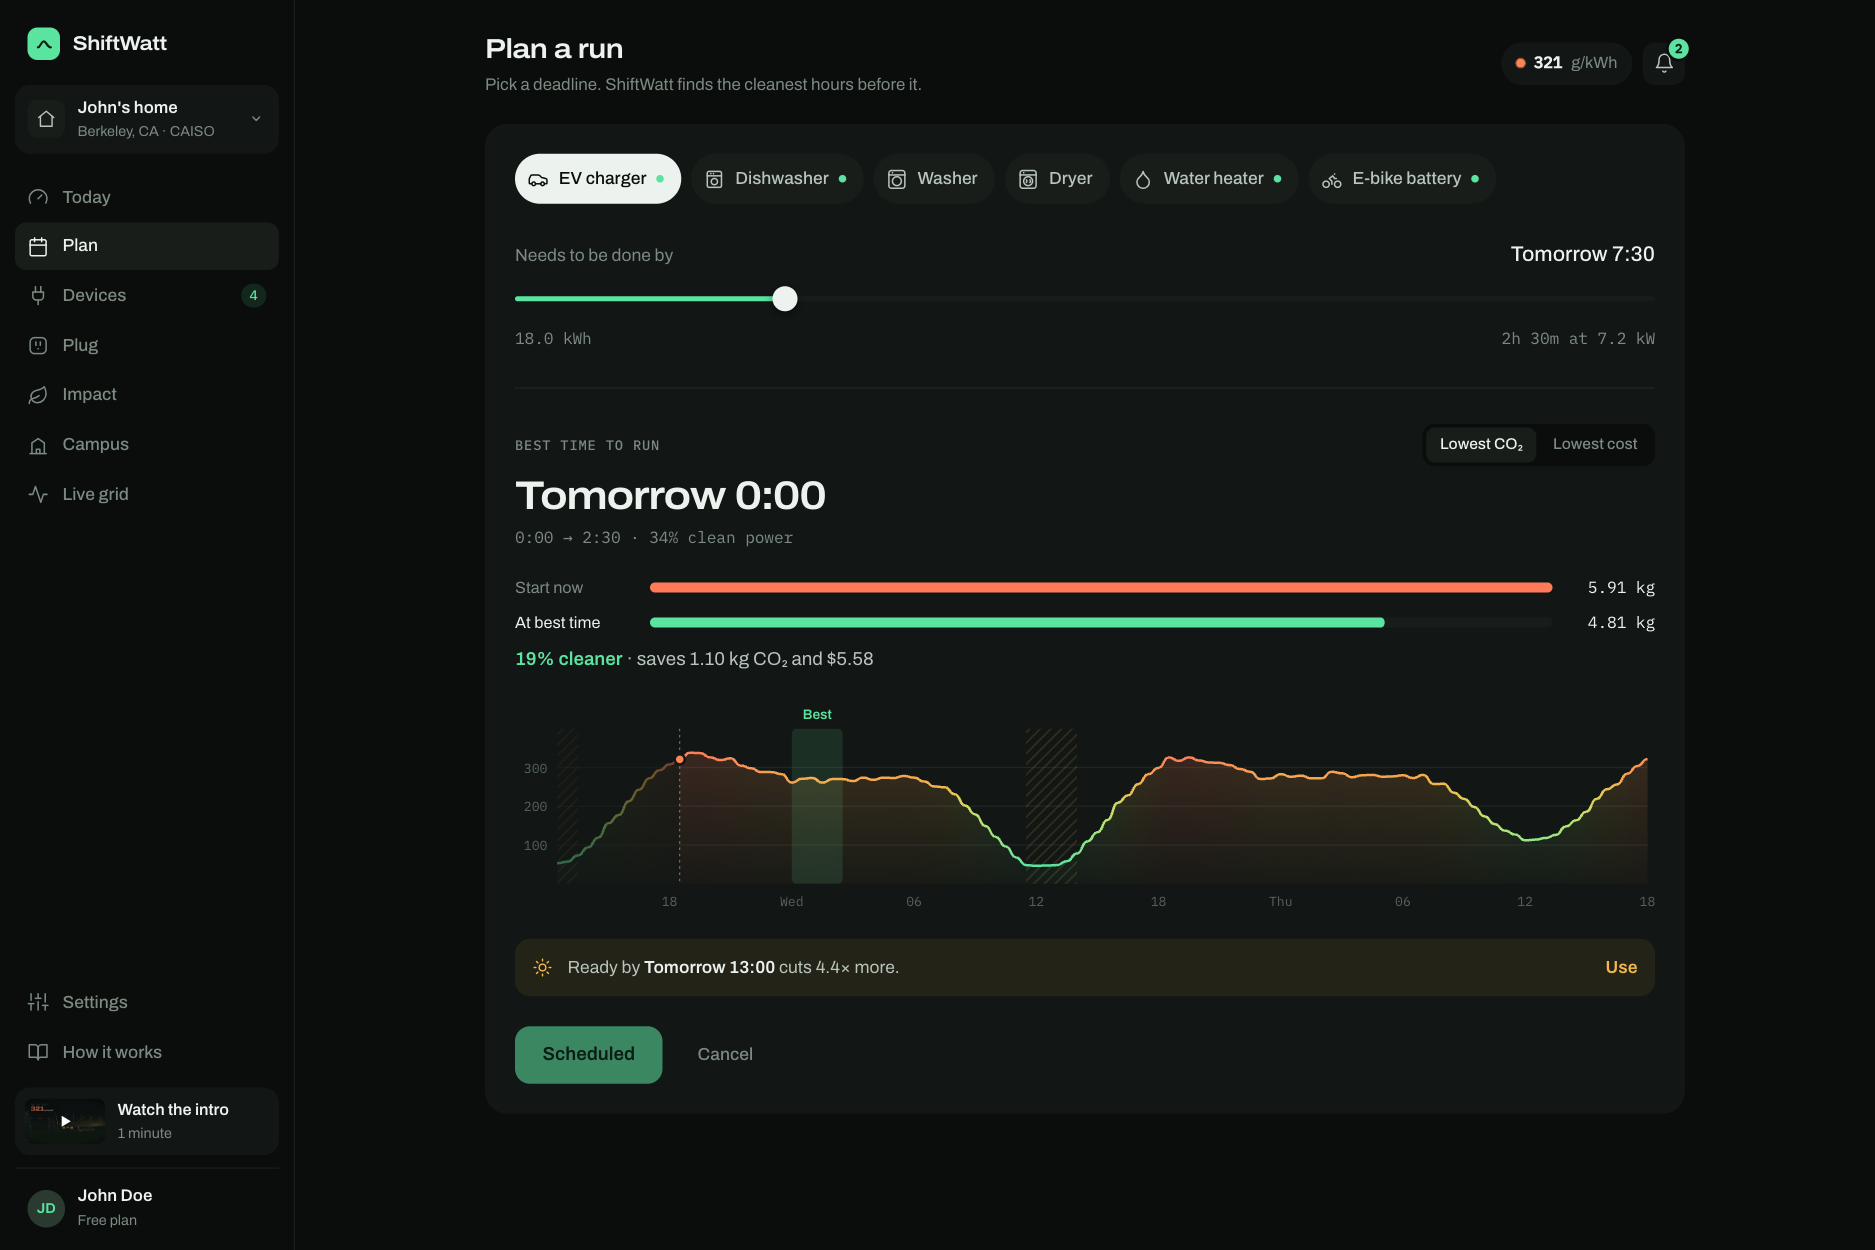
Plan: set a deadline; the EV charge drops from 5.91 kg to 1.10 kg CO₂ by running in the cleanest window.
-
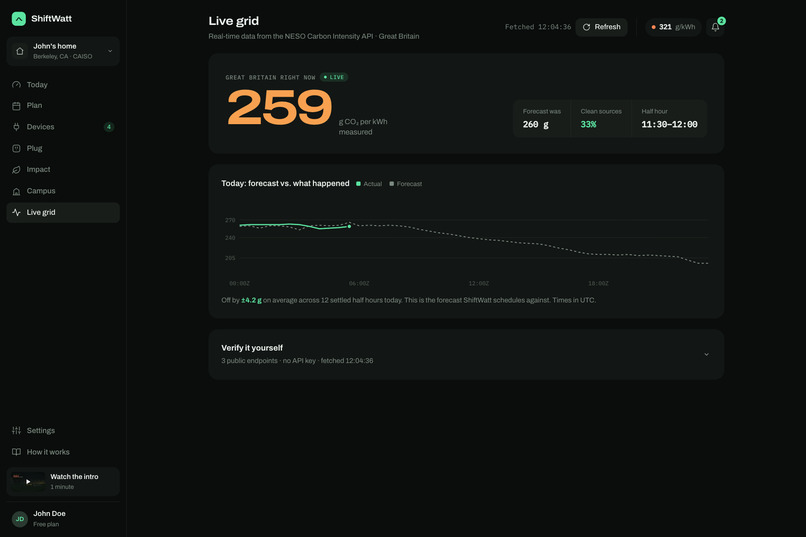
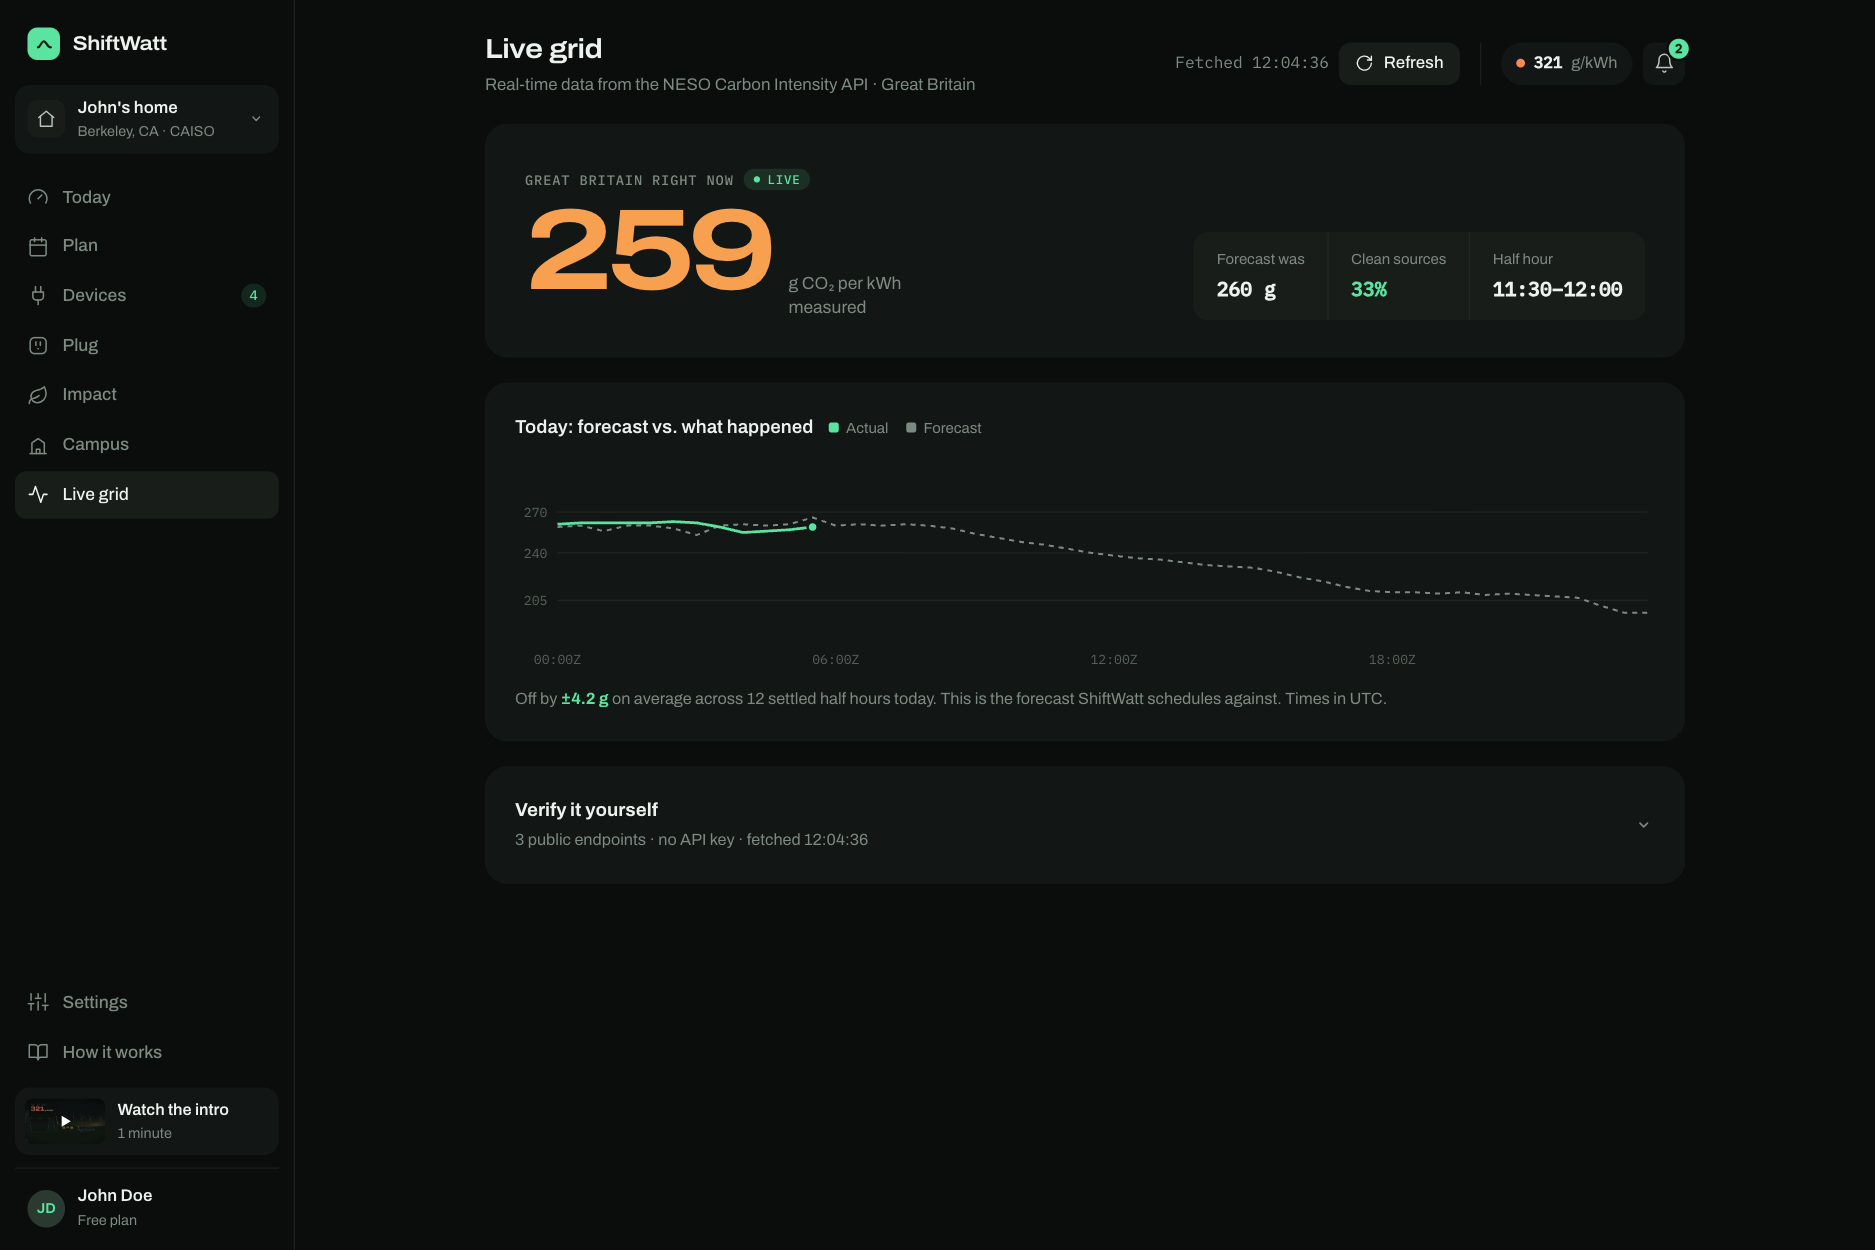
Live grid: real-time GB data from NESO. Measured vs. forecast, today's accuracy, and the raw requests anyone can check.
-
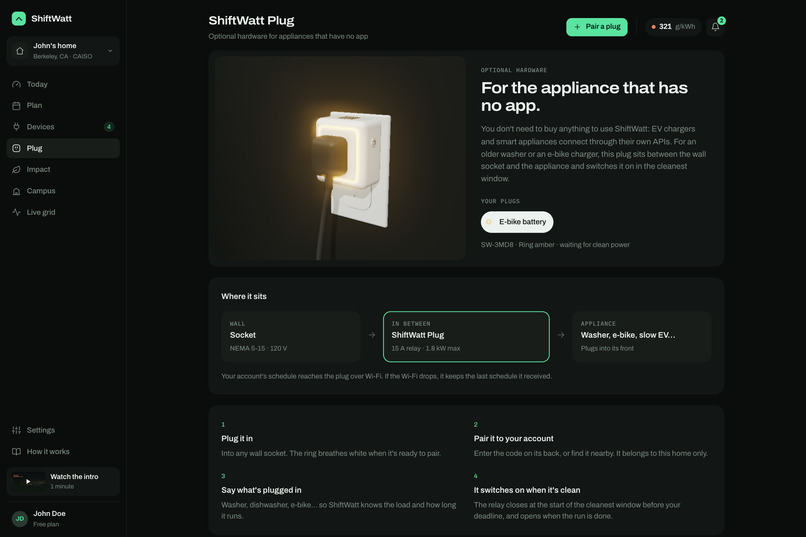
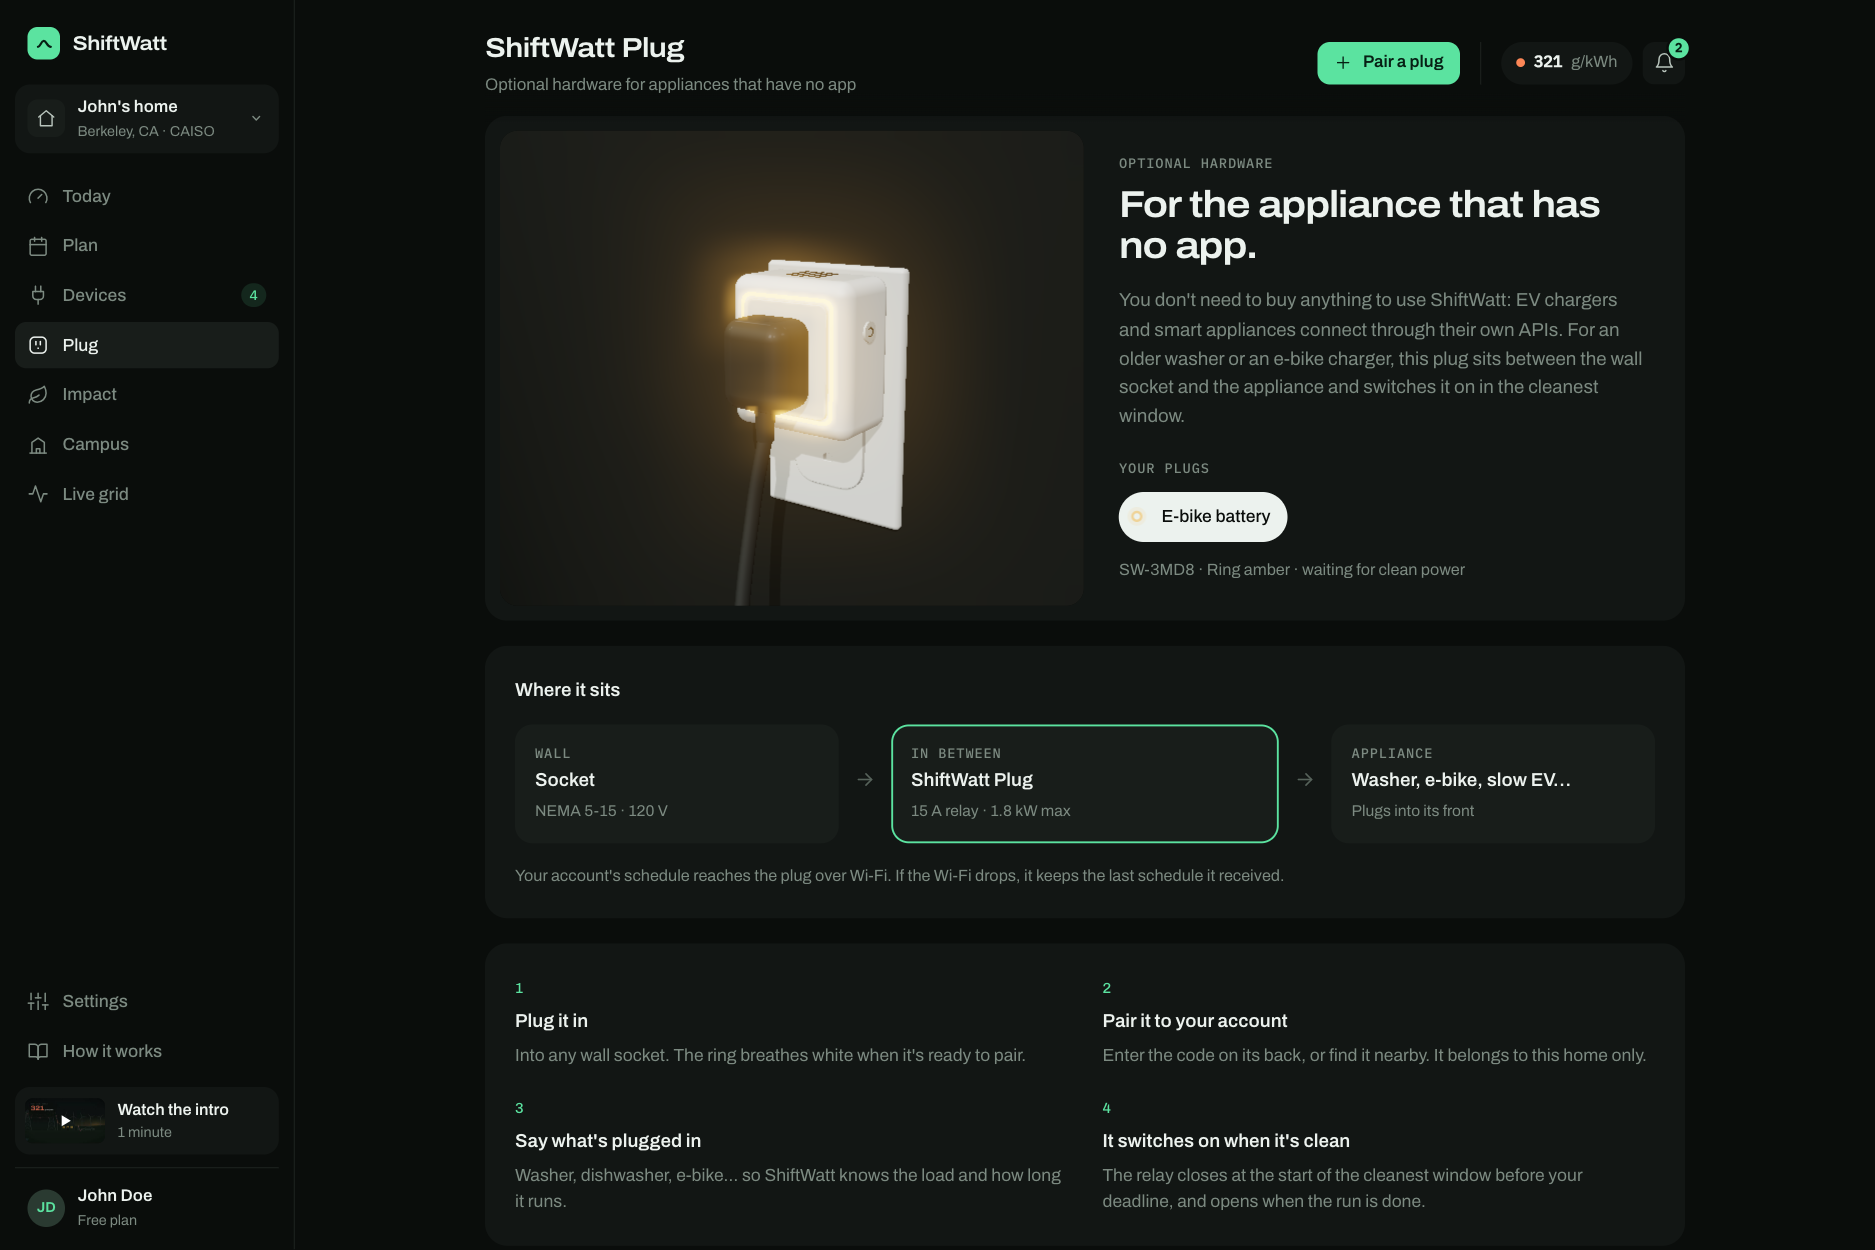
ShiftWatt Plug: optional hardware for appliances with no app. Its light ring shows when it's waiting for clean power.
-
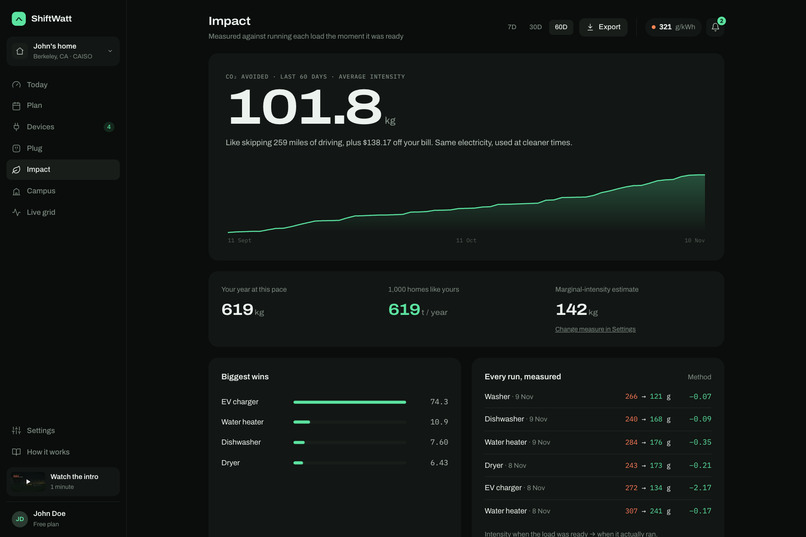
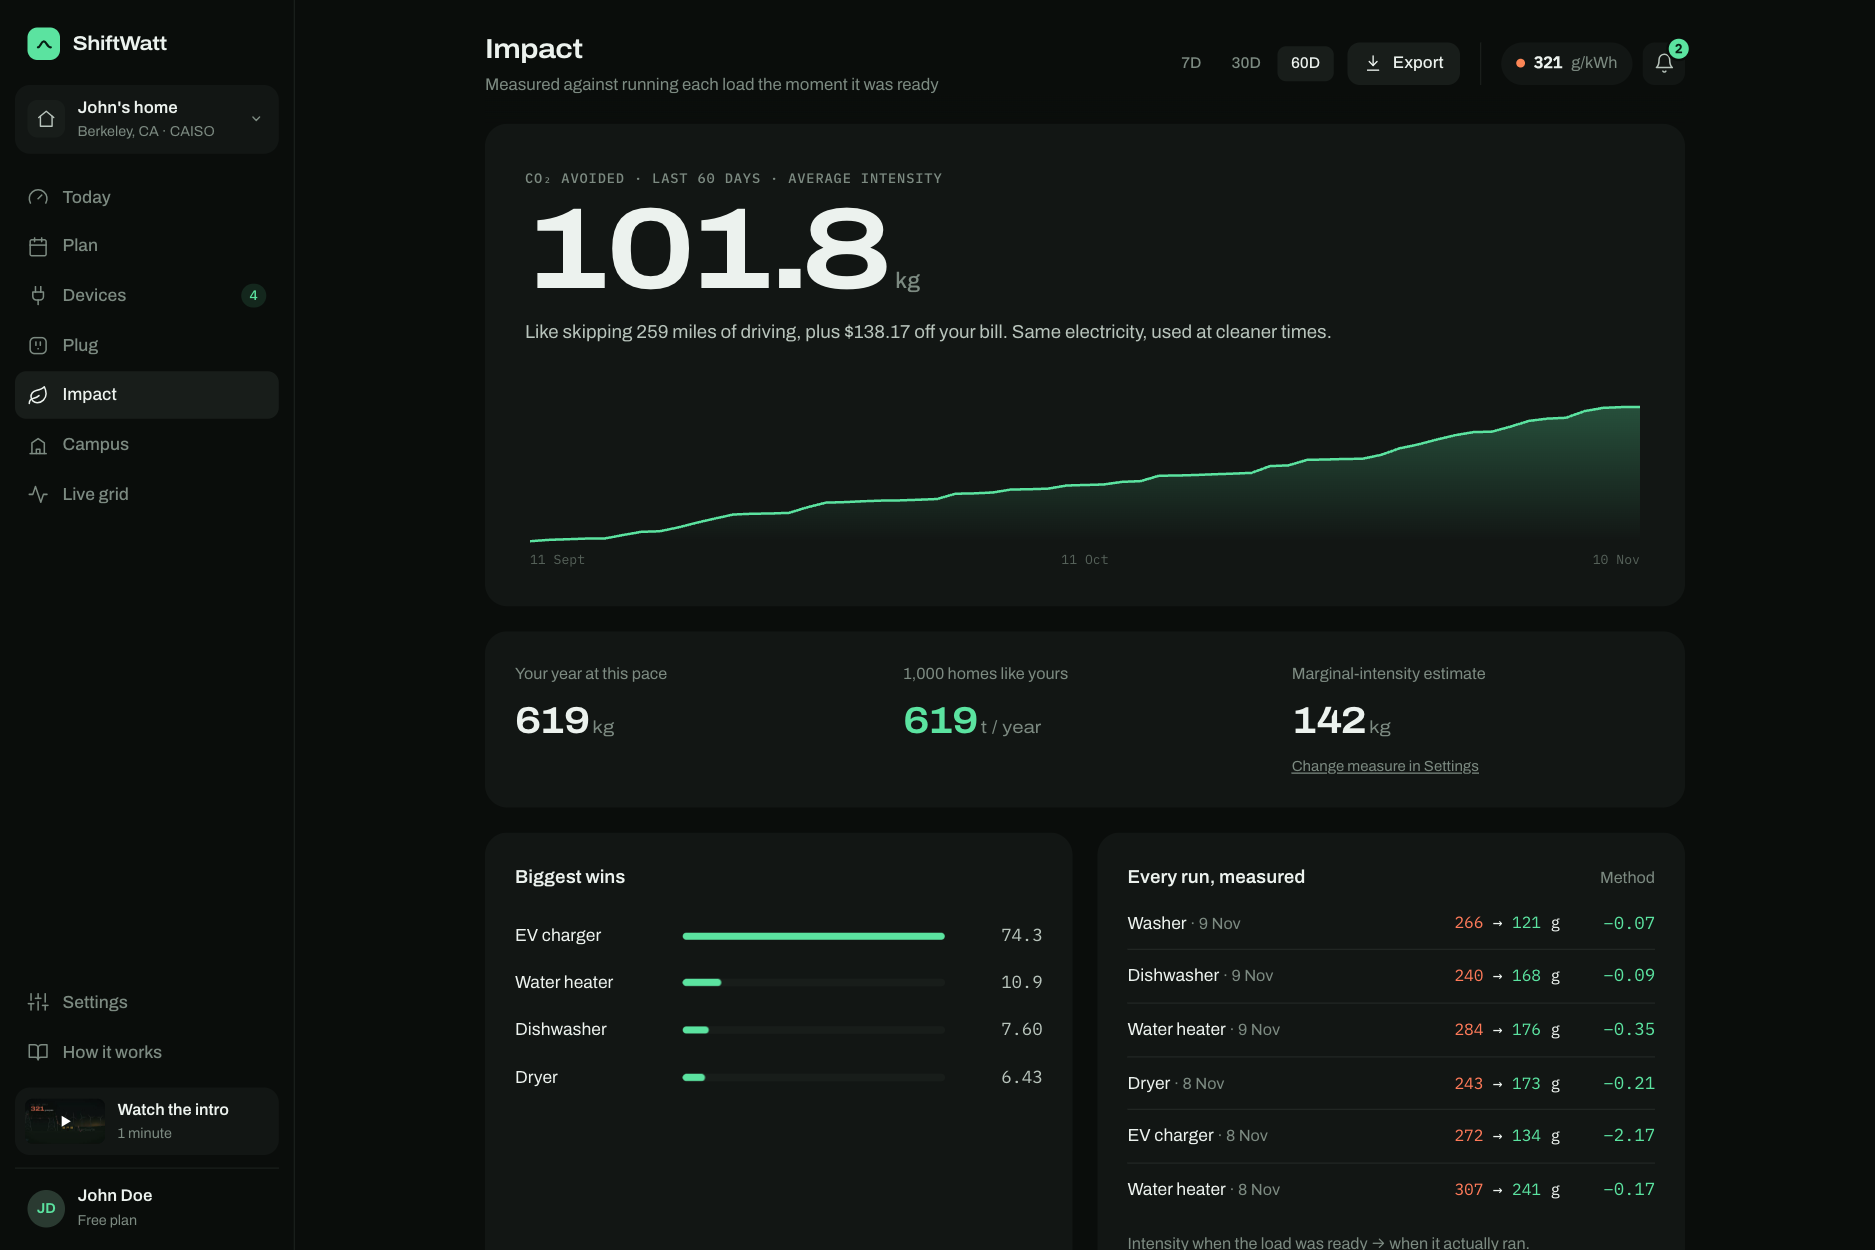
Impact: every run logged with intensity when ready vs. when it ran.
-
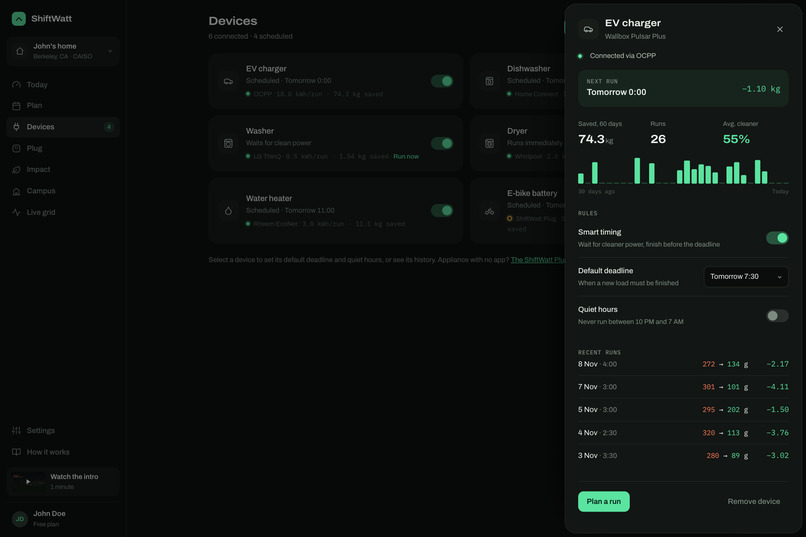
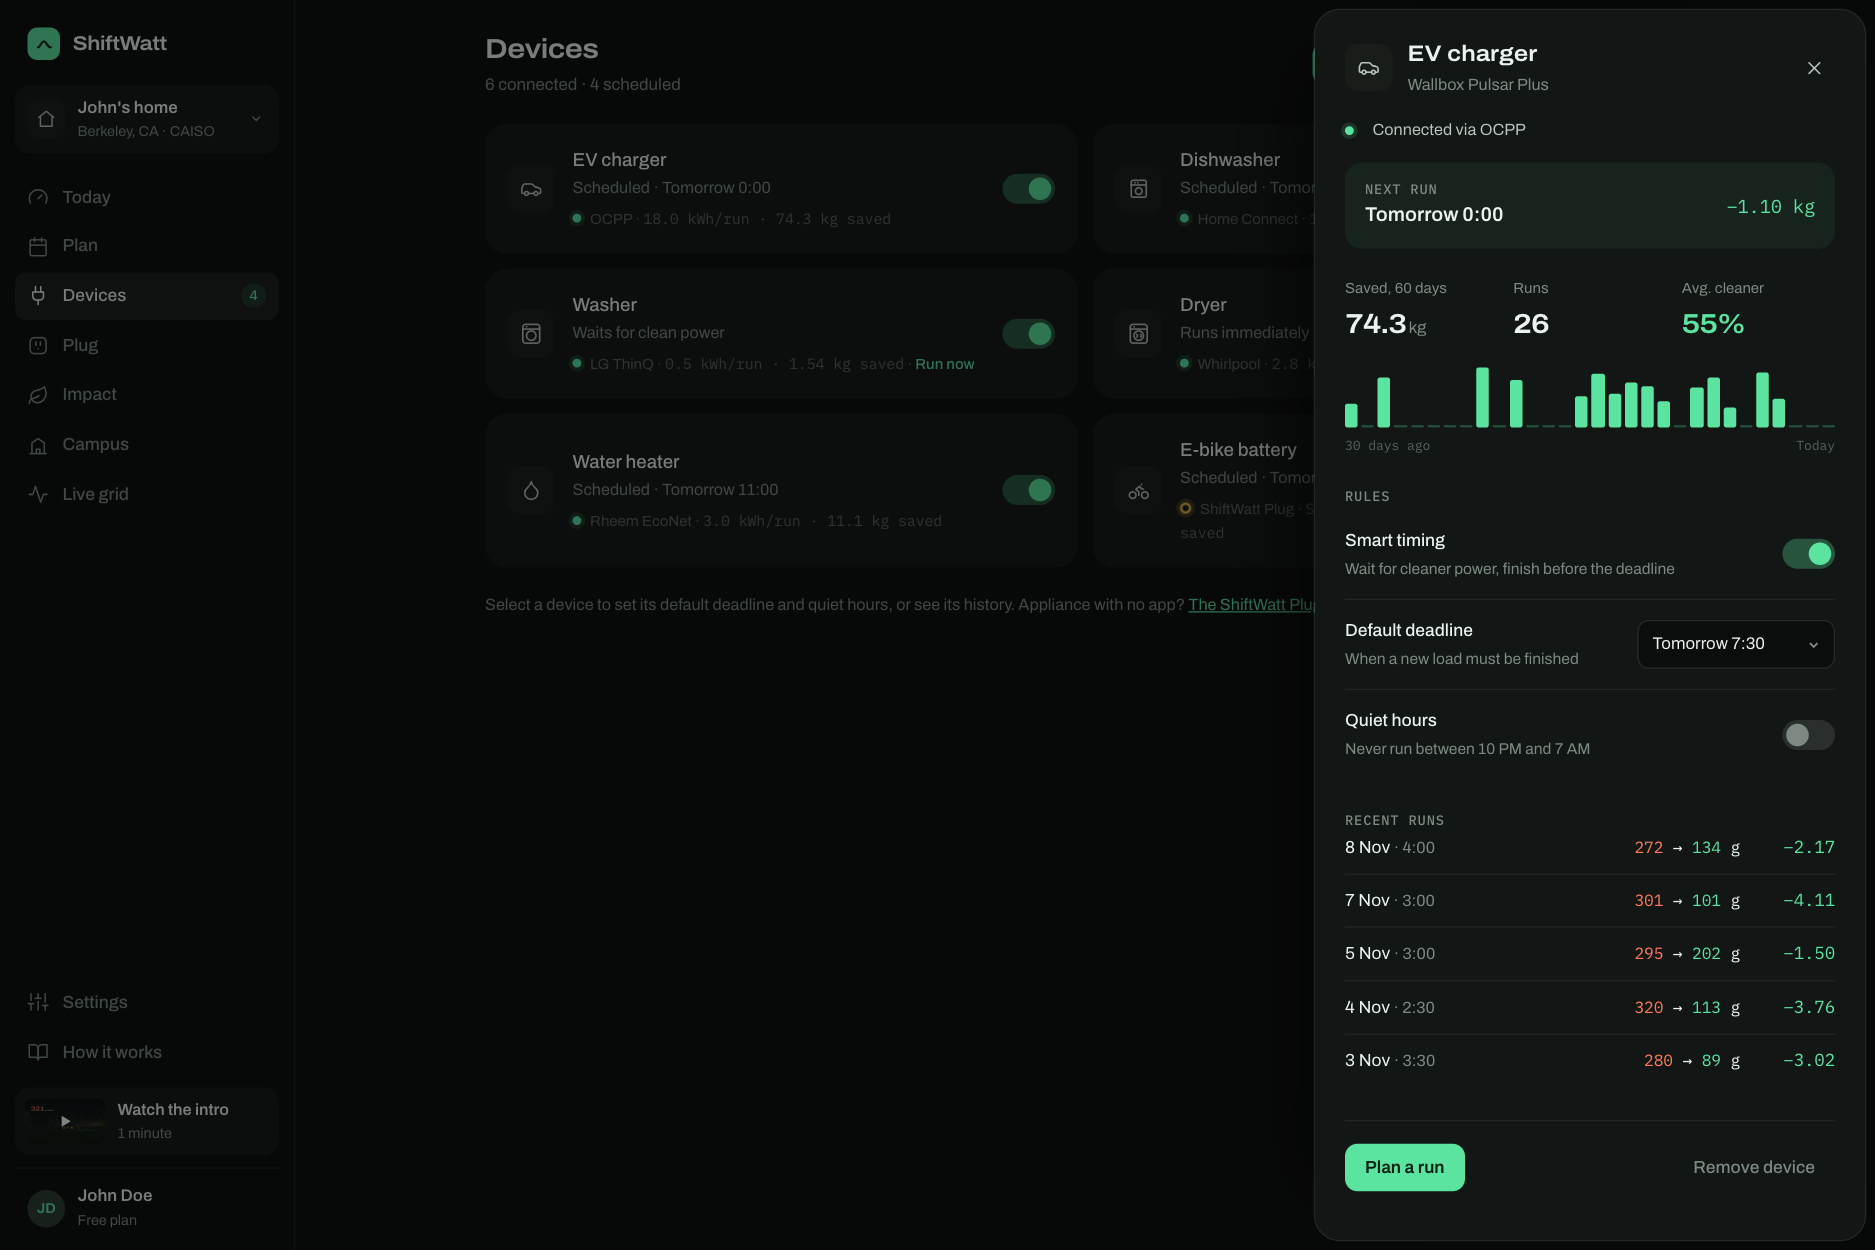
Device rules: default deadline, quiet hours and the device's run history.
-
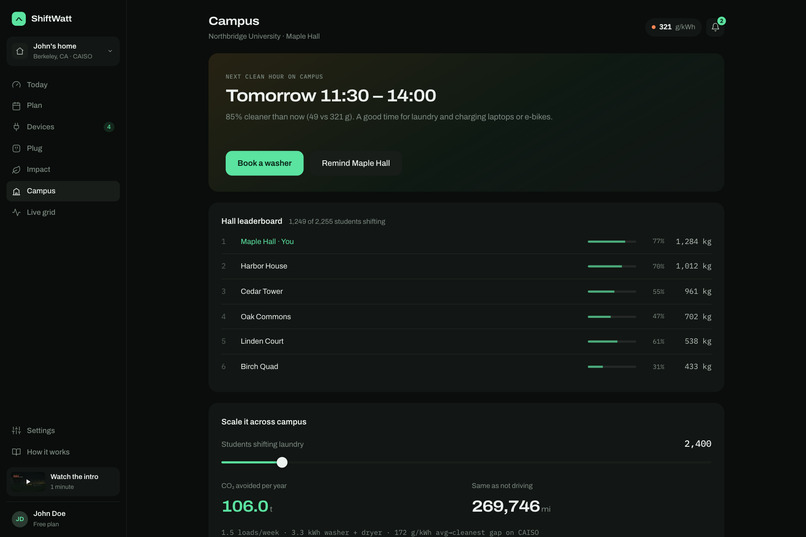
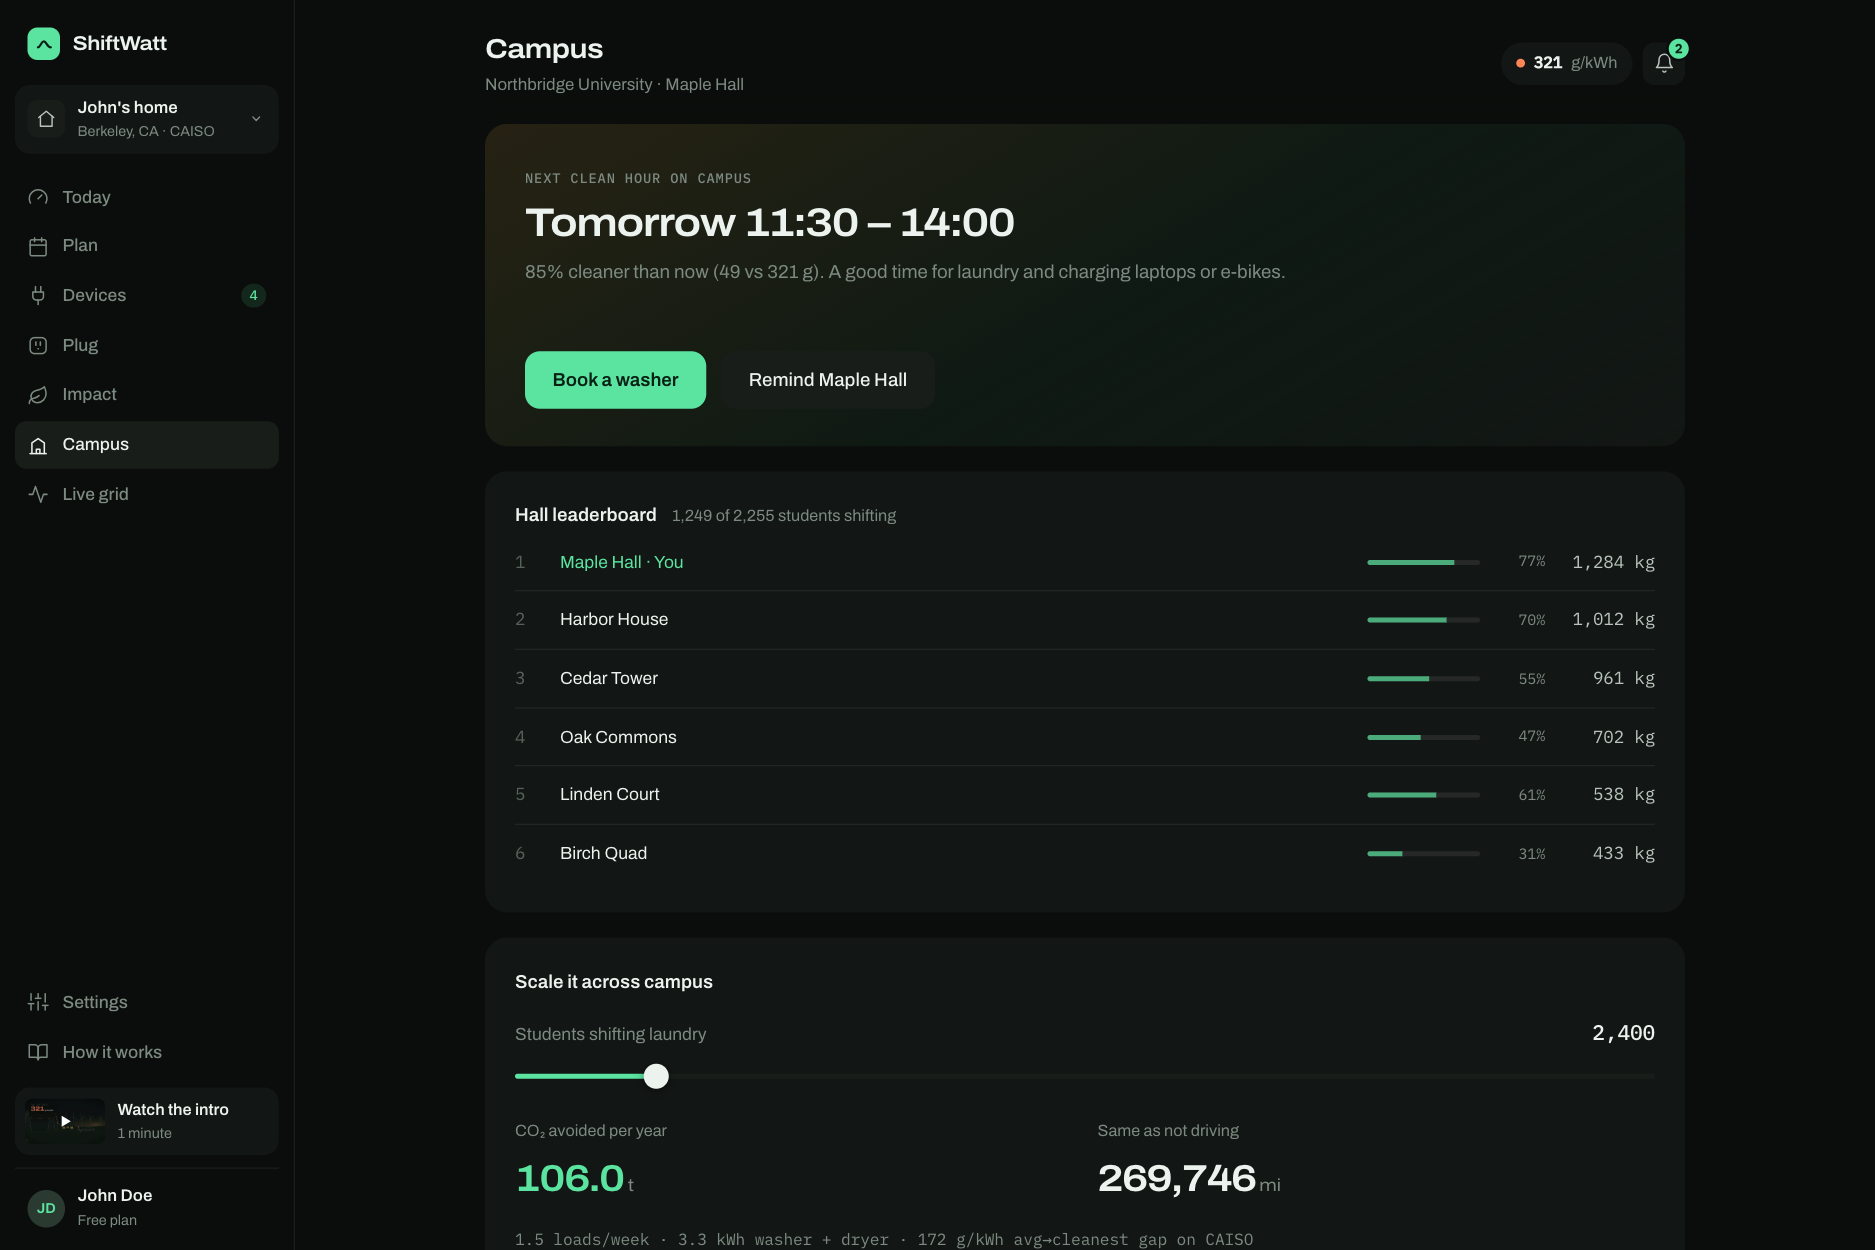
Campus: next clean hour, washer booking and a hall leaderboard.
Inspiration
A kilowatt-hour is not equally clean all day, or everywhere. On 4 November 2026 at 11:00 UTC, the UK grid operator's live data (NESO Carbon Intensity API) showed electricity in North Scotland at 0 g CO₂/kWh and South Wales at 329 g, in the same half hour. In California, midday solar now regularly exceeds demand: in 2024 CAISO curtailed 3.4 million MWh of wind and solar, 93% of it solar (U.S. EIA). That clean power was thrown away because nobody was using it at the right time.
Yet the biggest loads in a home, like EV charging, dishwashers, laundry and water heating, start the moment someone presses the button, often at the evening peak when gas plants are running. Those loads don't need to run now. They need to be done by a certain time. That gap is the opportunity I built ShiftWatt around.
What it does
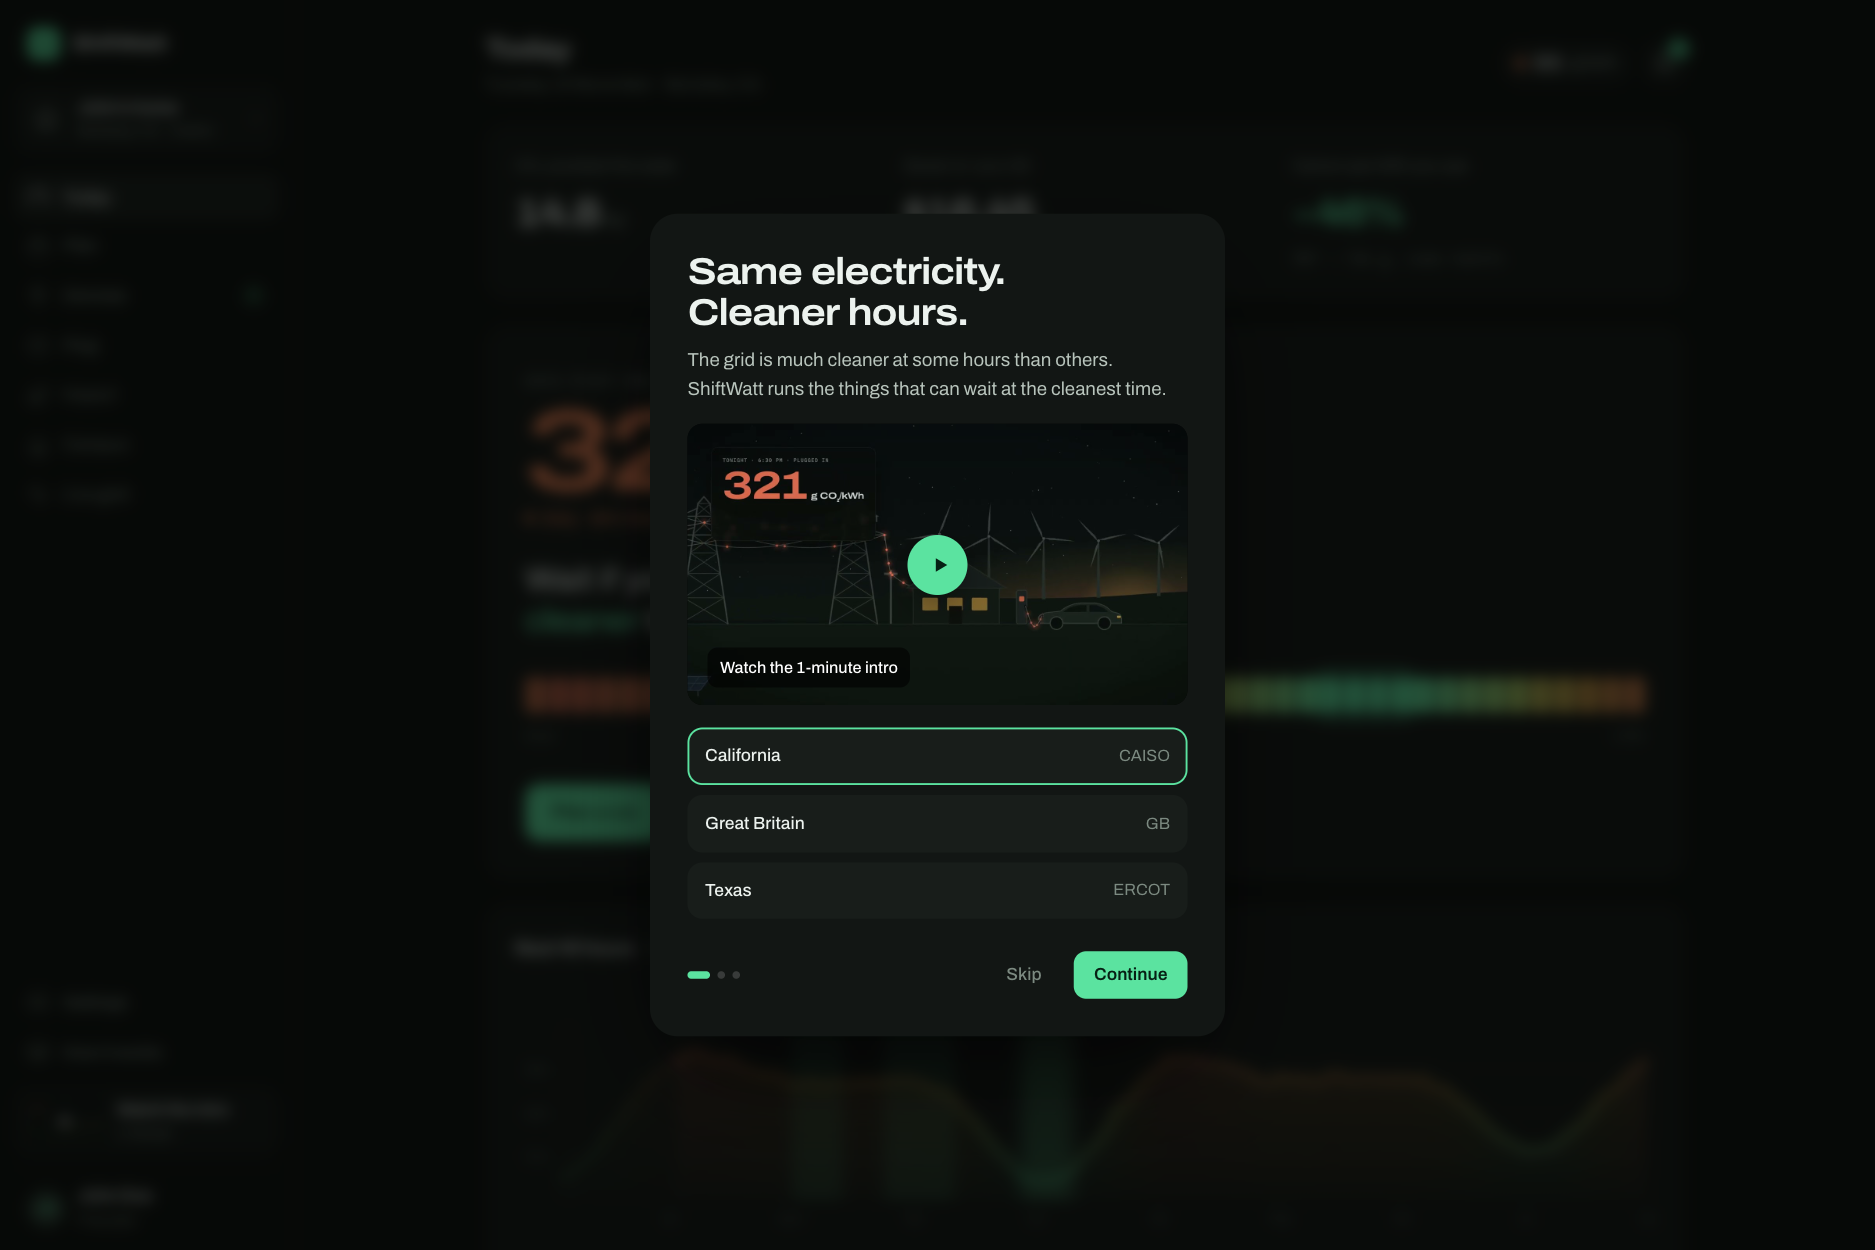
ShiftWatt reads the grid's carbon forecast and runs flexible loads in the cleanest window before your deadline. You set "done by"; it picks the hour. It works with the chargers and appliances people already own.
The website (shiftwatt.vercel.app) opens on a live 3D landscape of wind turbines, a solar farm and a village on the grid, drawn in the browser from the real 48-hour NESO forecast for North West England. Drag the timeline and the scene follows that half hour: time of day, how fast the turbines turn, how hazy the air is, and the colour of the power flowing into the homes (green when clean, orange when dirty). Further down, visitors can try the optimizer on the live forecast: pick an EV charge, dishwasher or laundry and a deadline, and see "start now" next to ShiftWatt's pick in kilograms of CO₂.
The app:
- Today: current grid intensity, a 24-hour clean-to-dirty strip, the 48-hour forecast with your scheduled runs, and the generation mix now vs. at the cleanest hour, so the advice explains why.
- Plan: pick a device and a deadline. ShiftWatt checks every possible start time and shows start now vs. best time in kg CO₂ (EV example: 5.91 kg → 1.10 kg, 81% cleaner, also cheaper). If a slightly later deadline would multiply the savings, it says so: "Ready by tomorrow 1 PM cuts 4.4× more." You can optimise for lowest CO₂ or lowest cost.
- Devices: smart timing per device, default deadlines, and quiet hours (never run 10 PM–7 AM), which the optimizer treats as a hard constraint. Pressing "Run now" shows the CO₂ cost of not waiting and offers to wait instead.
- ShiftWatt Plug (optional): for an appliance that has no app, a smart plug sits between the wall socket and the appliance and switches it on in the clean window. The app shows it as an interactive 3D model, walks through pairing (enter the code on the plug, say what's plugged in), and shows each plug's light ring: amber while waiting for clean power, green while running. Nobody needs to buy it to use ShiftWatt.
- Impact: every run is logged with grid intensity when it was ready vs. when it ran, over 7, 30 or 60 days, with a CSV export.
- Live grid: real-time Great Britain data straight from the NESO Carbon Intensity API, with no API key. It shows national intensity (measured vs. forecast), today's forecast vs. what actually happened, and the raw request URLs and JSON so anyone can verify nothing is hard-coded.
- Campus: a "next clean hour" alert, washer booking that defaults to the cleanest slot, and a hall leaderboard. Shared dorm laundry is the easiest load to shift because it needs no hardware.
Who it's for
- Households with flexible loads, especially EV owners. In my model the EV is ~58% of a typical home's shiftable savings.
- Students in dorms. Shared laundry rooms can default bookings to clean hours with zero hardware.
- Campuses and utilities (next step): one "clean hour" nudge shifts many loads at once.
How I built it
- Live data. The NESO Carbon Intensity API (free, keyless) provides a 48-hour regional forecast with the generation mix every 30 minutes; I use North West England. If the API is unreachable, the app falls back to modeled data and labels it Modeled on screen.
- Modeled grids. California and Texas use curves computed from a modeled generation mix (share × emission factor per source), so intensity, price and surplus stay physically consistent. Their free forecast sources need accounts, so I label them as modeled rather than fake "live".
- Optimizer. An exhaustive sliding-window search over 30-minute slots between now and the deadline. It minimises mean carbon intensity (or price), respects constraints like quiet hours, and suggests a later deadline when that improves savings by at least 1.5×. The website's "try it" section runs the same search on the live forecast.
- 3D. three.js (WebGL). The landing landscape is fully procedural: terrain from layered noise, instanced turbines, solar panels and houses, a shader sky with a sun and stars, and energy pulses along the power lines. The wind and solar share of each forecast half hour drive the turbines and panels. It only renders while on screen and falls back to a painted sky without WebGL. The ShiftWatt Plug is a modeled US (NEMA 5-15) and UK (BS 1363) adapter with a glowing status ring.
- App and site. Dependency-free HTML, CSS and JavaScript with hand-built SVG charts and localStorage persistence: no framework, no build step, no paid services.
- Video. Remotion (React) with hand-built animated grid scenes. On the website it plays as a muted preview and switches to the full player with sound on click.
Expected environmental benefit
Per run:
CO₂ saved (kg) = kWh × (g CO₂/kWh when ready − g CO₂/kWh when run) ÷ 1000
The baseline is "start the moment the load is ready", which is what people already do. I never compare against the single worst hour.
Per household per year, estimated from typical runs per week × kWh × the gap between the average hour and the cleanest 3-hour window, conservatively assuming the best window is hit only 60% of the time:
| Grid | Average → cleanest gap | With an EV | Without an EV |
|---|---|---|---|
| California (modeled) | 172 g/kWh | ≈ 500 kg CO₂/yr | ≈ 210 kg CO₂/yr |
| Texas (modeled) | 70 g/kWh | ≈ 200 kg CO₂/yr | ≈ 85 kg CO₂/yr |
500 kg is roughly 1,270 miles of gas-car driving (EPA: 0.393 kg CO₂ per mile), with no new hardware and no change of routine.
Campus scale: 2,400 students shifting 1.5 laundry loads a week (3.3 kWh washer + dryer) on the California curve ≈ 106 t CO₂ per year.
Beyond CO₂: shifted demand flattens the evening peak served by gas peaker plants, and soaks up midday solar that would otherwise be curtailed.
I report the conservative number. Savings are headlined using average grid intensity. Marginal emissions (the plant that actually ramps up for your load) are usually higher; the app shows both and lets you switch.
Challenges I ran into
- An honest baseline. Comparing against the dirtiest hour would triple my numbers, and it would be misleading. I compare against "run it when it's ready".
- Average vs. marginal emissions disagree. Rather than pick the flattering one, I show both and default to the lower.
- Free live data is uneven. Only Great Britain has a free, keyless forecast, so I built a clean live/modeled split with a visible label and an automatic fallback.
- Making a forecast feel real. A chart of grams per kWh doesn't move people. Turning the same numbers into a landscape you can scrub through, where the turbines slow down and the air turns hazy in dirty hours, does.
- Hardware without making people buy hardware. The plug had to exist for appliances with no app, without implying anyone needs one. It lives as an optional path; everything else works through the APIs people already have.
- Explaining without overwhelming. Every screen is cut to one question, one answer and one action.
Accomplishments I'm proud of
- A website hero that is the data: every frame of the landscape comes from the live NESO forecast.
- A live forecast that's verifiable from inside the app: request URLs plus raw JSON.
- The forecast held up when tested. On 4 November it was off by under ±7 g on average across the settled half-hours, against a national reading of around 155–160 g.
- The flexibility tip shows people what one extra hour of slack is worth, which turns "be green" into a concrete trade.
- An auditable ledger: every saving traces back to two intensity readings.
What I learned
- When you use electricity can matter as much as how much, and the gap is getting wider as more solar and wind come online.
- People won't watch a grid chart, but they will answer "when does this need to be done?"
- Trust comes from showing your work: sources, baselines and limits on the same screen as the numbers.
Limitations
- Device control is simulated. The app shows the integrations a production build would use (OCPP for EV chargers, Home Connect, LG ThinQ, Rheem EcoNet), and the ShiftWatt Plug is a hardware design shown in 3D.
- California and Texas forecasts are modeled; Great Britain is live.
- The 60-day household history and the campus figures are sample data, there to show the experience.
- Times display in the viewer's local time zone, including for the live GB forecast.
- Shifting lowers carbon per kWh, not kWh used. At large scale, many homes chasing the same hour would create a new peak, so production would stagger starts and use marginal signals.
What's next
- Live US data via WattTime (marginal) or Electricity Maps.
- Real control, starting with OCPP smart charging (the biggest load), then appliance delay-start APIs.
- A working ShiftWatt Plug prototype on a microcontroller with a relay and a status LED.
- A pilot with one dorm laundry room, measuring shifted loads before and after.
