Inspiration
Toronto is currently experiencing one of the most severe homelessness crises in Canada. The tools available to municipal planners typically show what is happening, for example, shelter occupancy or general homelessness counts but they do not answer where new shelters should be placed or which areas are most underserved.
Furthermore, encampment data, shelter availability, and geospatial patterns are often dispersed across multiple incomplete datasets. We wanted to build something that unifies these datasets and provides actionable, data-driven, and map-based insights that can meaningfully support:
- Urban planners
- City officials
- Community organizations
- Emergency responders
- Social service agencies
ShelterMap Toronto was created as a project dedicated to using data science for social good, aligned with
- UN SDG 11 : Sustainable Cities & Communities
- UN SDG 1 : No Poverty
Our guiding question:
How can we use real data, geospatial analysis, and clustering algorithms to identify where new shelters would have the greatest impact?
What It Does
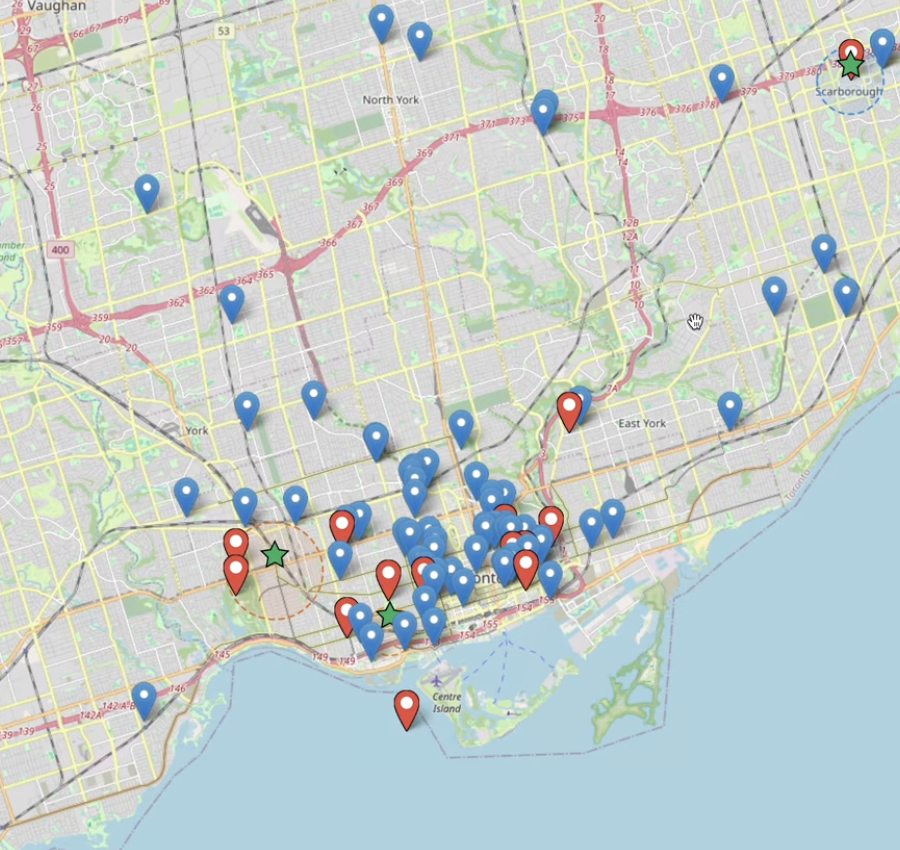
ShelterMap Toronto is a comprehensive geospatial decision-support tool that integrates multiple data sources into a unified platform.
Key Features
- Shelter Layer
- Shows the locations of existing shelters across Toronto
- Displays capacity, occupancy, utilization rate, and type
- Allows filtering and comparative analysis of service coverage
- Encampment Layer
- Includes a custom dataset of encampment hotspots across Toronto
- Uses geocoded coordinates to map locations such as parks, ravines, underpasses, and high-density intersections
- Severity Modeling
How We Built It
Data
We integrated several datasets, including:
- City of Toronto Shelter System Occupancy Dataset (2024)
- Required extensive cleaning due to missing bed-level data
- Custom Encampment Dataset (2025)
- Created using journalistic and public-source encampment reporting
- Fully geocoded and cleaned
- Street Needs Assessment (SNA) 2024
- Used for validating outdoor homelessness counts by district
- Geocoding via leaflet
- Used to convert encampment names into coordinates
- Includes caching to avoid repeated API calls
Backend (Python)
Implemented components include:
- Data ingestion and cleaning scripts
- Feature extraction
- Weighted clustering
- Geodesic distance calculations
- Export of processed data to BigQuery
We used: -pandas for cleaning
- numpy for vectorized calculations
- geopy for distances
- sklearn for clustering
- google-cloud-bigquery for database operations
Frontend (Next.js + React)
Frontend includes:
- Map rendered using React Leaflet
- Layer toggles for shelters, encampments, and recommendations
- API routes that fetch processed data from BigQuery
- Summaries optionally generated using Gemini
Database
We used Google BigQuery as the central datastore for:
- Raw datasets
- Cleaned encampment and shelter data
- Cluster results
- Scoring outputs
This allowed us to integrate Python ML and Next.js frontend smoothly.
Challenges We Ran Into
Missing Shelter Data
The primary City of Toronto dataset was missing most bed-level occupancy fields. Solution: -Replaced it with complete room-level occupancy data.
Geocoding Failures on macOS
Nominatim HTTPS requests failed due to certificate issues. Solution:
- Implemented SSL bypass logic and offline caching.
BigQuery Permission Issues
We initially lacked the required IAM roles to create tables. Solution:
- Updated service account roles to include BigQuery Admin, Data Editor, and Data Viewer.
ML + Next.js Integration
Integrating Python-based clustering with Next.js in a short timeframe was challenging. Solution: -Wrote all ML outputs into BigQuery for easy consumption by serverless API routes.
Severe Time Constraints
We had 24 hours to ideate, design, build, integrate, and test the entire system.
Accomplishments We’re Proud Of
Built a fully functional pipeline from raw data → processing → clustering → visualization
Created a weighted geospatial clustering system adapted specifically to homelessness patterns
Designed an intuitive mapping UI suitable for municipal decision-making
Solved multiple technical roadblocks under extreme time pressure
Built a tool with genuine potential social impact
Demonstrated strong teamwork and rapid problem-solving
What We Learned
Municipal open data can be incomplete, inconsistent, or missing critical values
Geospatial clustering reveals underlying patterns that summary statistics cannot
How to connect:
Python ML → BigQuery → Next.js → React Leaflet
The importance of credential security when working with cloud infrastructure
The real-world complexity of homelessness data
The power of data science when applied to social issues
What’s Next for ShelterMap Toronto
- Integrate live 311 encampment reports
- Create a seasonal forecast model for shelter demand
- Partner with local shelters and outreach organizations
- Develop a mobile version for field workers
- Add routing optimization for emergency response
- Expand the platform to other Canadian cities

Log in or sign up for Devpost to join the conversation.