Inspiration
About one adult in thirty is walking around with an aneurysm in their head. Most never rupture. For the doctor holding the scan, there is no safe answer: operate, and you risk causing the stroke you are trying to prevent; wait, and hope. That call is still made largely on size, and size is a poor witness.
So researchers simulate the blood flow instead, and increasingly they replace the slow physics with an AI surrogate that predicts the flow in seconds. Those surrogates report excellent accuracy. I wanted to know whether the risk numbers computed from them were equally trustworthy, because those are what a clinician would actually see.
They are not, and the reason turned out to be interesting enough to be its own contribution.
What it does
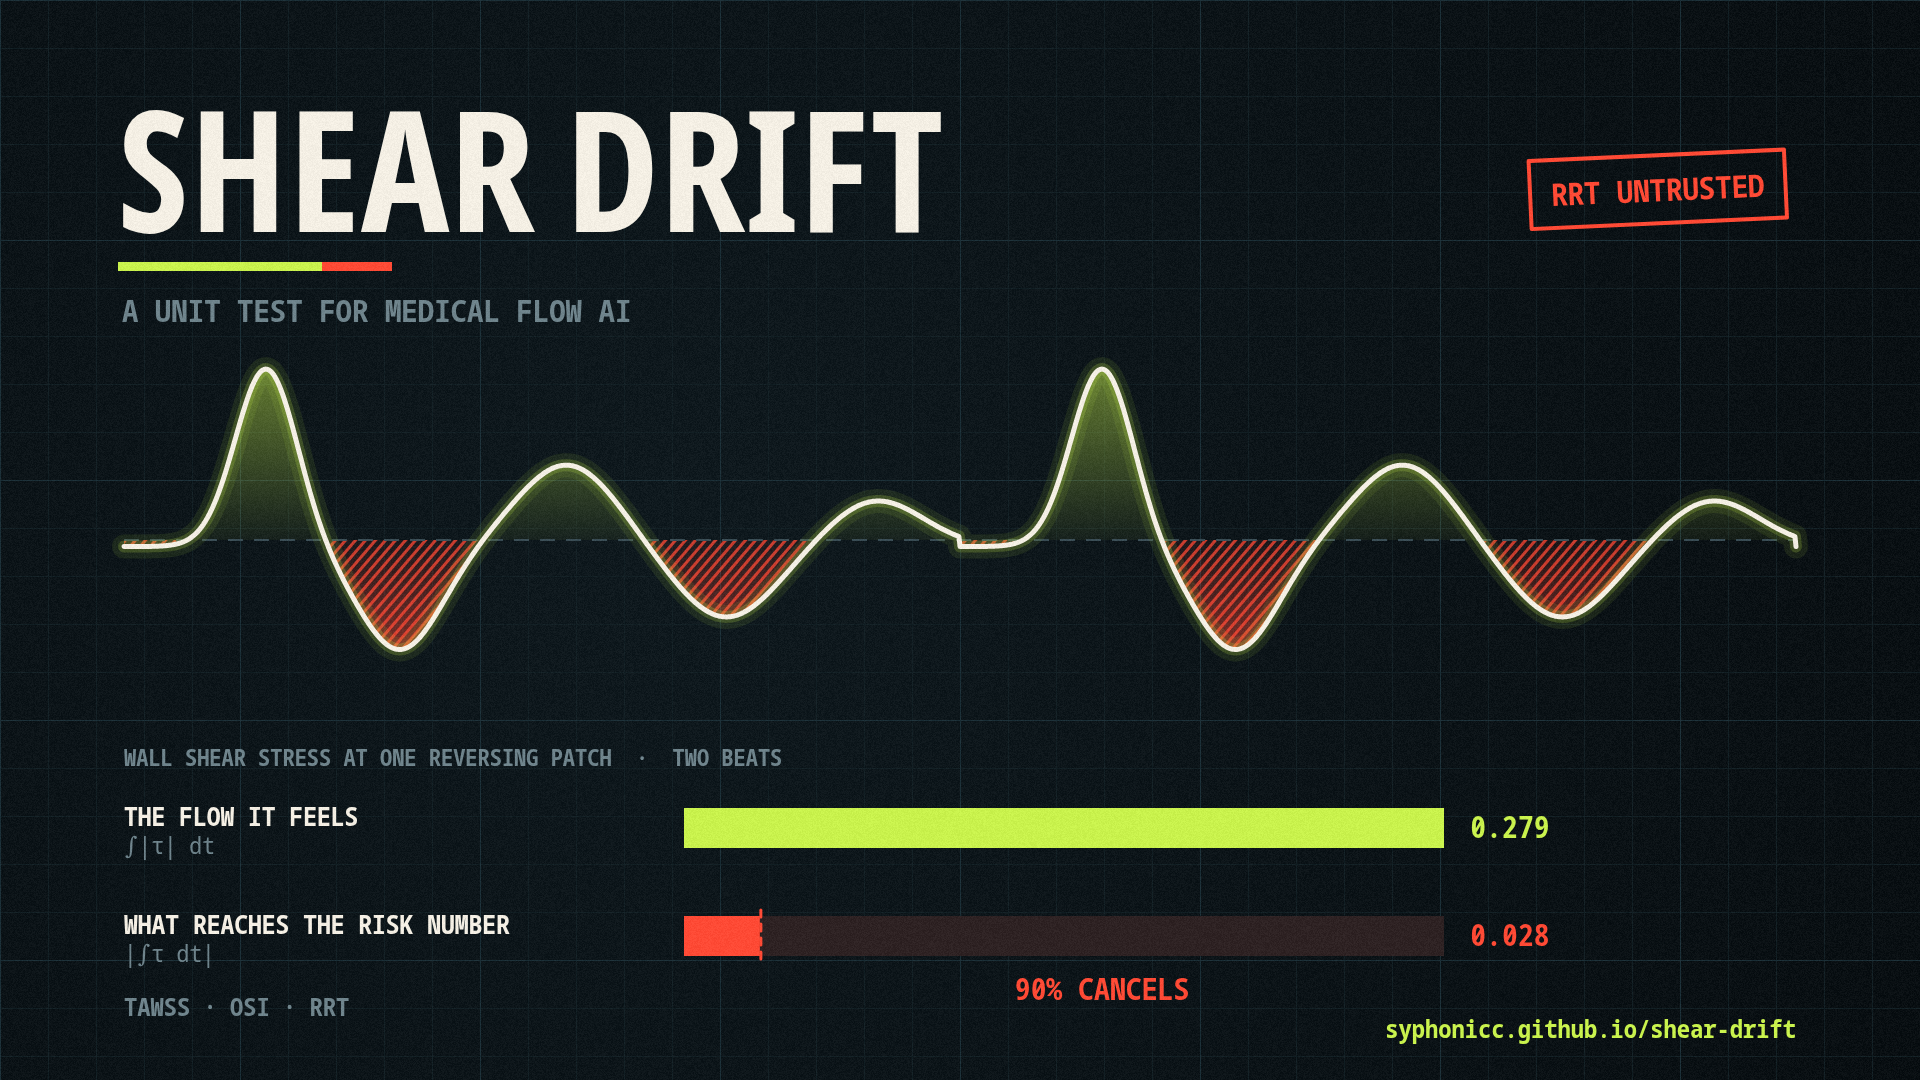
Shear Drift is a unit test for medical flow AI.
Point it at a time-resolved surrogate and a patient artery, and it answers three questions:
- Where does the risk marker still hold, and where does it stop being trustworthy? Not one global error number, but a map across the wall.
- What kind of mistake is the model making? Timing drift, random noise, or stubborn spatial bias.
- Which fix will actually work? Re-time it, smooth it, or retrain it. These are not interchangeable, and picking wrong wastes weeks.
It also refuses. When the evidence bands overlap, it returns "cannot diagnose, recalibrate" instead of a confident answer, which for a tool aimed at clinical work matters more than any feature.
The whole thing is explorable in the browser with no install: https://syphonicc.github.io/shear-drift/
The finding underneath it
Wall shear stress reverses direction during a heartbeat. Residence-time markers like RRT depend on the net integral of that stress, so a wall doing ten steps forward and nine back has a huge instantaneous signal and almost no net. Small errors in the flow survive into the net almost undiluted, while the accuracy score is dominated by the large instantaneous values and stays reassuringly low.
I derived this rather than only fitting it. To first order, for any perturbation of the stress:
$$\frac{\delta R}{R} = \frac{\hat s \langle d \rangle}{R \langle |\tau| \rangle} - \frac{\langle \hat\tau \cdot d \rangle}{\langle |\tau| \rangle}$$
which gives closed forms for each error type, and an empirical scaling $(\delta R/R)/\varepsilon = c(1/R - 1)^p$ with $c = 0.194$, $p = 0.641$ ($R^2 = 0.956$ over 279 exact Womersley cases). The theory explains the exponent: near the onset of reversal the reversed lobe is parabolic and $p = 5/6$ analytically, while a frozen spatial bias gives $p = 1$ exactly with a much larger prefactor. That is why bias is punished roughly five times harder than a clock error, and it is why naming the error type matters.
The surprising corollary: smoothing leaves RRT exactly unchanged (error 7e-16), because smoothing preserves the integral. A reviewer's instinct to "just filter it" does nothing.
How I built it
- CFD ground truth. OpenFOAM v2512, pulsatile flow in a real patient cerebral aneurysm from the 2015 International Aneurysm CFD Challenge, plus an abdominal aortic aneurysm (AAA042) from the Vascular Model Repository. The AAA case needed 17 cardiac cycles and a
totalPressureoutlet to become genuinely periodic; the first five-cycle run was off by 63% between cycles and would have produced confident nonsense. - A real surrogate to break. POD reduction (10 modes, 99.998% of the energy) plus an LSTM rolling out autoregressively, trained on heart rates it had not seen at test time. One-step RMSE is 7.3e-2, which looks excellent. Over six beats the field error grows from 8% to 79%.
- Truth-free diagnosis. Borrowing phase reduction from dynamical systems, the tool estimates the surrogate's clock error without ground truth: it found the rollout running 1.41% fast over 40 beats, with a residual of 0.03% after correction.
- Honest verdicts. Re-timing then cut RRT error only from 4.95% to 4.54%, so the tool says "re-timing will not save you, the residual is shape error, retrain." That negative result is the product working.
- External validation. I ran the fingerprint against a published Imperial College and NUS surrogate, using only the three error numbers printed in their paper and never touching their code. It classified the error as spatial bias. Their author confirmed that diagnosis independently and gave permission to quote him.
- The explorer. Pure static JavaScript and WebGL, no backend, two geometries, a live clock-error slider and a self-test where you type in your own three numbers.
- The video. A papercraft stop-motion film rendered entirely in HTML canvas, with a procedural fibre texture and hand-cut edges, quantised to a 12 fps stop-motion timebase and captured deterministically by Puppeteer. Real captured frames of the actual mesh appear inside it, so the camera pushes through a paper monitor into genuine data.
Challenges
The first version of the law was wrong in an interesting way. A researcher, W. Ding, objected that a pure clock error integrated over the surrogate's own period changes every biomarker by exactly zero. He was right. That forced a reframe: the error being measured is a window mismatch, which is real for autoregressive rollouts with an emergent period and irrelevant for per-snapshot models. The paper is stronger for it, and he is credited.
The honest answer was sometimes boring. The cerebral wall holds up almost everywhere: 99.7% under 1% error, nothing over 5%. There was no wall of red to show. I built the video around what the measurement actually says instead of manufacturing drama.
The whole-wall average lies. For the AAA, the average OSI is lower than the healthy control, because 95% of the wall is straight non-reversing aorta diluting it. Only 0.037% of the wall exceeds OSI 0.1, and it sits exactly on the sac, at a peak of 0.209 versus the control's 0.085. Compare sac to sac or the comparison flips the wrong way.
The diagnostic bands are not universal. As the median OSI of a wall rises from 0.0007 to 0.05, the white-noise band falls from 27 to 5. The same three numbers genuinely change meaning on a different geometry. Version 5 of the explorer takes the wall's median OSI as a fourth input, log-interpolates the bands, and declines to answer when they overlap.
Accomplishments
- A derived first-order theory, not just a curve fit, verified against 3D CFD to within 16% in every reversing bin.
- A truth-free clock diagnostic that recovered an injected 2% drift as 1.99%.
- An external check on somebody else's published model that its own author confirmed.
- A tool that says "I cannot tell" when it cannot tell.
What I learned
That an accuracy score and a risk number can disagree completely, and that the disagreement is predictable rather than mysterious. Also that a negative result, presented clearly, is more useful to a practitioner than a hedged positive one. The most valuable output of this project is a sentence a researcher can act on: your error is spatial bias, re-timing will not help, retrain.
What's next
- Post the theory note to arXiv (physics.flu-dyn) and submit to a biomechanics journal.
- A second surrogate family (a MeshGraphNet-style GNN) to confirm the fingerprint transfers across architectures.
- A vectorial generalisation of the window-mismatch formula, which is currently exact only for antiparallel reversal and a lower bound otherwise.
- Per-geometry auto-calibration so the bands are fitted on the user's own wall rather than interpolated.

Log in or sign up for Devpost to join the conversation.