Inspiration
Kenya's Meteorological Service expects above-average October–December 2026 short rains across most of the country, including Kiambu, with prolonged wet spells, driven by a strong El Niño. Long, humid, wet spells are exactly when late blight spreads through tomato and potato farms.
Smallholder farmers around Juja usually face two bad options: spray fungicide on a fixed schedule (costly, and often wasted when rain washes it off) or spray too late and lose the crop. Generic forecasts like "rain expected" don't answer the questions that matter: Is my crop at risk right now? When should I spray?
The JKUAT Conduit station measures exactly the variables that drive blight: humidity, temperature, rain and wind, every 15 minutes. We wanted to turn those readings into a decision a farmer can act on today.
What it does
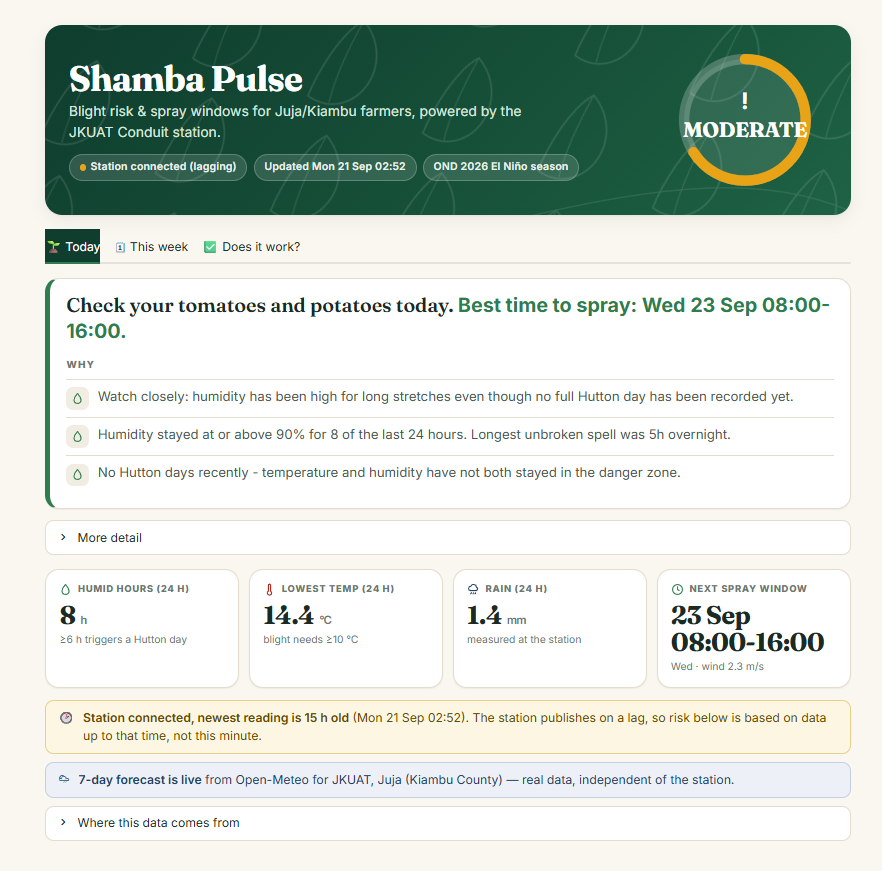
Shamba Pulse turns Conduit station data into three decisions:
- Blight risk (HIGH / MODERATE / LOW / UNKNOWN) using the Hutton criteria, an established late-blight risk rule. A day is a Hutton day when
$$T_{\min} \ge 10\,^{\circ}\mathrm{C} \quad \text{and} \quad \text{hours with } RH \ge 90\% \;\ge\; 6$$
and two consecutive Hutton days trigger HIGH risk. Every verdict comes with plain-language reasons, e.g. "Humidity stayed above 90% for 11 hours, 2 days running."
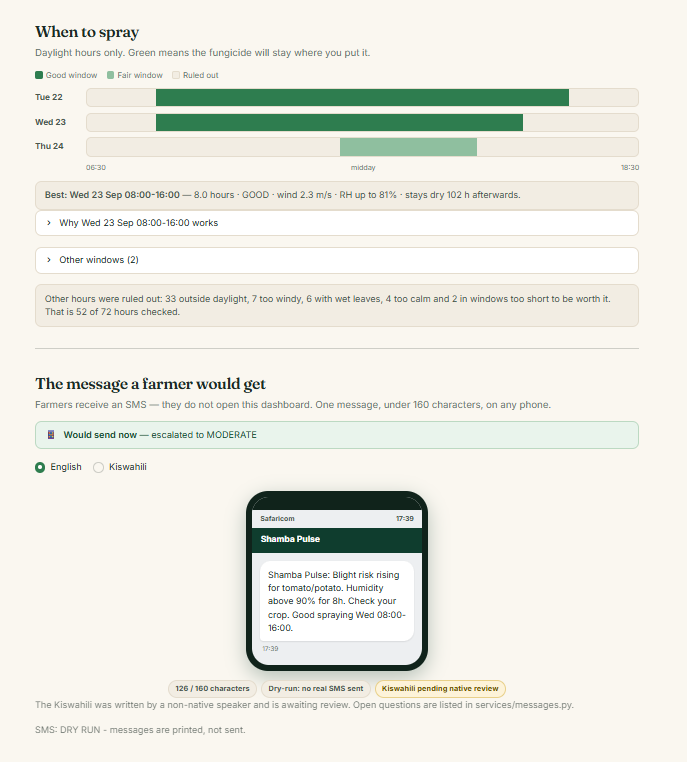
- Spray windows: using the Open-Meteo forecast, it finds hours that are in daylight, have moderate wind (not calm, not gusty), have dry leaves (RH < 90%) and are followed by at least 6 rain-free hours, so the spray isn't washed off. It also explains why every other hour was ruled out.
- An SMS alert under 160 characters, in English and Kiswahili. The Kiswahili uses Swahili time (09:00 is saa 3 asubuhi); otherwise a farmer could read "09:00" as 3 p.m.
Two users, two products: farmers get the SMS; extension officers, agrovets and cooperatives use the dashboard to advise many farmers at once. A sending policy texts only when risk rises or Hutton fires, to avoid alert fatigue.
Does it work? A real-season backtest
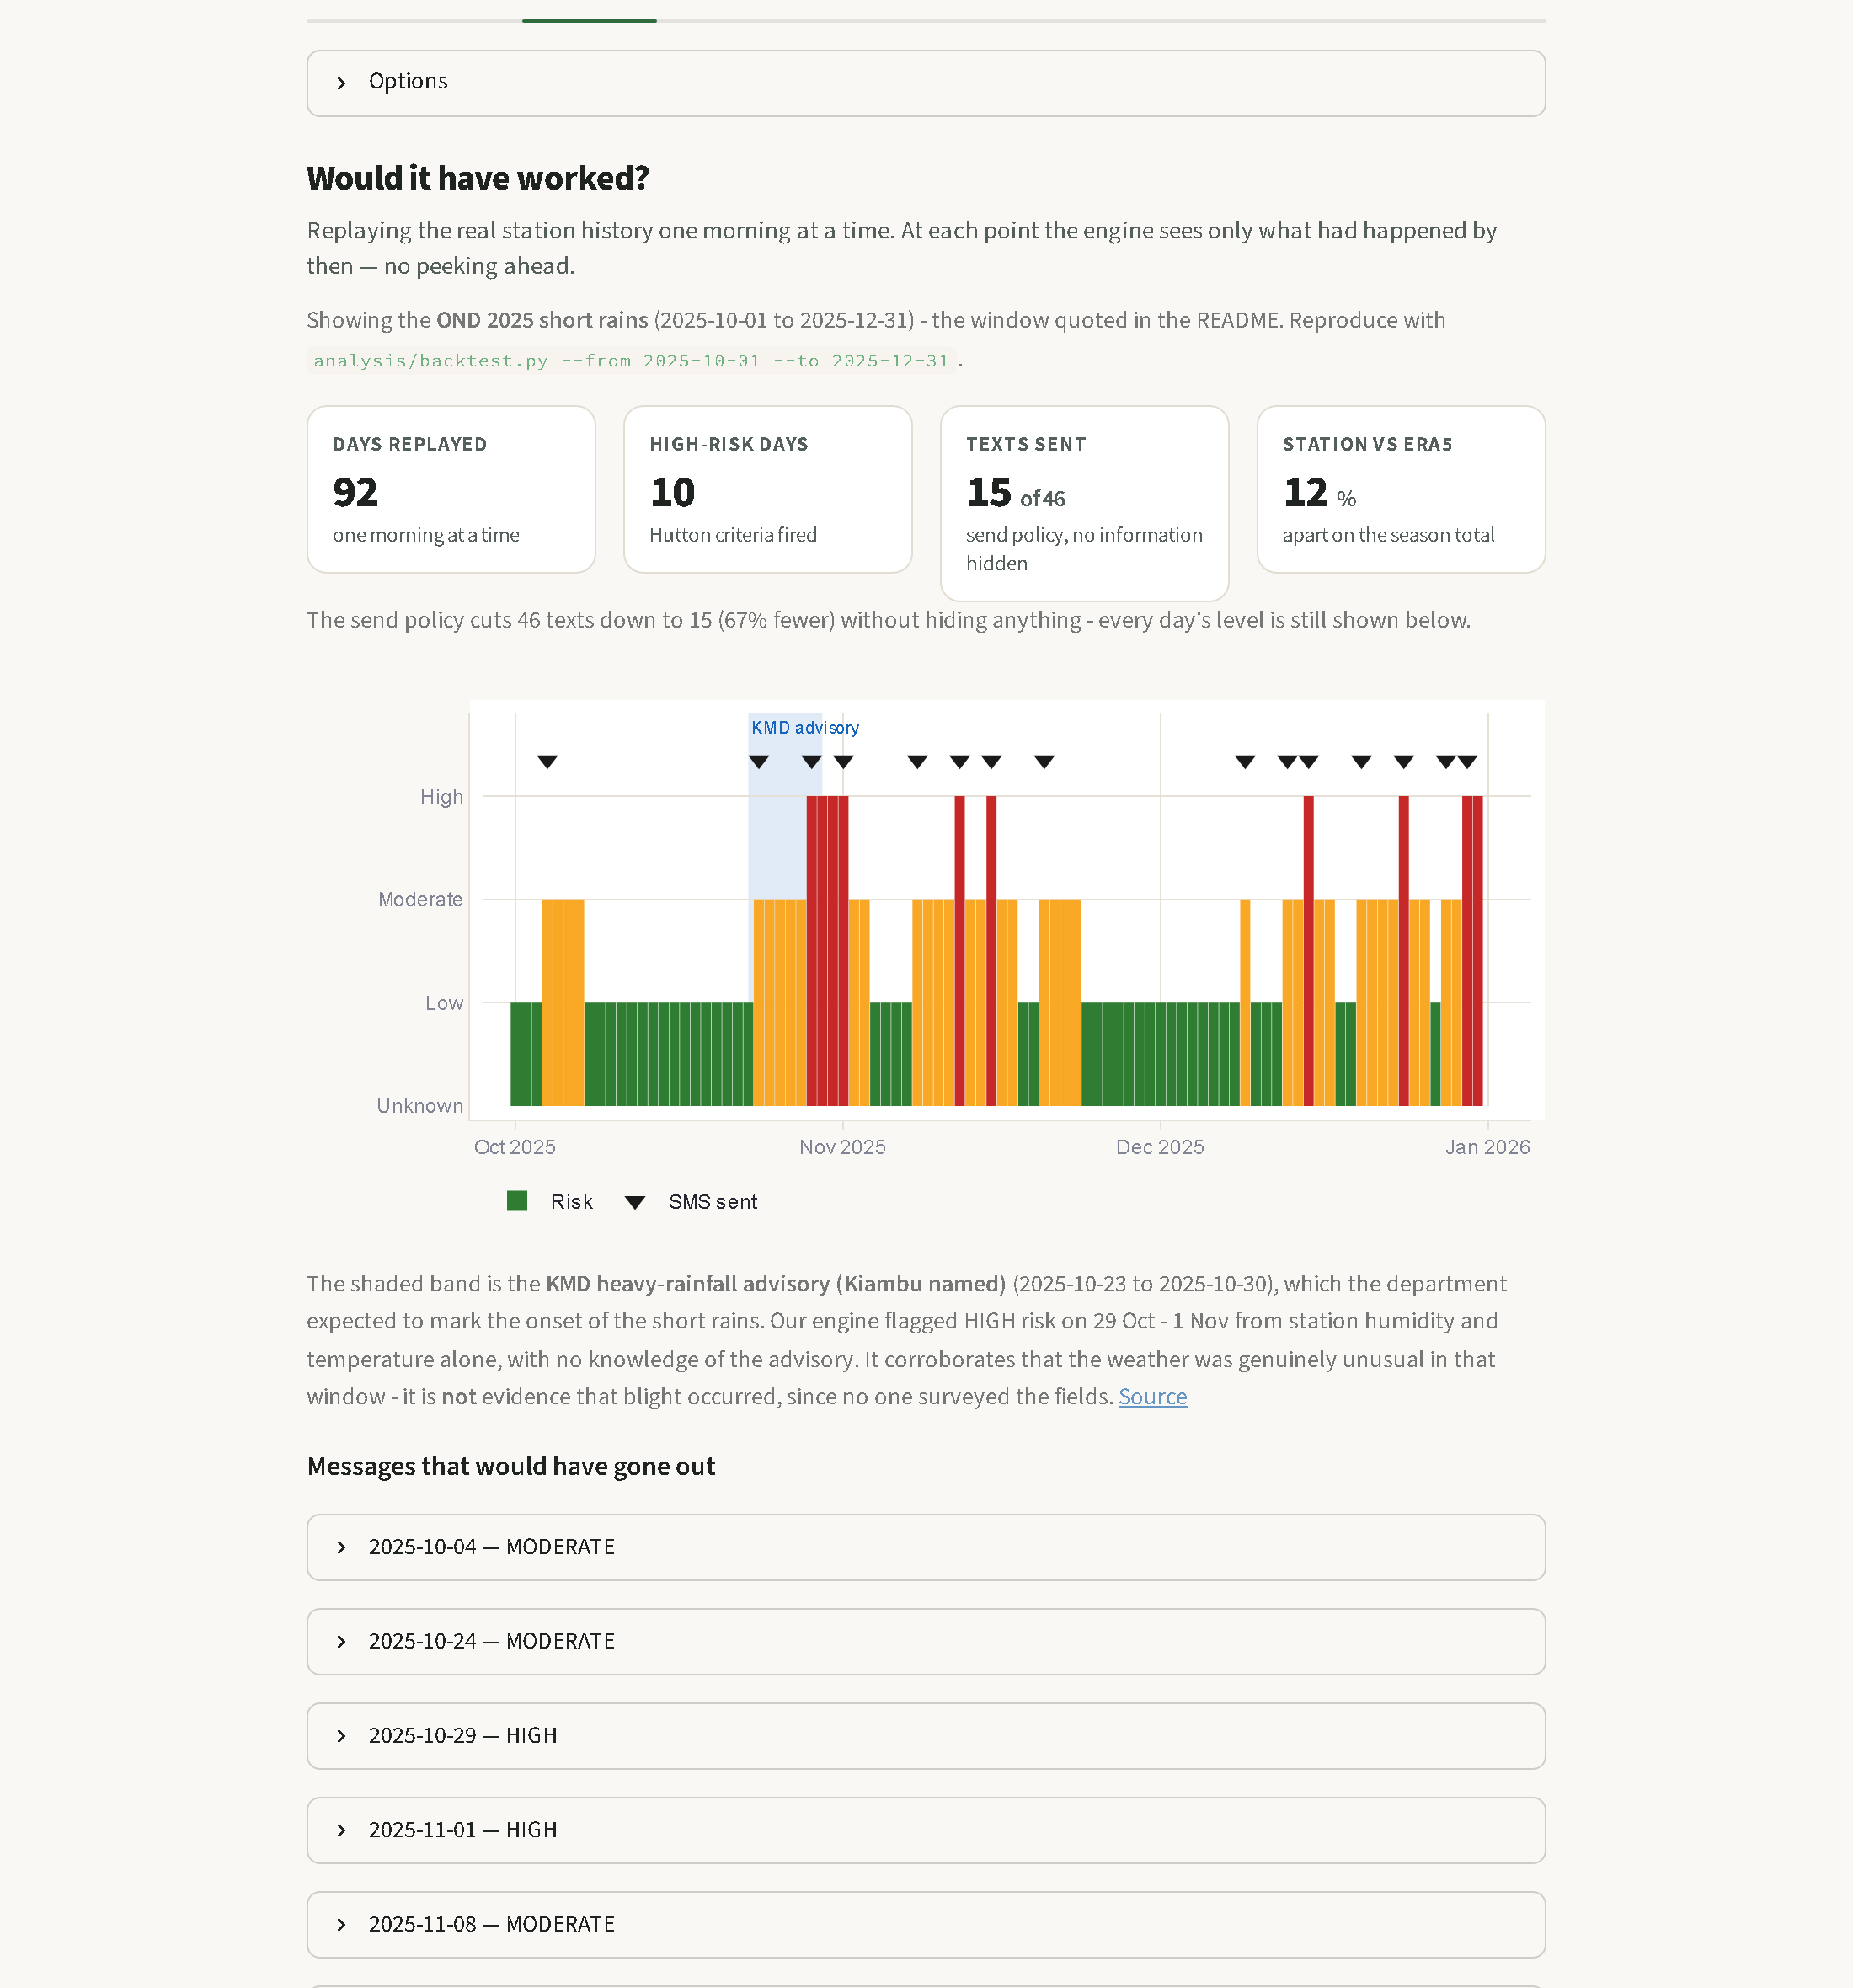
We downloaded the station's full history (476 days, 46,183 readings) and replayed the real October–December 2025 short rains with no look-ahead (enforced by tests):
| Result (1 Oct – 31 Dec 2025) | Value |
|---|---|
| Days replayed | 92 |
| HIGH-risk days | 10 (6 episodes; longest Hutton run: 5 days) |
| Days inside a Hutton run | 21 |
| SMS-eligible days → texts actually sent | 46 → 15 (67% fewer) |
The season's main HIGH period (29 Oct – 1 Nov 2025) coincided with the Kenya Meteorological Department's heavy-rainfall advisory for 23–30 October 2025, which listed Kiambu. This corroborates the weather, not disease on the ground; showing that alerts reduce blight needs a field trial.
Illustrative scenario (not a measured result): weekly scheduled spraying means about 13 sprays over those 92 days; spraying around the 6 high-risk episodes means about 6. Whether fewer, better-timed sprays protect the crop as well is exactly what a pilot must test.
How we built it
- Data: the official Conduit API (form-encoded POST with a date range), fetched in cached, polite chunks. Timestamps are converted from UTC to Kenya time (a naive read would shift every night-time humidity window by 3 hours).
- Engine: Python and pandas. It is rule-based and explainable, with the Hutton criteria, a humid-hours fallback, spray-window scanning and a send policy. All thresholds live in
config.pywith a comment explaining each. - Forecast: the Open-Meteo hourly 7-day forecast, mapped to the same columns as station data so the engine doesn't care about the source.
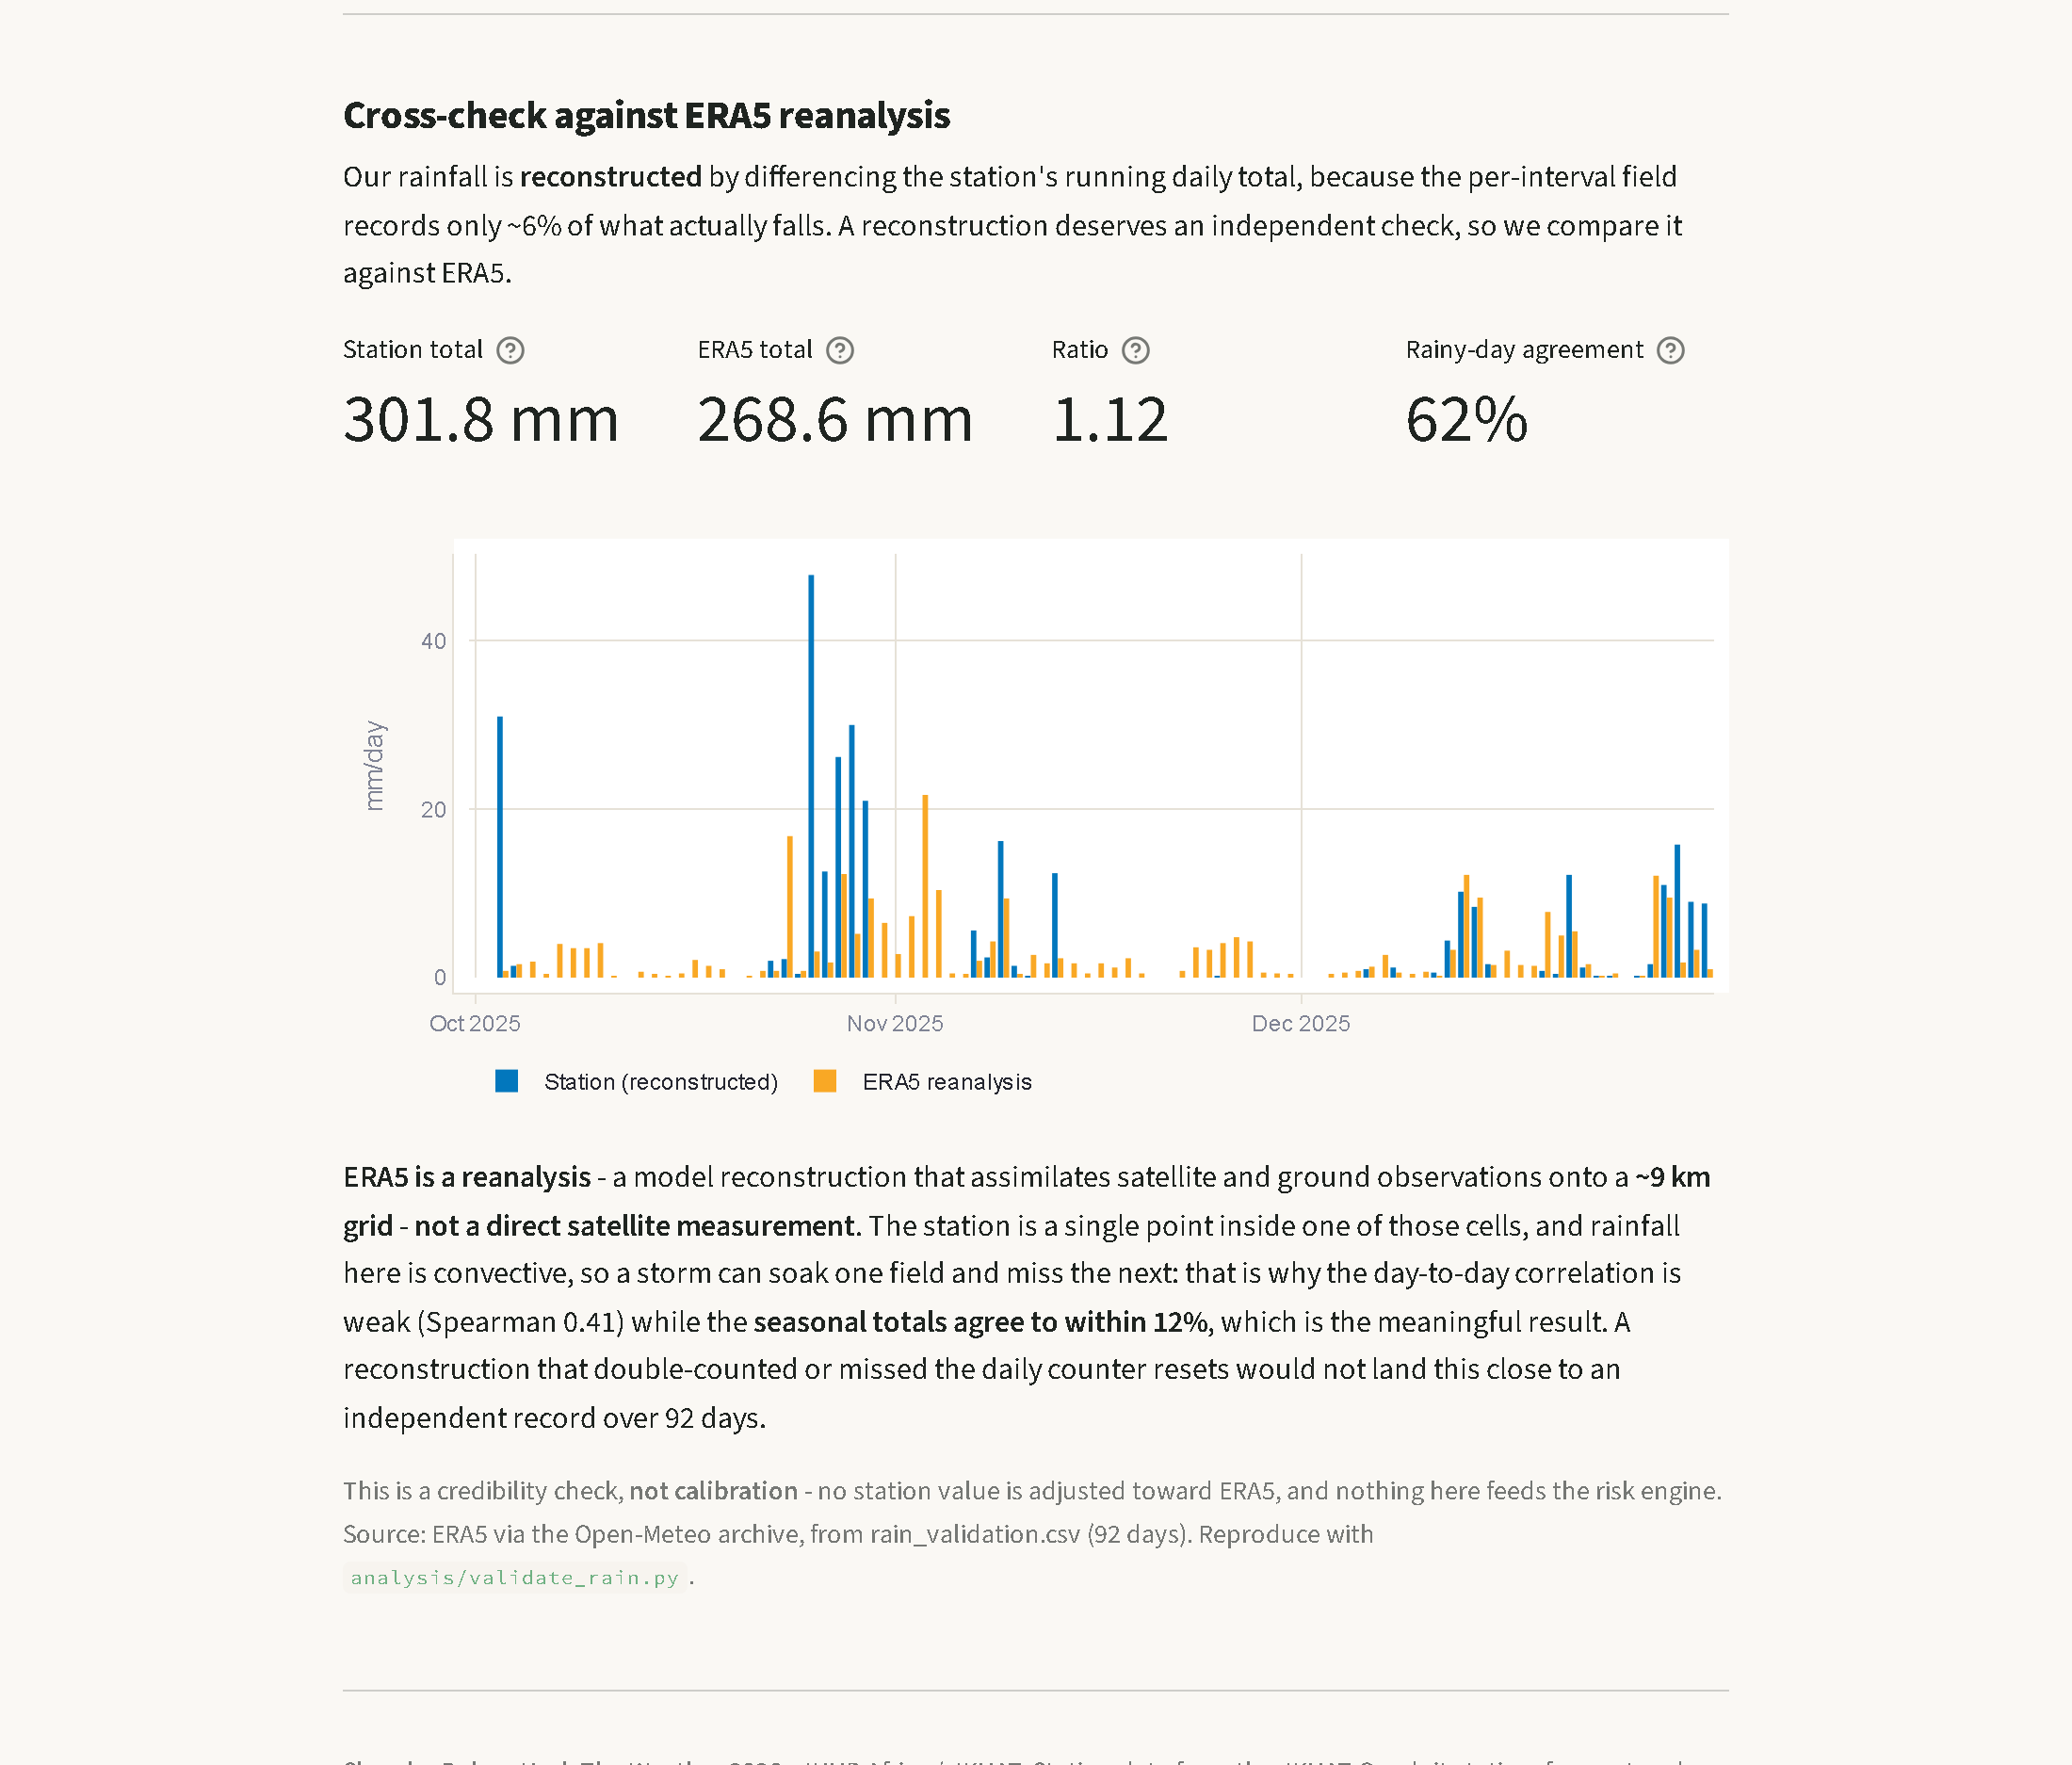
- Cross-check: ERA5 reanalysis rainfall via Open-Meteo's archive.
- App: Streamlit, Plotly and custom HTML/CSS components (risk ring, 7-day strip, daylight spray timeline, phone mockup, station map), deployed on Streamlit Community Cloud. If the station is unreachable, it falls back to committed real history and says so clearly.
- SMS: an Africa's Talking integration. The demo runs in dry-run mode; no real SMS is sent.
- Quality: 378 automated tests, including Hutton boundary cases, no-look-ahead checks, 160-character limits for every message, and Swahili time for all 24 hours.
Challenges we ran into
- Our tests passed while a core feature was broken. In the backtest the HIGH pathway never fired: at alert time "today" is incomplete, so the consecutive-day counter always broke on it. Every test used complete days. We fixed the logic and added tests for real-world partial days.
- The obvious rain field was wrong. The per-interval rain field (
rg1) recorded 0.20 mm where the station's daily running total showed 6.20 mm, so it missed ~97% of the rain. We rebuilt rainfall from the running total, handling the daily reset. - Rain gauge 2 is faulty. Its "daily" total resets about 21 times a day and adds up to thousands of mm in a ~300 mm season. We excluded it and documented the evidence for the station maintainers.
- Other sensor issues: the UV sensor reads constant, and the gust-direction field duplicates gust speed.
- The API's end date is exclusive, and the station publishes with a lag. We fixed the query and show data freshness honestly instead of calling old data "live".
- Alert fatigue: a naive version would have texted on most days of a wet season, so we designed a send policy.
Accomplishments that we're proud of
- A real-season backtest on actual Conduit data, not a synthetic demo.
- Finding and documenting real sensor faults. Rainfall rebuilt this way totalled 301.8 mm for the season, within 12% of ERA5 reanalysis (268.6 mm).
- A system that says UNKNOWN instead of a falsely reassuring LOW when data is thin.
- Kiswahili messages that respect Swahili time, not a literal translation.
What we learned
- Inspect the data before trusting it: the most obvious field was the wrong one.
- Explainability builds trust: a farmer needs to know why to spray, not just a number.
- Tests must include messy real-world cases (partial days, gaps, lags), not just clean ones.
- Honest limitations make a stronger case than overclaiming.
Limitations
- A single station: it represents the JKUAT/Juja area, not every farm in Kiambu.
- The Hutton criteria were developed in the UK; local calibration against observed blight outbreaks in Kiambu is our #1 next step.
- The Kiswahili is pending native-speaker review.
- No soil-moisture sensor. ERA5 is a reanalysis (a model that assimilates satellite and ground data), used only as a cross-check.
What's next for Shamba Pulse
- A pilot with a county extension office and farmer groups, measuring sprays, cost and disease incidence.
- Satellite rainfall (CHIRPS/GPM) in the live pipeline, plus more stations for Kiambu-wide coverage.
- An ML model trained on observed outbreaks, using the engine's existing slot for it.
- Live SMS/USSD via Africa's Talking, with native Kiswahili review. It could be funded by county extension services, cooperatives or input suppliers.
Data credits: JKUAT Conduit station (JHUB Africa / JKUAT), Open-Meteo, ERA5 (Copernicus/ECMWF), Kenya Meteorological Department.

Log in or sign up for Devpost to join the conversation.