Inspiration
Shaman was based on the hypotheses that prediction markets aren't are as reactive to information as real time sentiment updates are. By allowing users to track market sentiment and prediction market values at the same time and linking sentiment to prediction markets, Shaman could let them see shifts in prediction markets before their price actually changed.
What it does
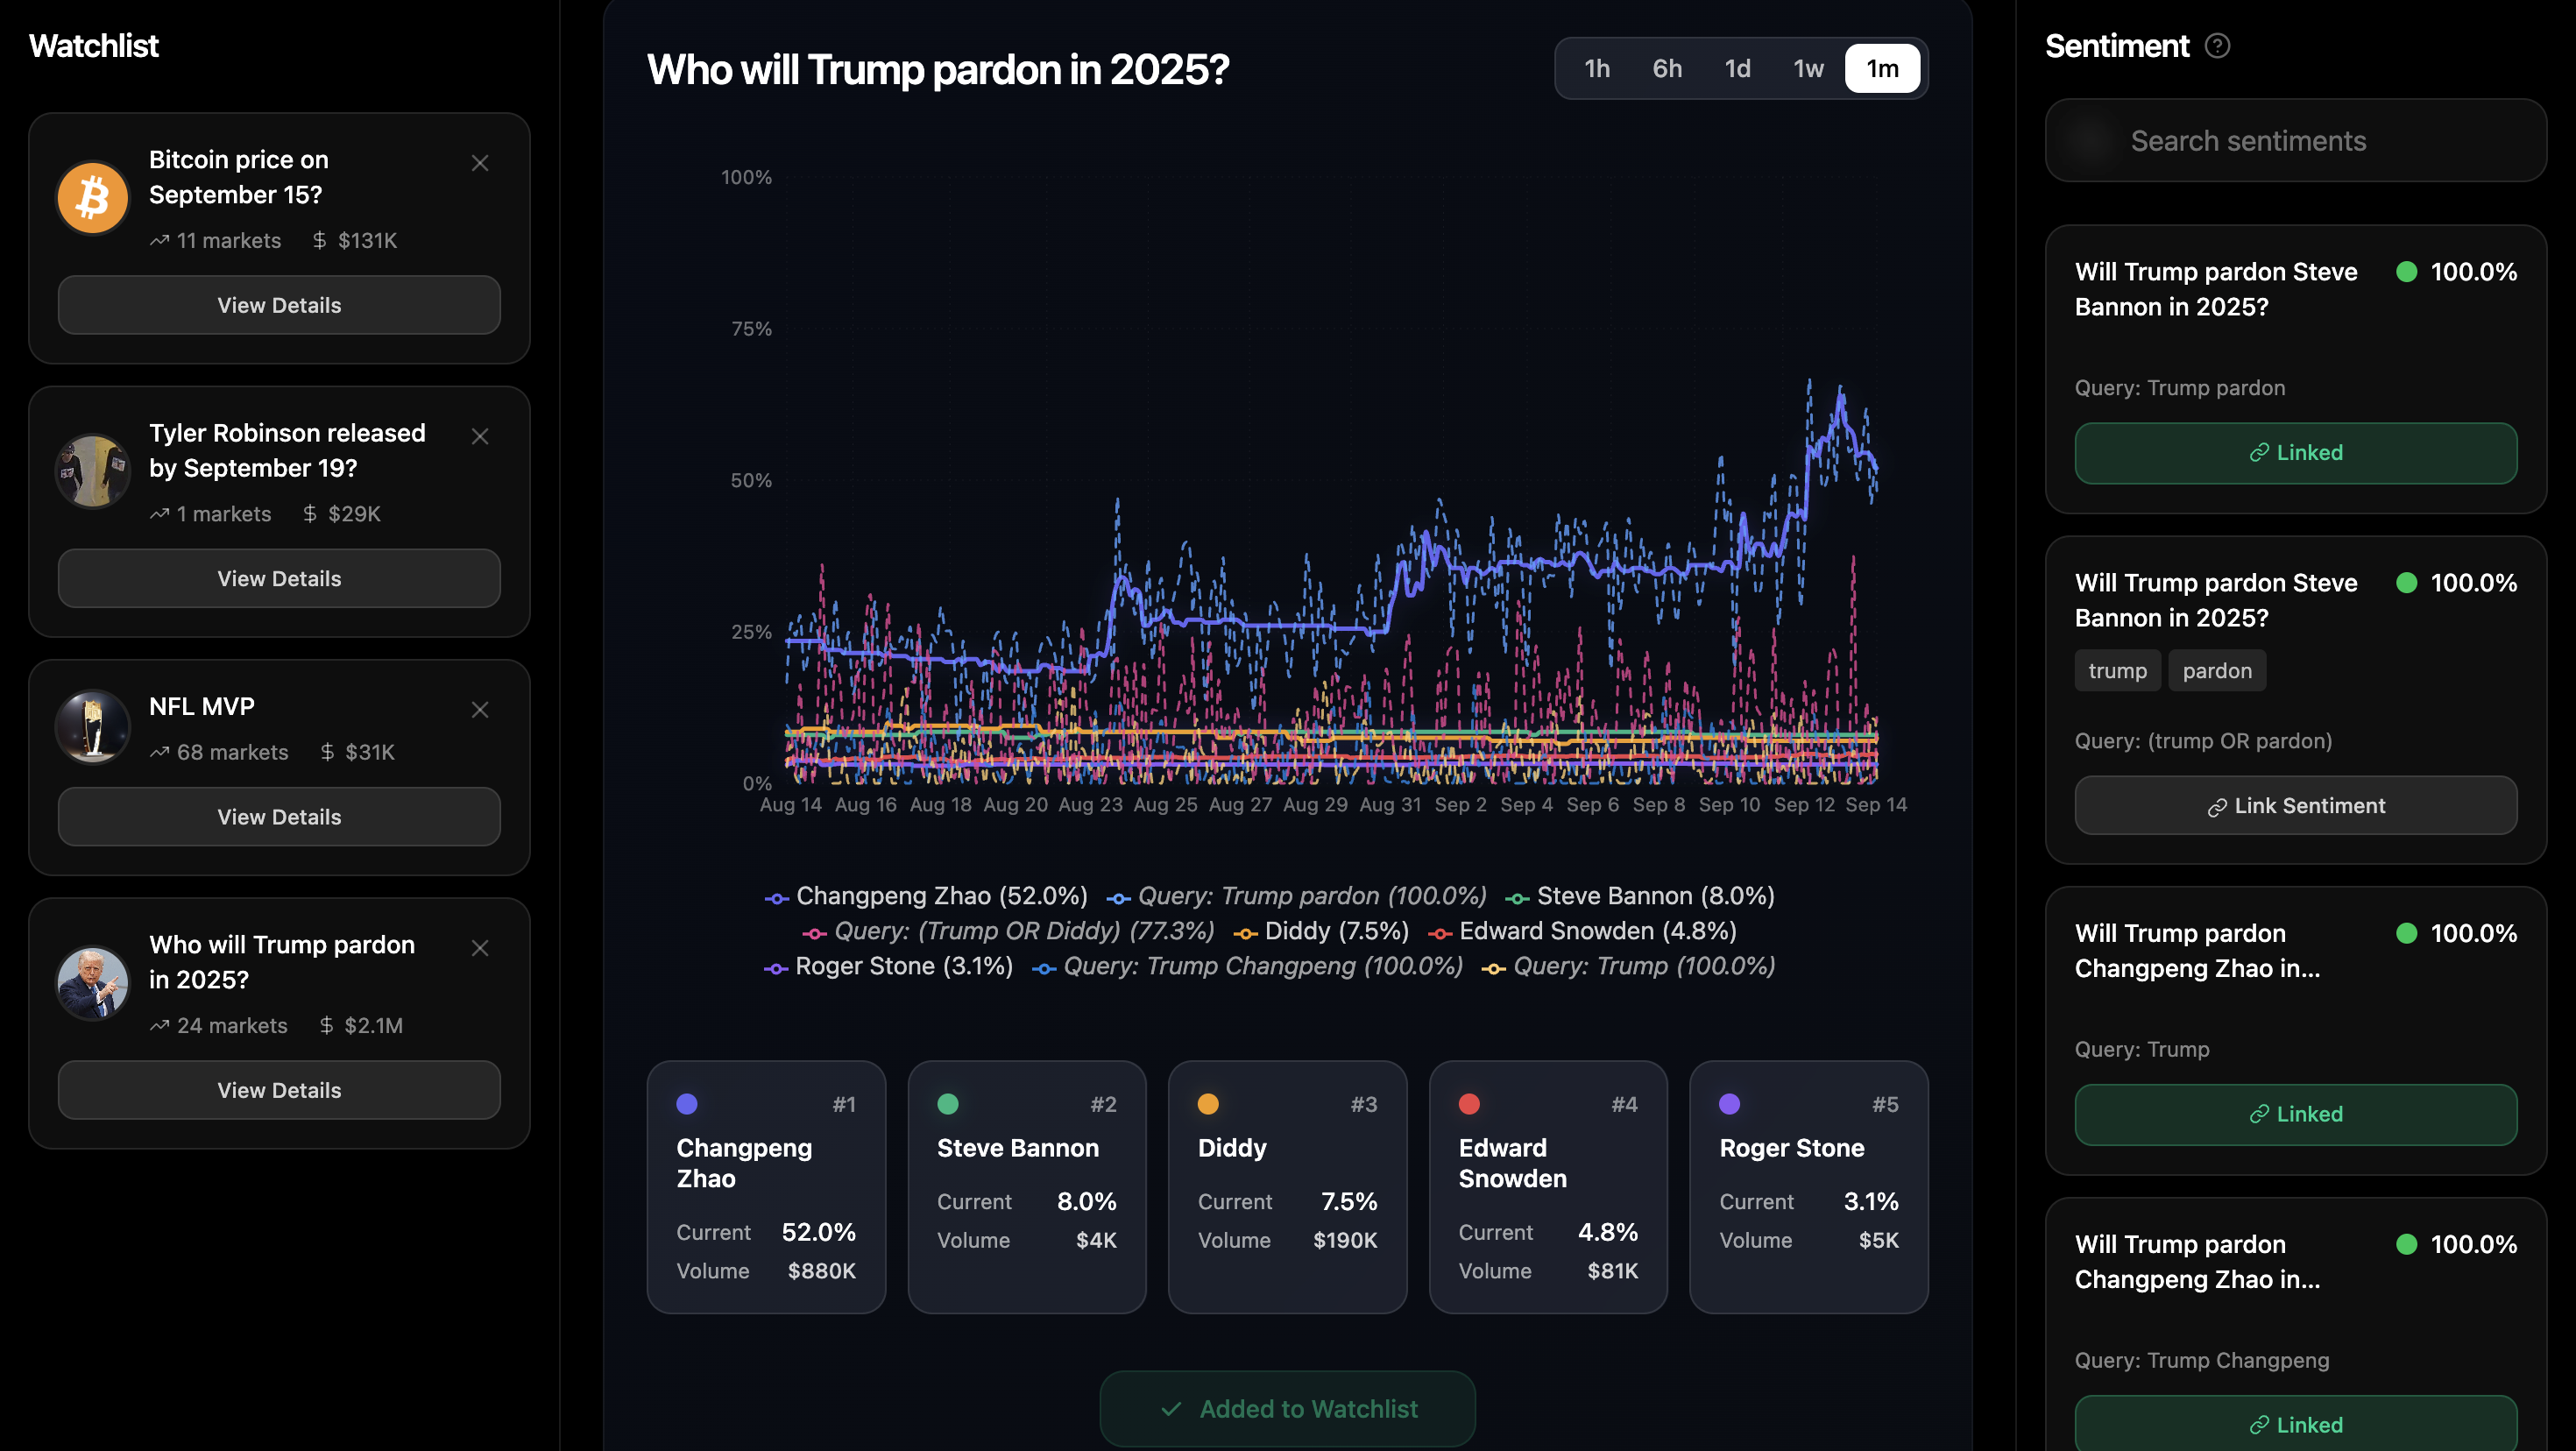
Shaman scrapes the polymarket API to get information about current open events in the prediction market, and lets you search over them. For each event, like "Who will win the NFL MVP?", there are one or more markets under it, like Jordan Love (Yes, No), Caleb Williams (Yes, No) and more. It then takes the name of that event and scrapes the internet to get market sentiment about that very same question based on a number of different queries to the GDELT API generated by Google's Gemini API. Shaman then uses Canonical Correlation Analysis (CCA) as a heuristic to see how closely linked the movement of one sentiment is to its market, and shows the user this. The user can then link that sentiment to the market, getting alerts when there's a large divergence, or useful visual overlays in the form of charts.
How we built it
Shaman is built on a React 19 + TypeScript frontend with a sophisticated three-panel architecture. The left panel implements a persistent watchlist using React state management and localStorage for persistence, while the right panel handles sentiment analysis with a custom search interface powered by Fuse.js fuzzy matching. The main center panel renders interactive Recharts visualizations with real-time data streaming from Polymarket's CLOB API.
The core sentiment analysis pipeline starts by feeding market questions through Google's Gemini 2.5 Flash API, which generates five structured GDELT queries using carefully engineered prompts that follow specific formatting rules (single words, two-word phrases, OR statements, etc.). These queries hit the GDELT API through custom proxy endpoints to avoid CORS issues, fetching historical sentiment time series data. We then implement a custom Canonical Correlation Analysis algorithm in a separate React component that calculates correlation coefficients between market price movements and sentiment data, using time series alignment and statistical analysis.
The entire system is wrapped in a multi-layer caching architecture - we cache GDELT responses for 5 minutes, sentiment analysis results by market ID, and price history data with configurable fidelity settings. Performance optimization includes data downsampling for large datasets, parallel Promise.all processing for API calls, and React.memo/useMemo hooks to prevent unnecessary re-renders. The UI uses Tailwind CSS with a custom dark theme, ShadCN components for consistency, and implements responsive design with mobile-first breakpoints. Error handling includes graceful degradation when APIs fail, loading states with skeleton components, and user-friendly tooltips for disabled interactions.
Challenges we ran into
We faced a mix of technical and user-experience challenges. The biggest hurdles were dealing with strict API rate limits, inconsistent response formats, and aligning data from multiple sources that used different timestamp standards. Generating consistent GDELT queries with Gemini was tricky too—sometimes the AI produced invalid or overly broad results, so we had to generate a very robust system prompt. Handling large datasets created performance bottlenecks, which we solved with downsampling, optimized algorithms, and a lot of caching. Real-time synchronization across APIs introduced race conditions and stale data issues, while CORS restrictions forced us to set up proxy endpoints. On top of that, we had to manage memory leaks, infinite re-renders, and long sentiment analysis runtimes by adding better state management, caching, and clear loading indicators to keep the user experience smooth.
Accomplishments that we're proud of
The sheer amount of backend processing work that we've managed to pull off. We need to fetch market ids from Polymarket's Gamma api, get the CLOB id from that, request price history using the CLOB id, then feed the title into Gemini, have it generate queries for GDELT, grab the price history from those queries, compare the price history of both the Polymarket and GDELT queries, generate correlation scores, and present that all for the user. Cleaning all that data was not an easy task.
What we learned
On the technical side, we discovered just how powerful Canonical Correlation Analysis can be for uncovering hidden links in time series data, and just how much patience it takes to wrangle AI into producing consistent queries. We also became experts in caching, timestamp gymnastics, and remembering to add React states at the last possible minute. On the product side, we saw that users crave instant feedback, whether through loading states, skeletons, or color-coded insights. Features like fuzzy search, watchlists, and clear tooltips also make the experience way more intuitive. From an integration standpoint, we learned that APIs rarely play nice out of the box, so robust error handling, smart rate limiting, and parallel calls were essential. And finally, on the dev process side, TypeScript, custom hooks, profiling, and lazy loading saved us from many late-night debugging marathons (not really :/). I don't think I've levelled up in so many things at once so fast ever before.
What's next for Shaman
Polish up the UX, use a more robust causal analysis framework than just a correlation one, add user authentication to allow people to have accounts.
Built With
- fuse
- gdelt
- gemini
- polymarket-gamma-api
- react
- recharts
- shadcn/ui
- tailwindcss
- typescript
- vite


Log in or sign up for Devpost to join the conversation.