-
-
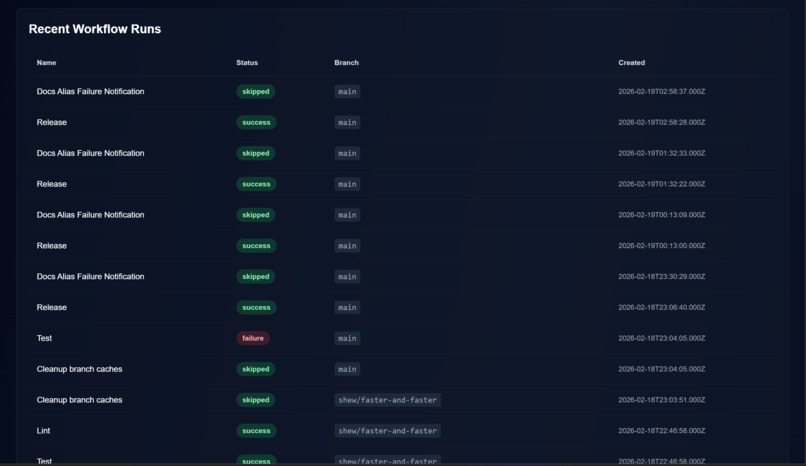
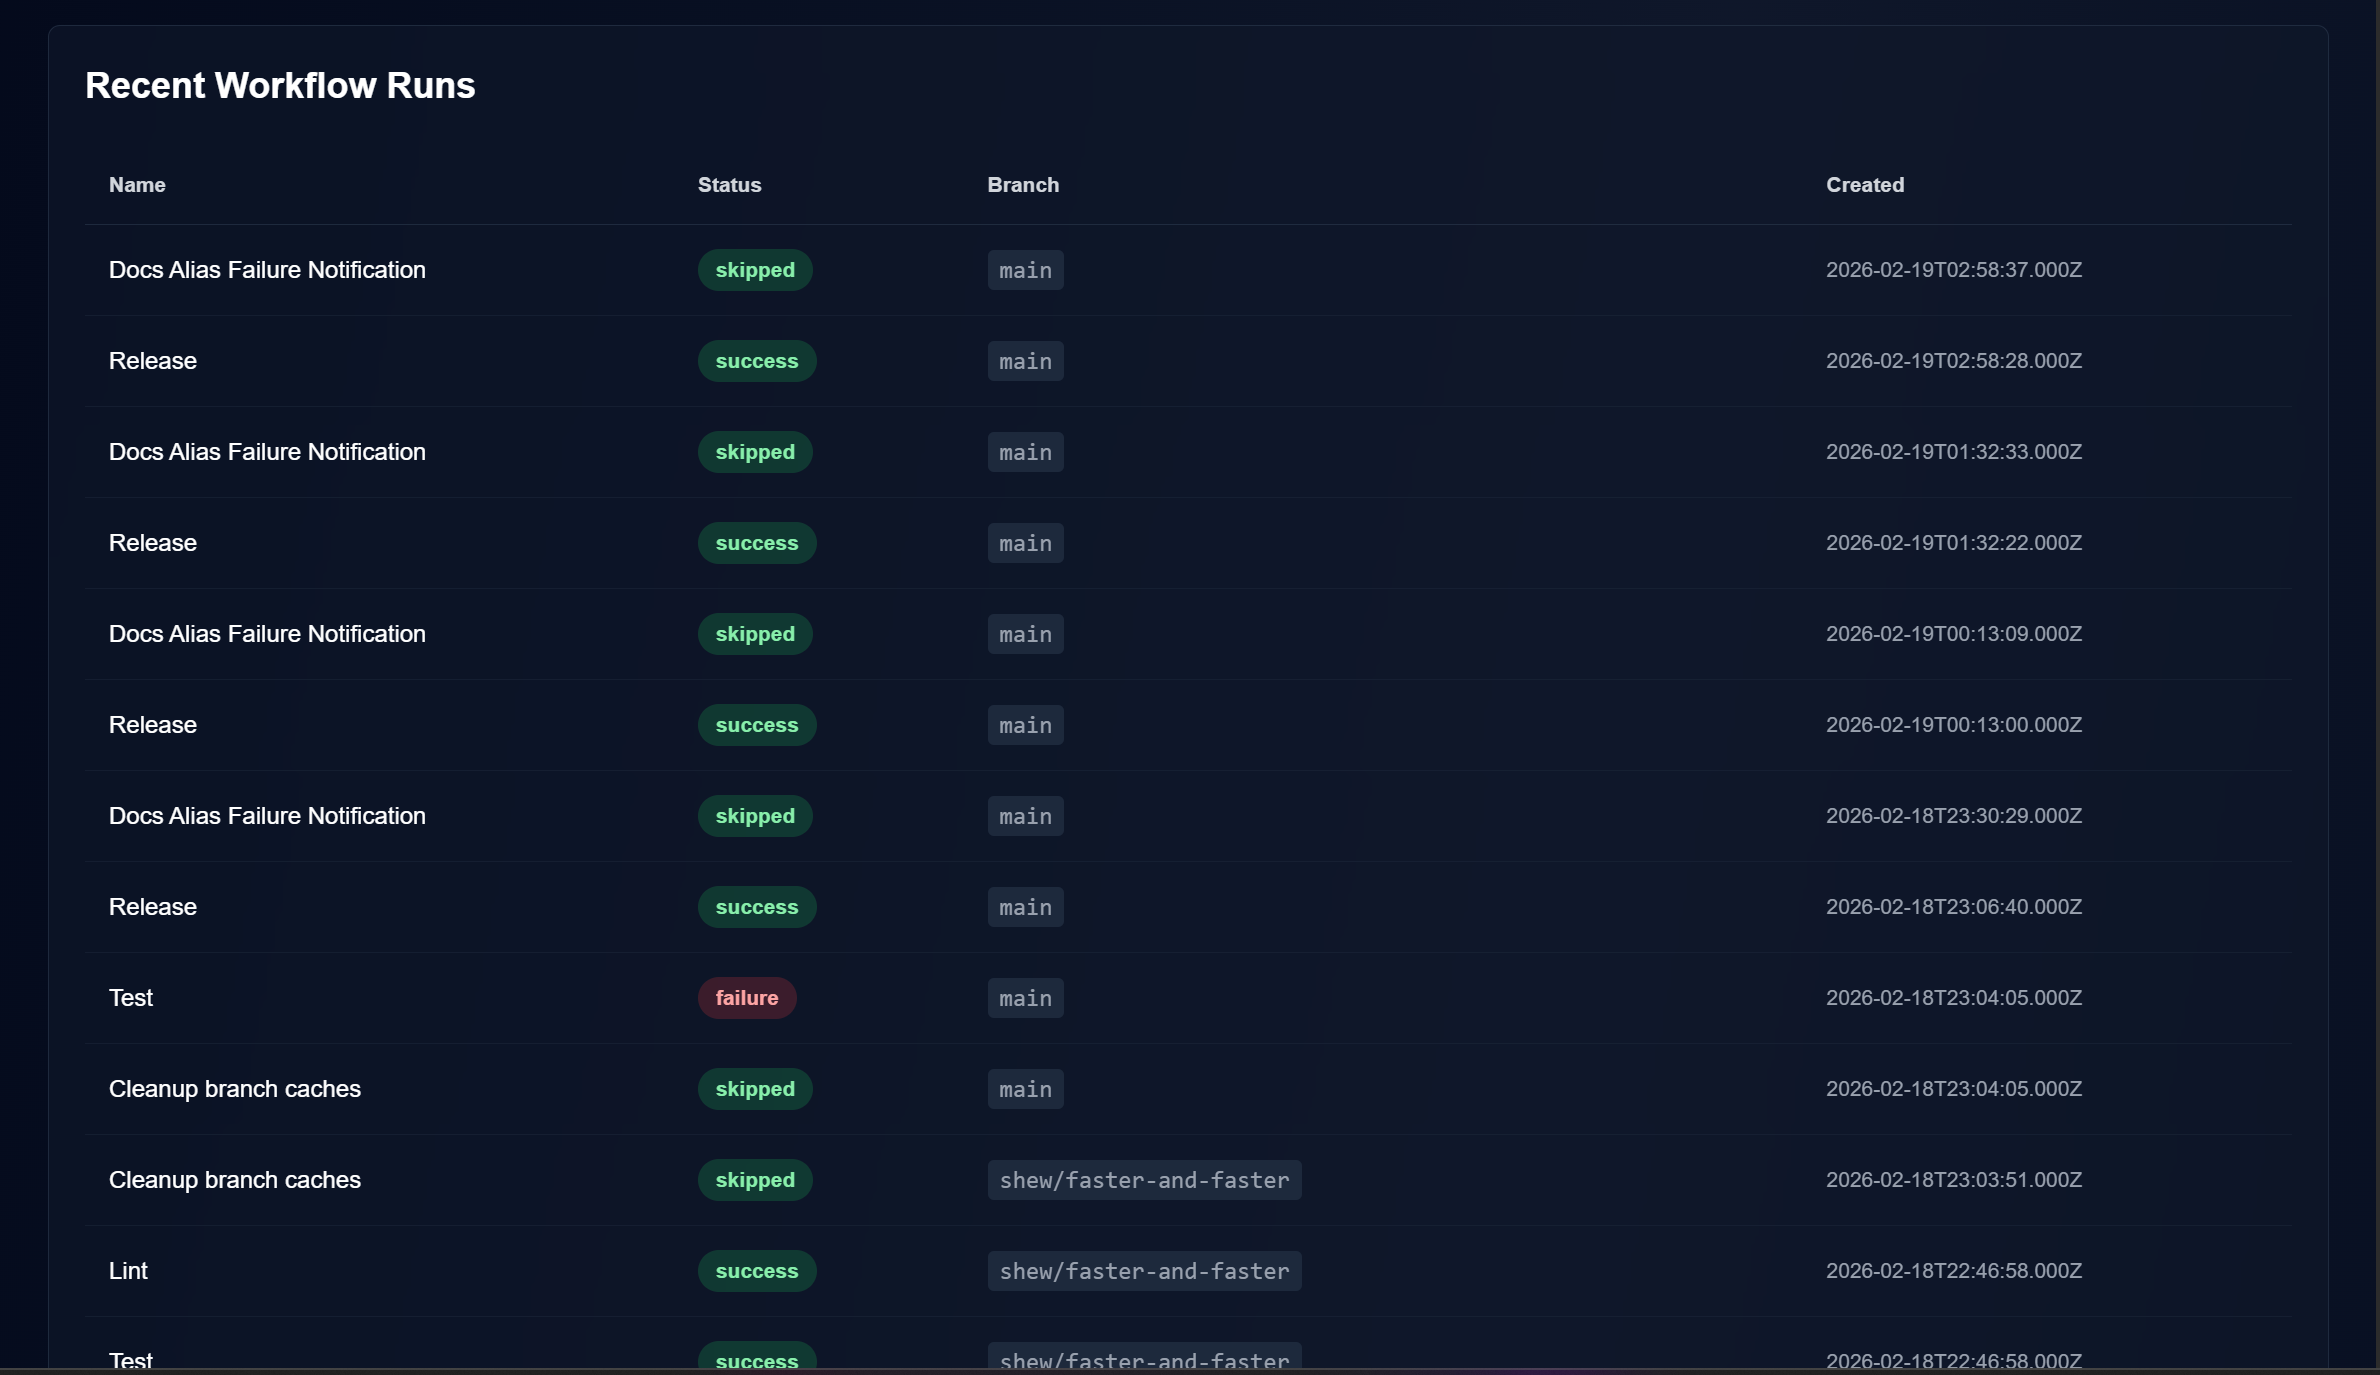
Repo build Table
-
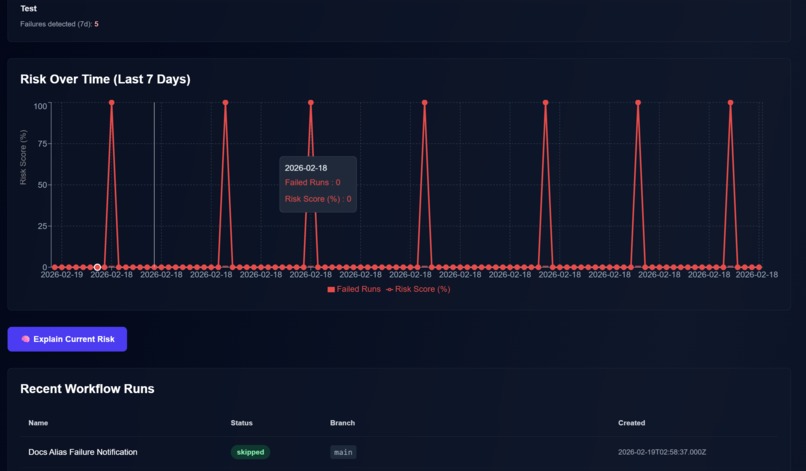
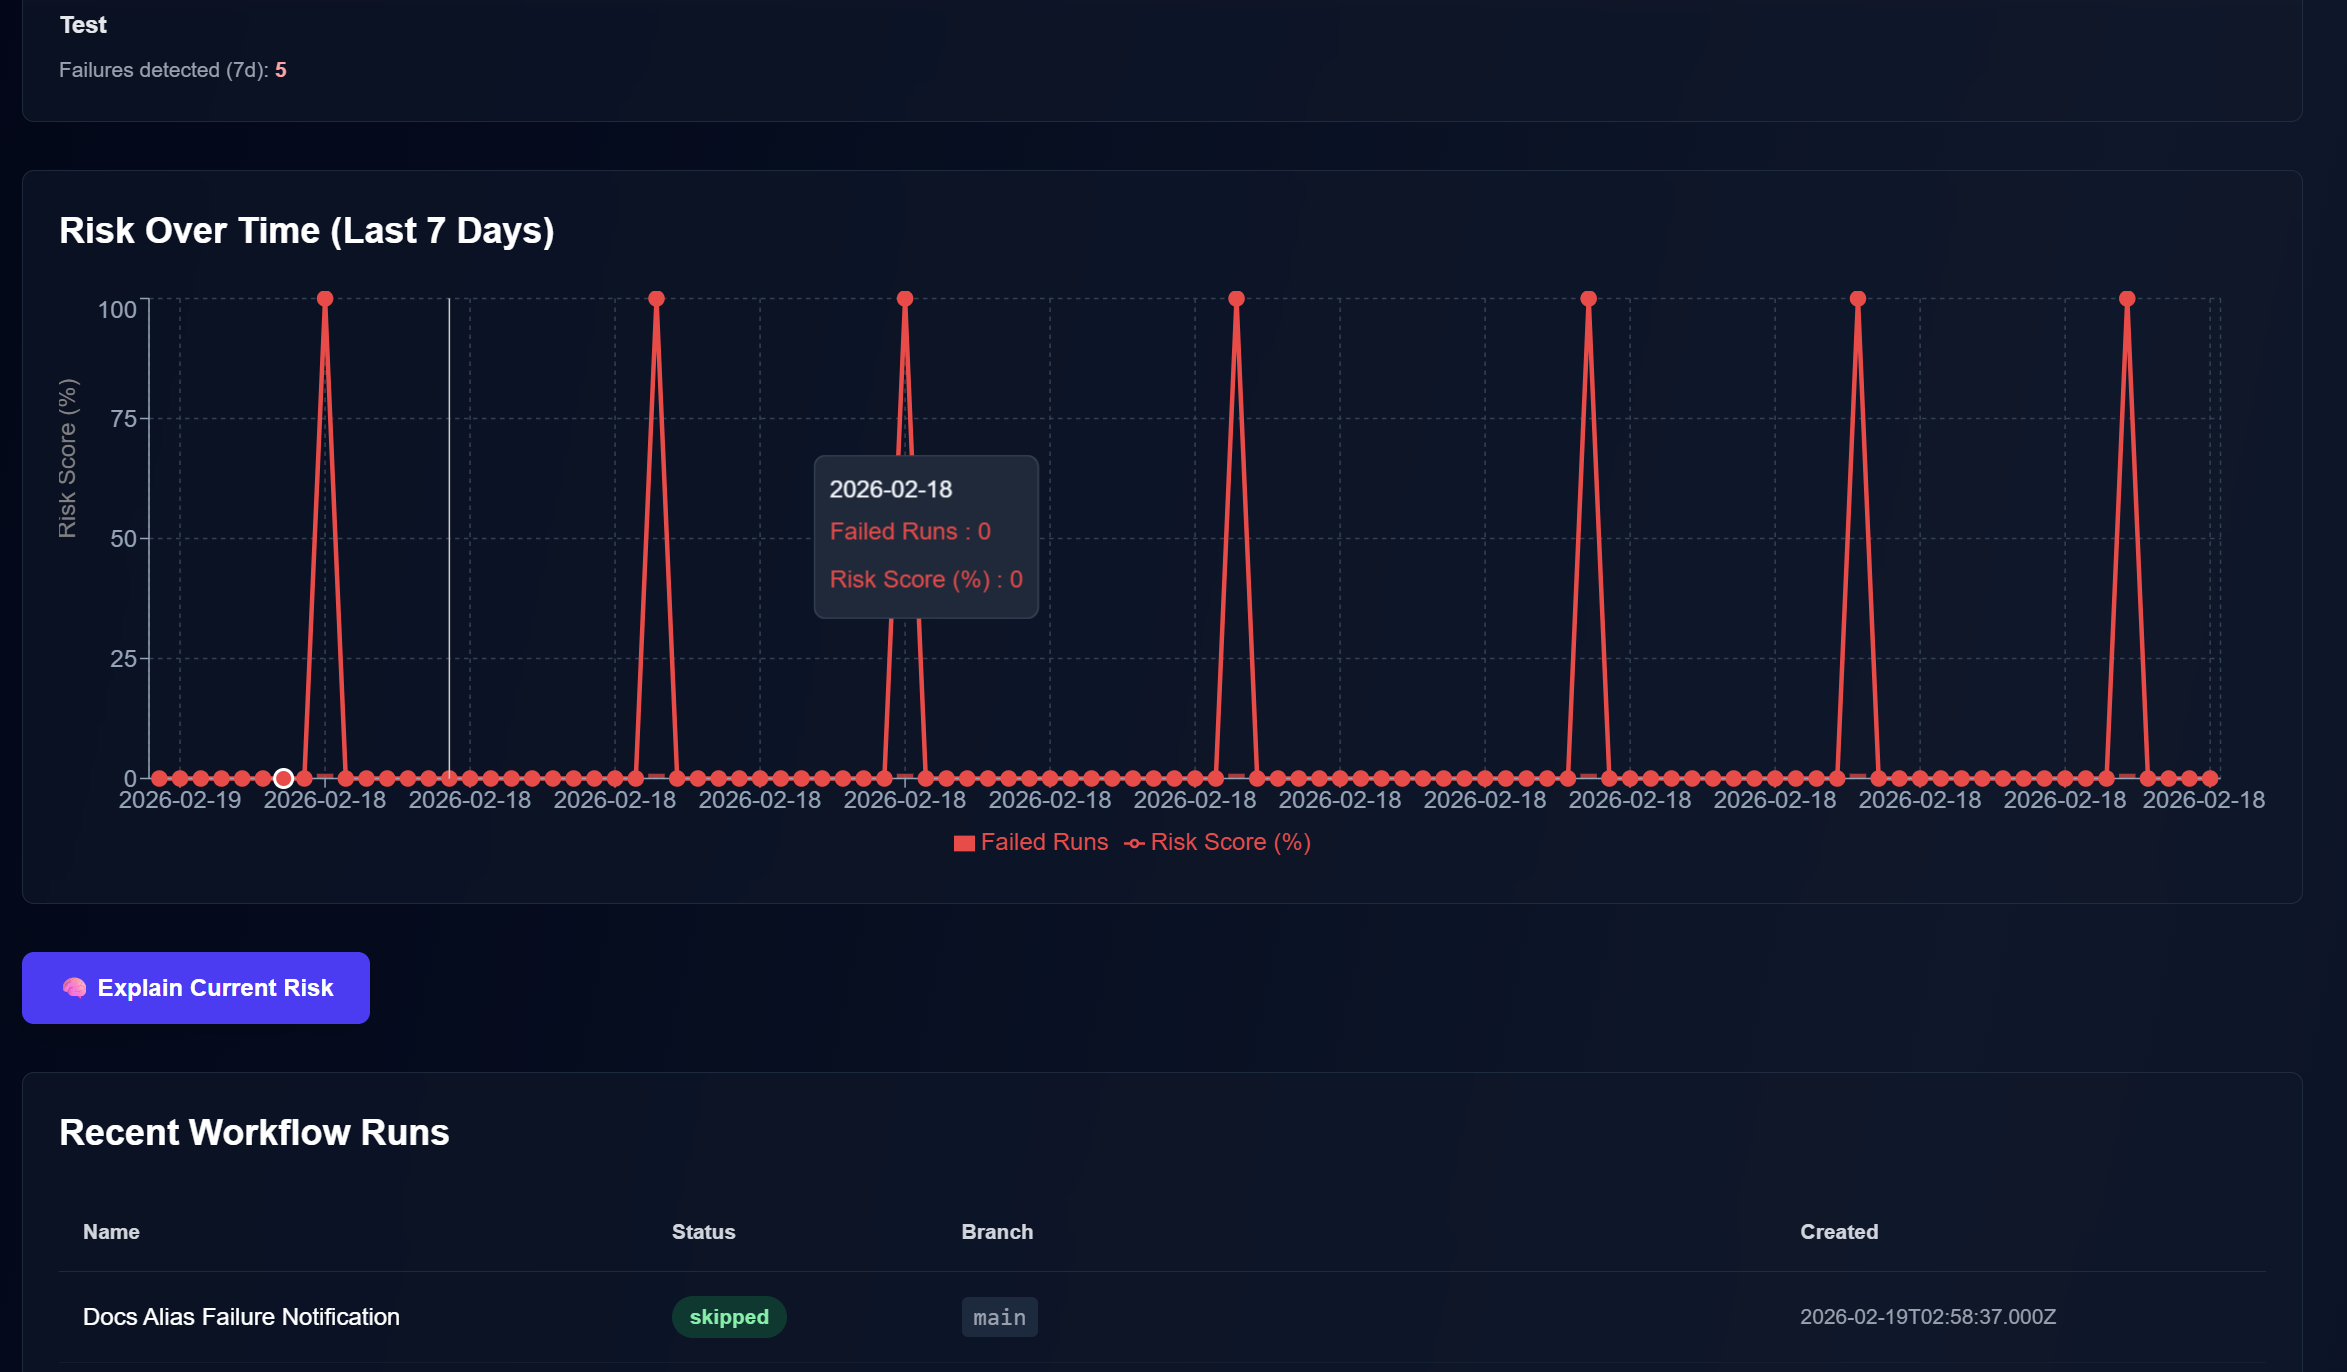
Visualization graph of failed bulids
-
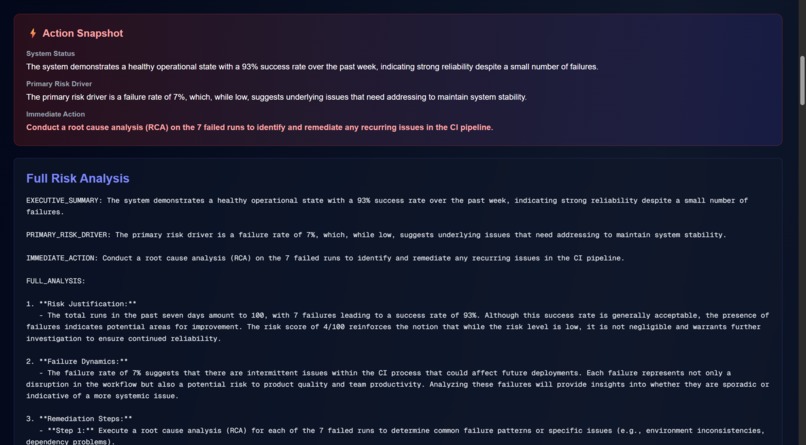
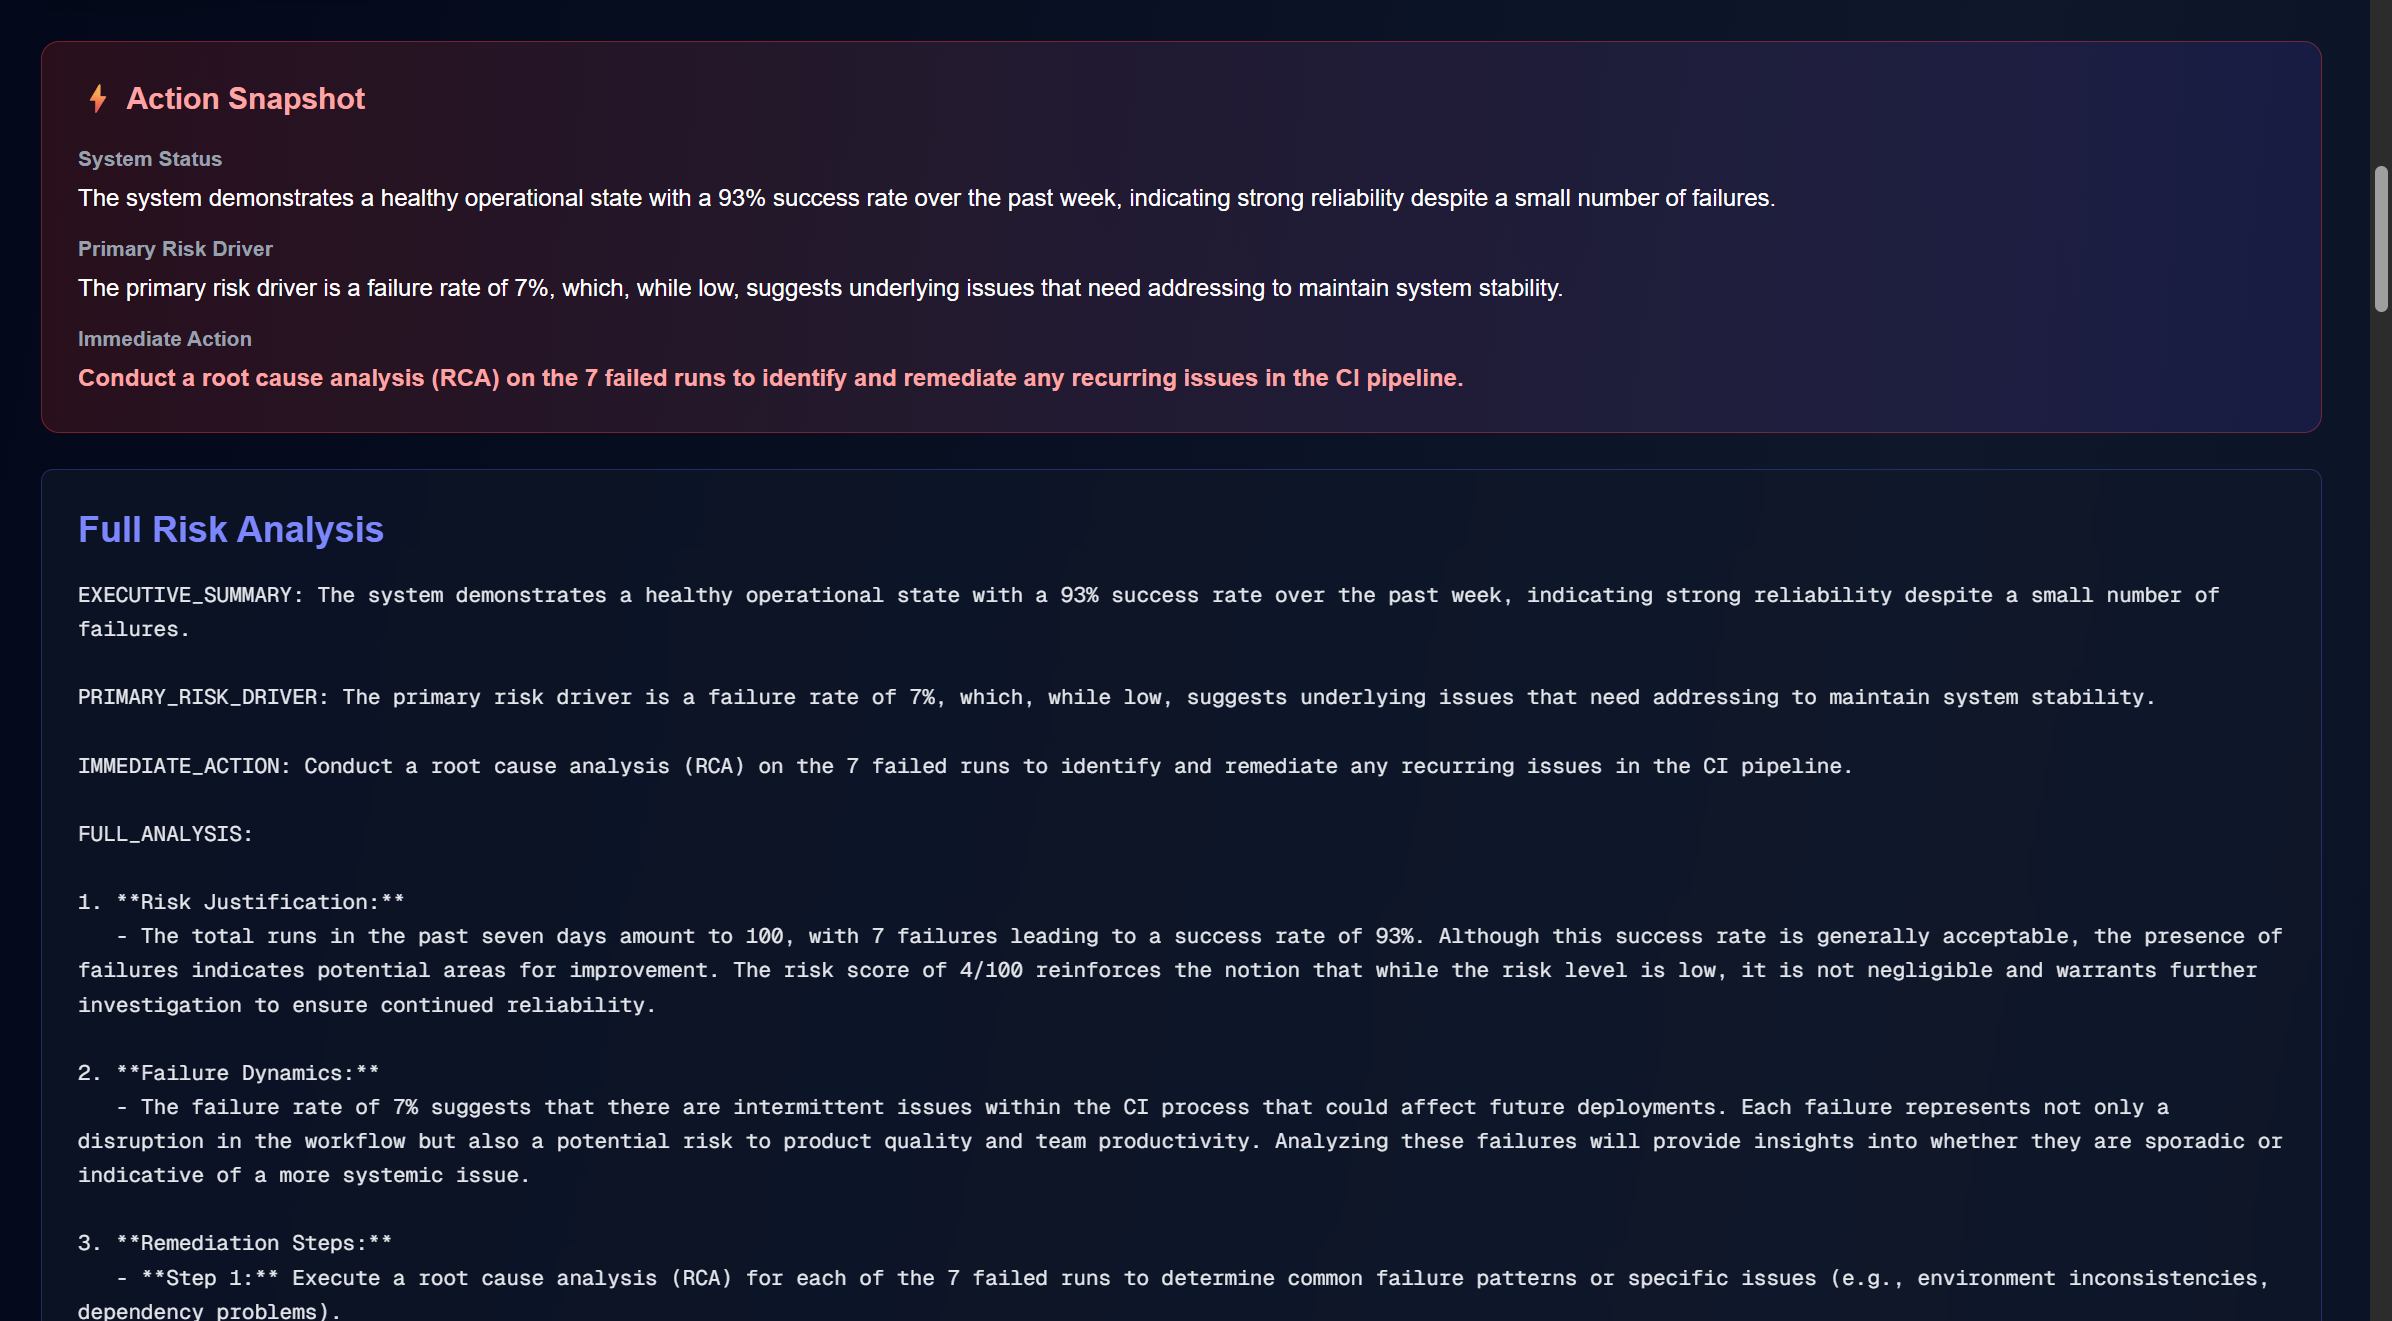
AI Analysis
-
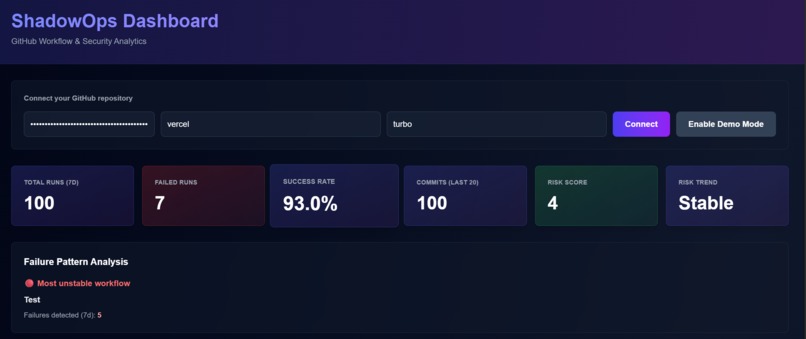
Risk score calculation
-
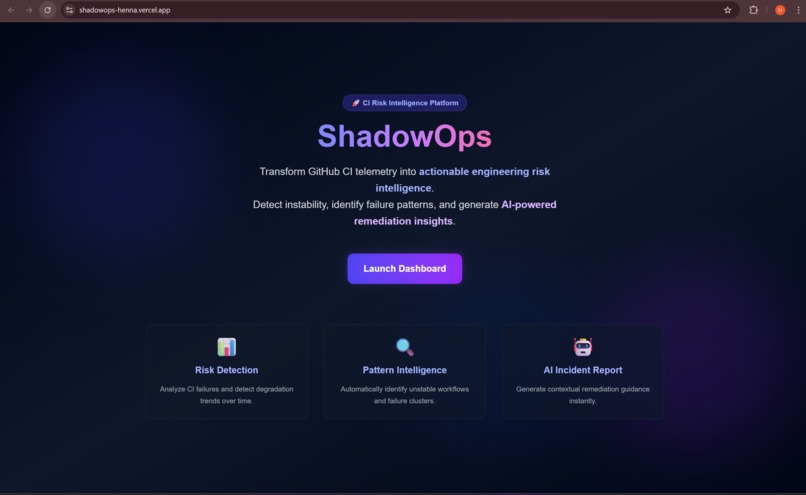
Homepage
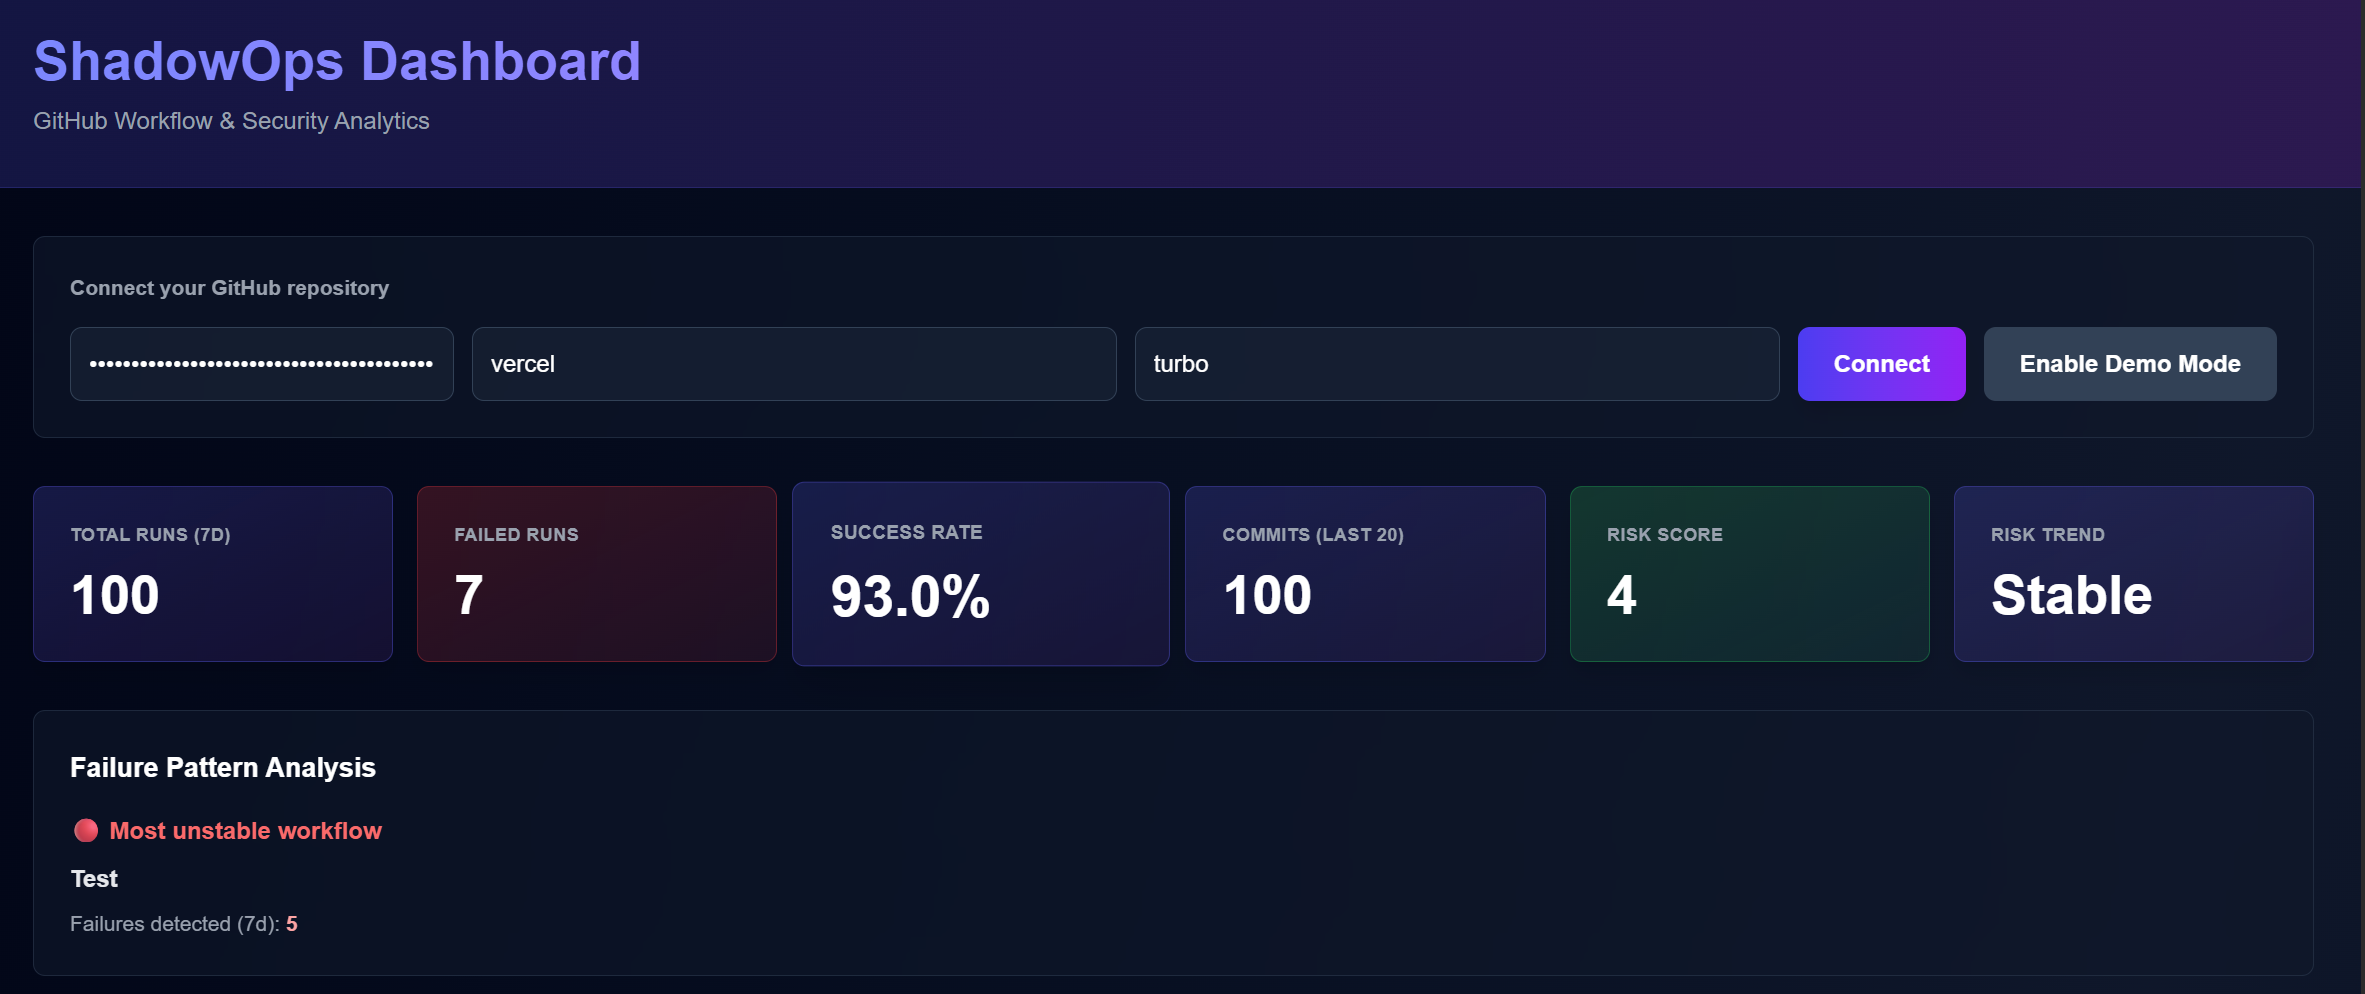
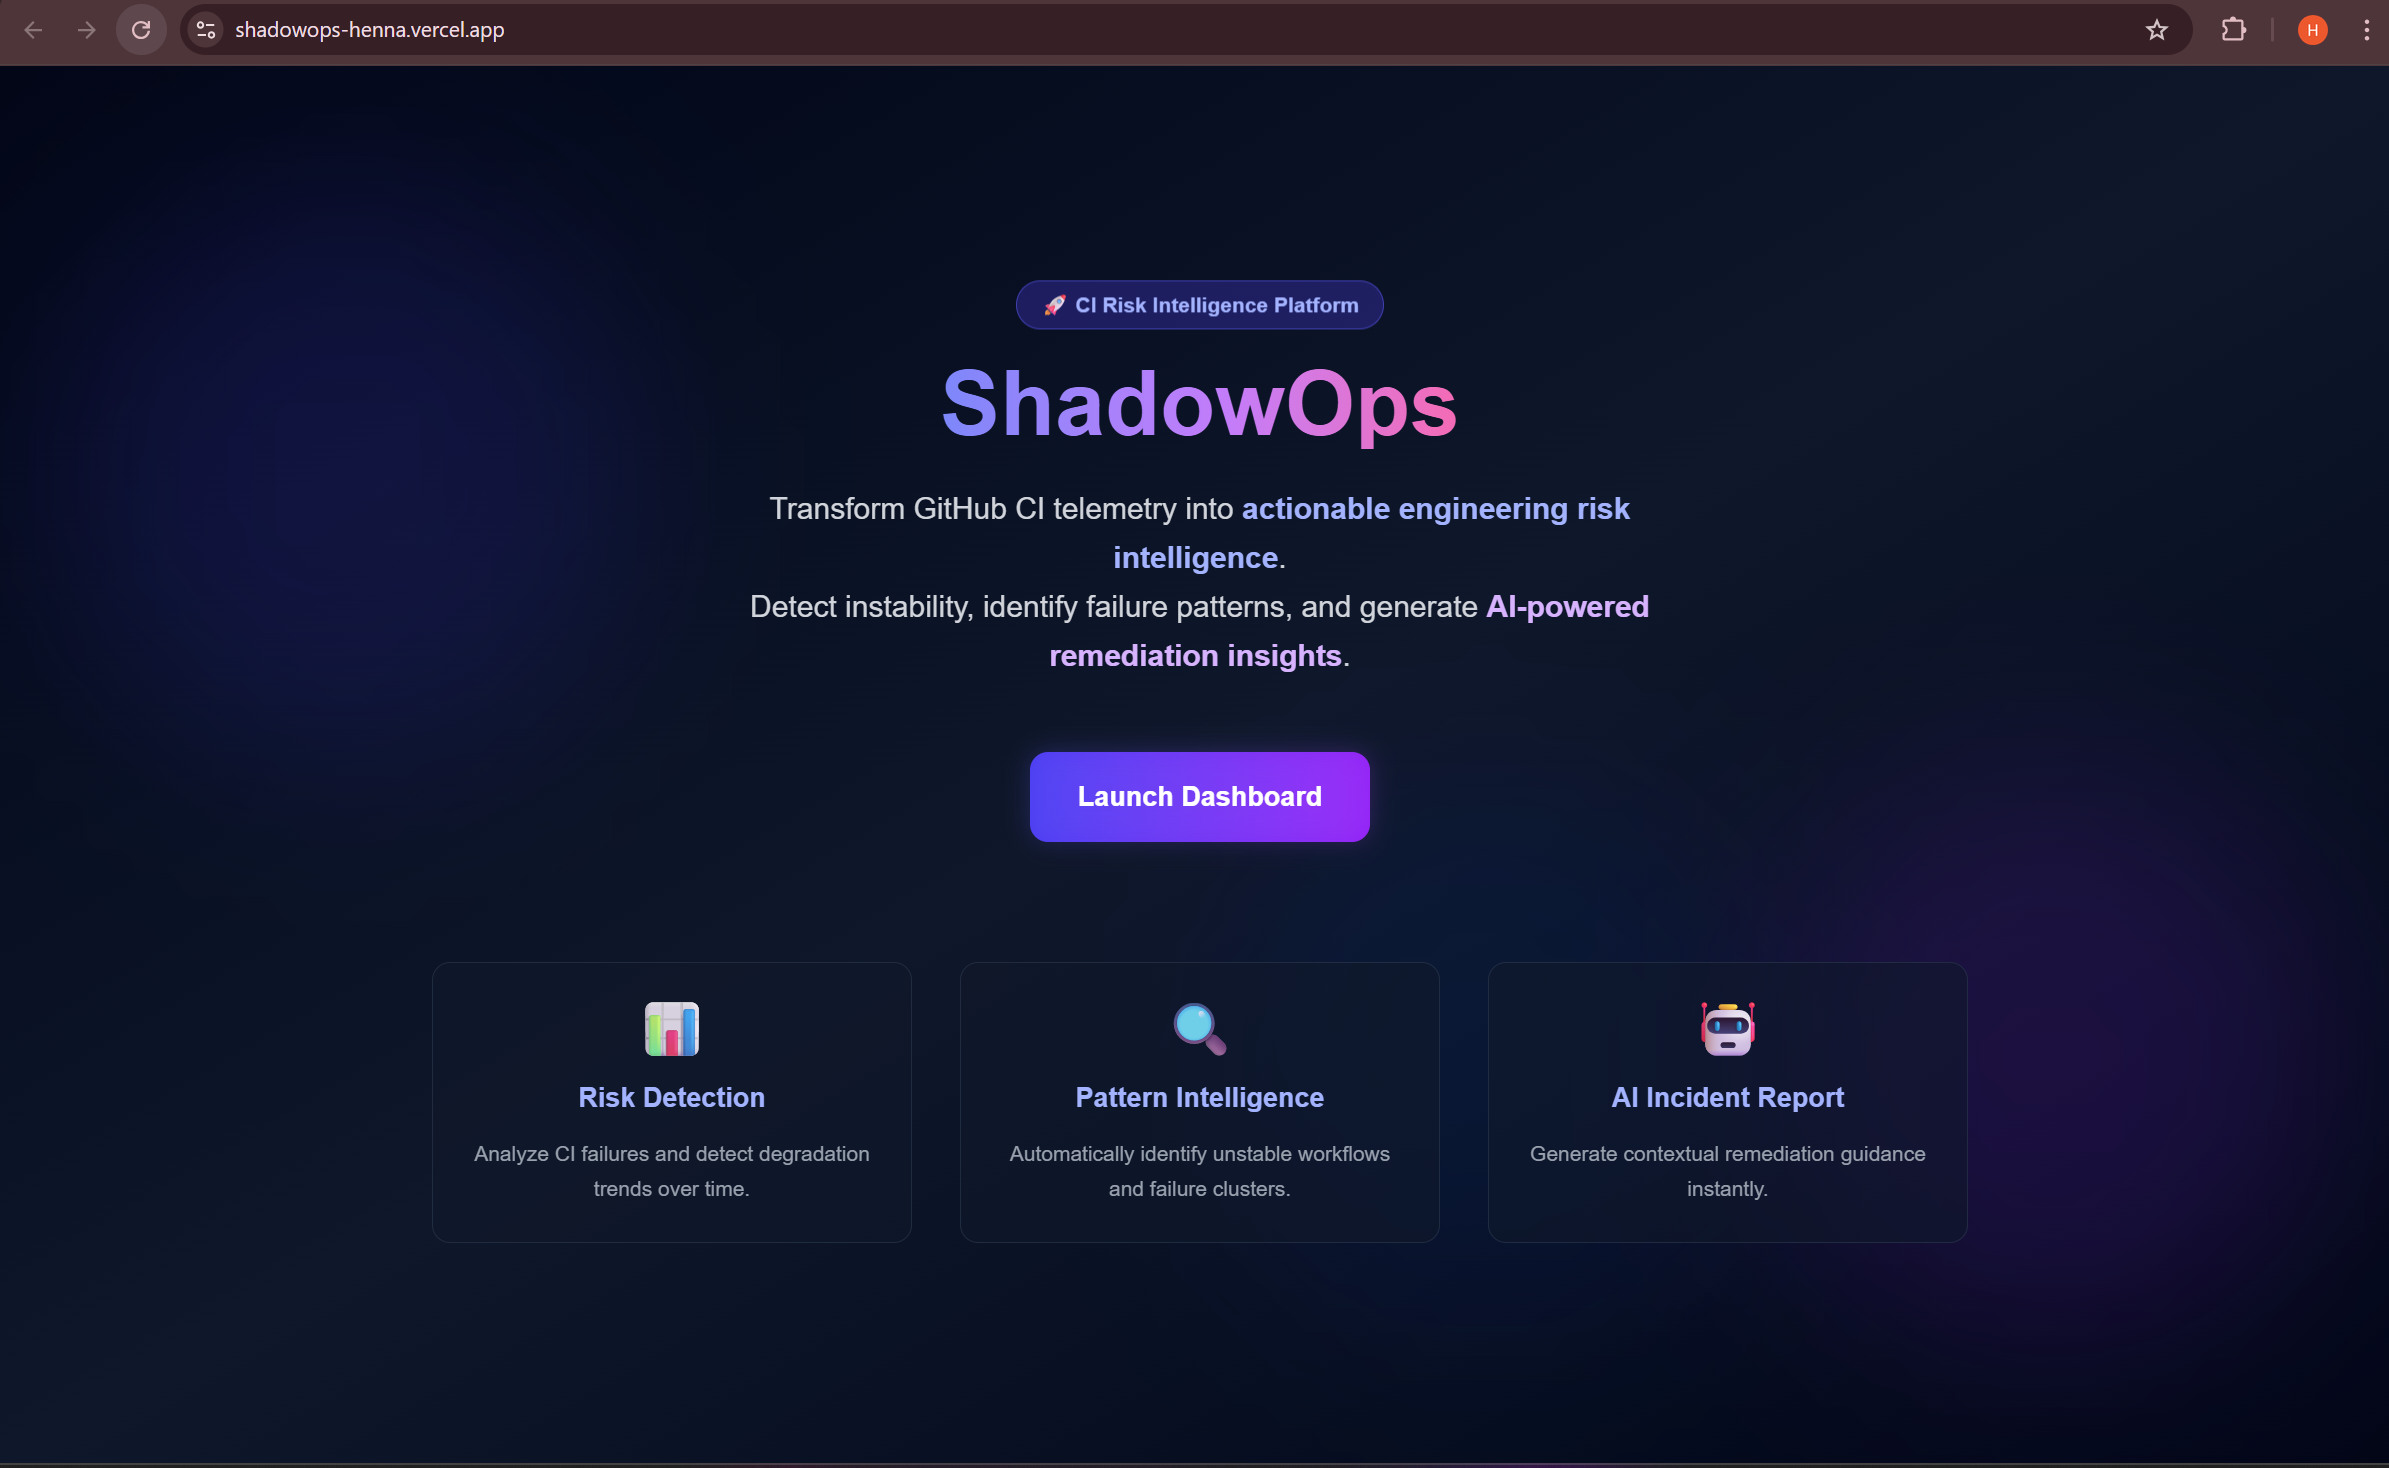
ShadowOps — Engineering Risk Intelligence for CI
Inspiration
Modern CI pipelines generate thousands of workflow executions, test results, and deployment logs — yet engineering teams still rely on manually scanning failures to understand system stability.
A single red build doesn’t necessarily indicate systemic instability. But repeated degradation patterns, failure streaks, and workflow clustering do.
The inspiration behind ShadowOps was simple:
What if CI telemetry could be transformed into a short-term engineering risk signal instead of raw failure counts?
Instead of reacting to isolated failures, teams could proactively detect degradation trends and understand risk momentum in real time.
What I Built
ShadowOps is a GitHub-integrated engineering risk intelligence dashboard that:
- Aggregates workflow runs over a rolling 7-day window
- Computes a deterministic Engineering Risk Score
- Detects consecutive failure streaks
- Identifies unstable workflow clusters
- Visualizes risk trends over time
- Generates AI-powered structured incident reports
The system transforms CI telemetry into an actionable signal.
How It Works
ShadowOps calculates a short-term risk score based on failure rate and streak momentum:
Risk Score = min( 100, (Failure Rate × 60) + (Failure Streak × 15) ) Where:
- Failure Rate = Failed Runs/ Total Runs
- Failure Streak = Consecutive recent failures
This model emphasizes:
- Sustained instability
- Recurring degradation patterns
- Momentum of failures
In addition to quantitative scoring, ShadowOps performs:
- Failure clustering by workflow name
- Trend direction detection (Increasing / Decreasing / Stable)
- AI-driven incident interpretation
The AI layer does not compute risk — it contextualizes it.
Tech Stack
- Next.js (App Router)
- TypeScript
- GitHub REST API
- OpenAI GPT-4o-mini
- Recharts (visualization)
- TailwindCSS
- Vercel (deployment)
What We Learned
Building ShadowOps highlighted several key insights:
Raw telemetry is not intelligence.
Metrics must be transformed into interpretable signals.Risk is temporal.
A single failure is noise. A streak is signal.Pattern detection matters more than count.
Identifying which workflow repeatedly fails is more valuable than total failures.AI works best when paired with deterministic logic.
The risk score is computed mathematically, while AI explains its implications.
Challenges We Faced
1. CI Data Compression
Large repositories run workflows frequently, causing recent runs to cluster within a single day. We resolved this by expanding the historical window and grouping runs by normalized ISO dates.
2. Designing a Meaningful Risk Formula
Balancing failure rate and streak weighting required iteration. The final model prioritizes degradation momentum without overreacting to isolated failures.
3. AI Output Control
Generic AI responses weakened impact. We improved prompt structure to generate deterministic, executive-style incident reports.
4. Demonstration Consistency
Stable repositories rarely show degradation. We introduced a controlled Demo Mode to simulate realistic CI instability for presentation purposes.
Impact
ShadowOps reframes CI monitoring:
From:
“Did something fail?”
To:
“Is the engineering system degrading?”
It introduces an intelligence layer between CI telemetry and engineering decision-making.
Future Scope
- Multi-repository monitoring
- Slack / Teams risk alerts
- Dependency vulnerability correlation
- Predictive degradation modeling
- Historical analytics beyond 7 days
- Cross-team engineering risk heatmaps
It represents a shift from reactive debugging to proactive engineering risk intelligence.
Built With
- api
- github
- gpt-4o-mini
- next.js
- openai
- recharts
- rest
- tailwindcss
- typescript
- vercel
