-
-
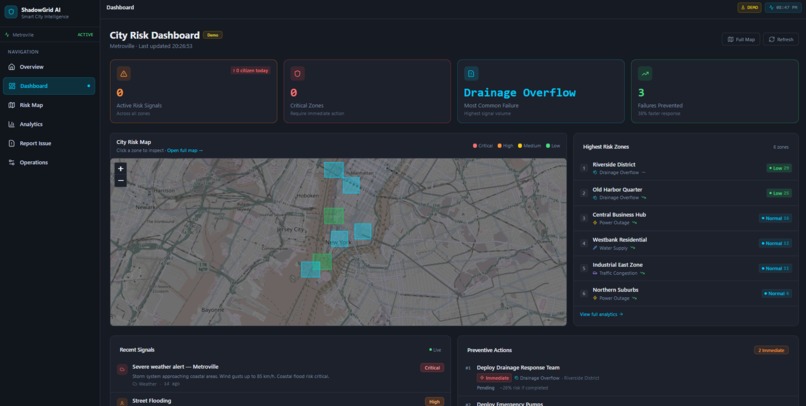
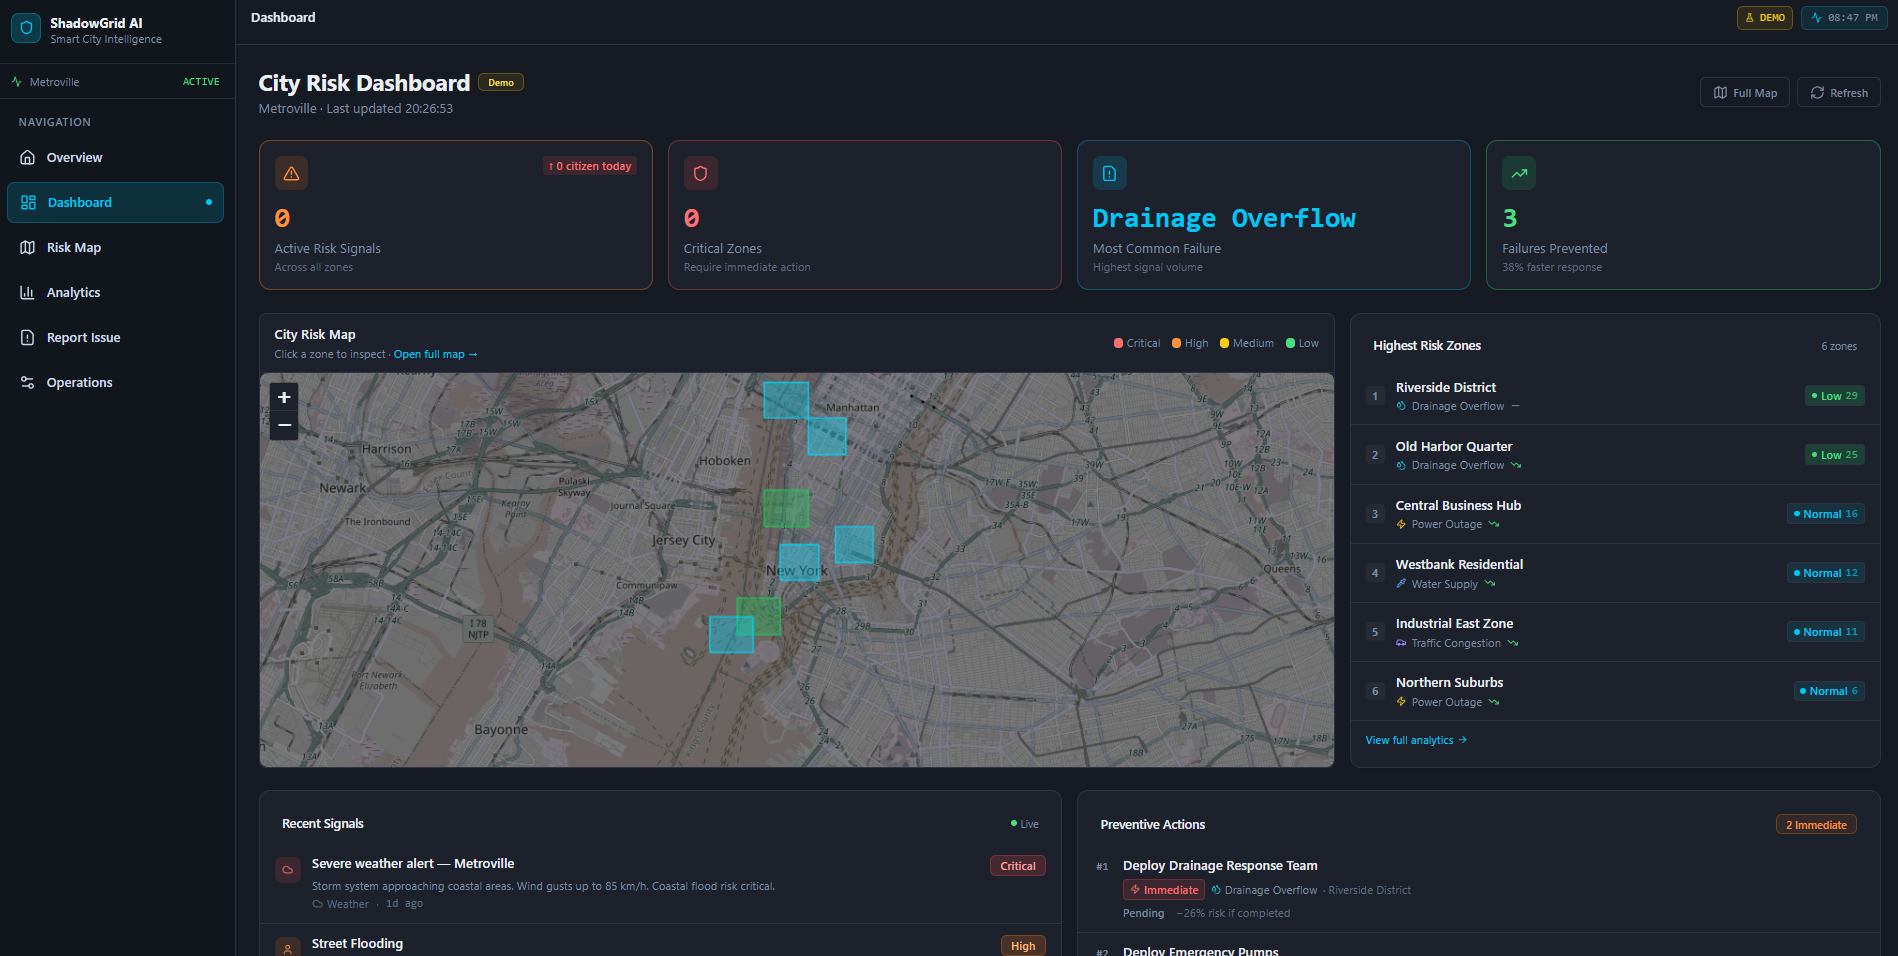
Dashboard
-
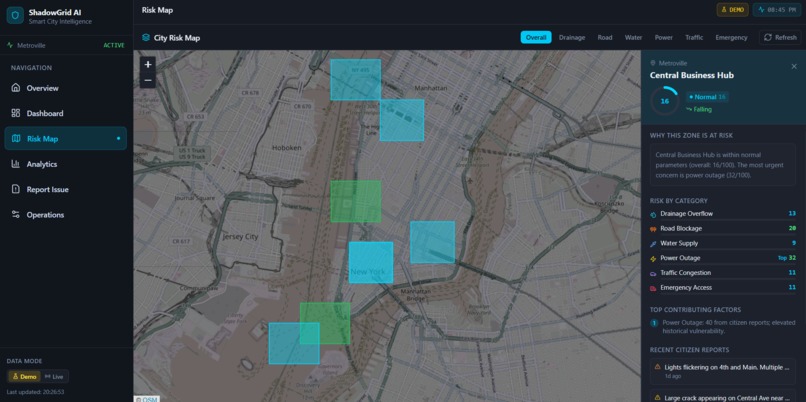
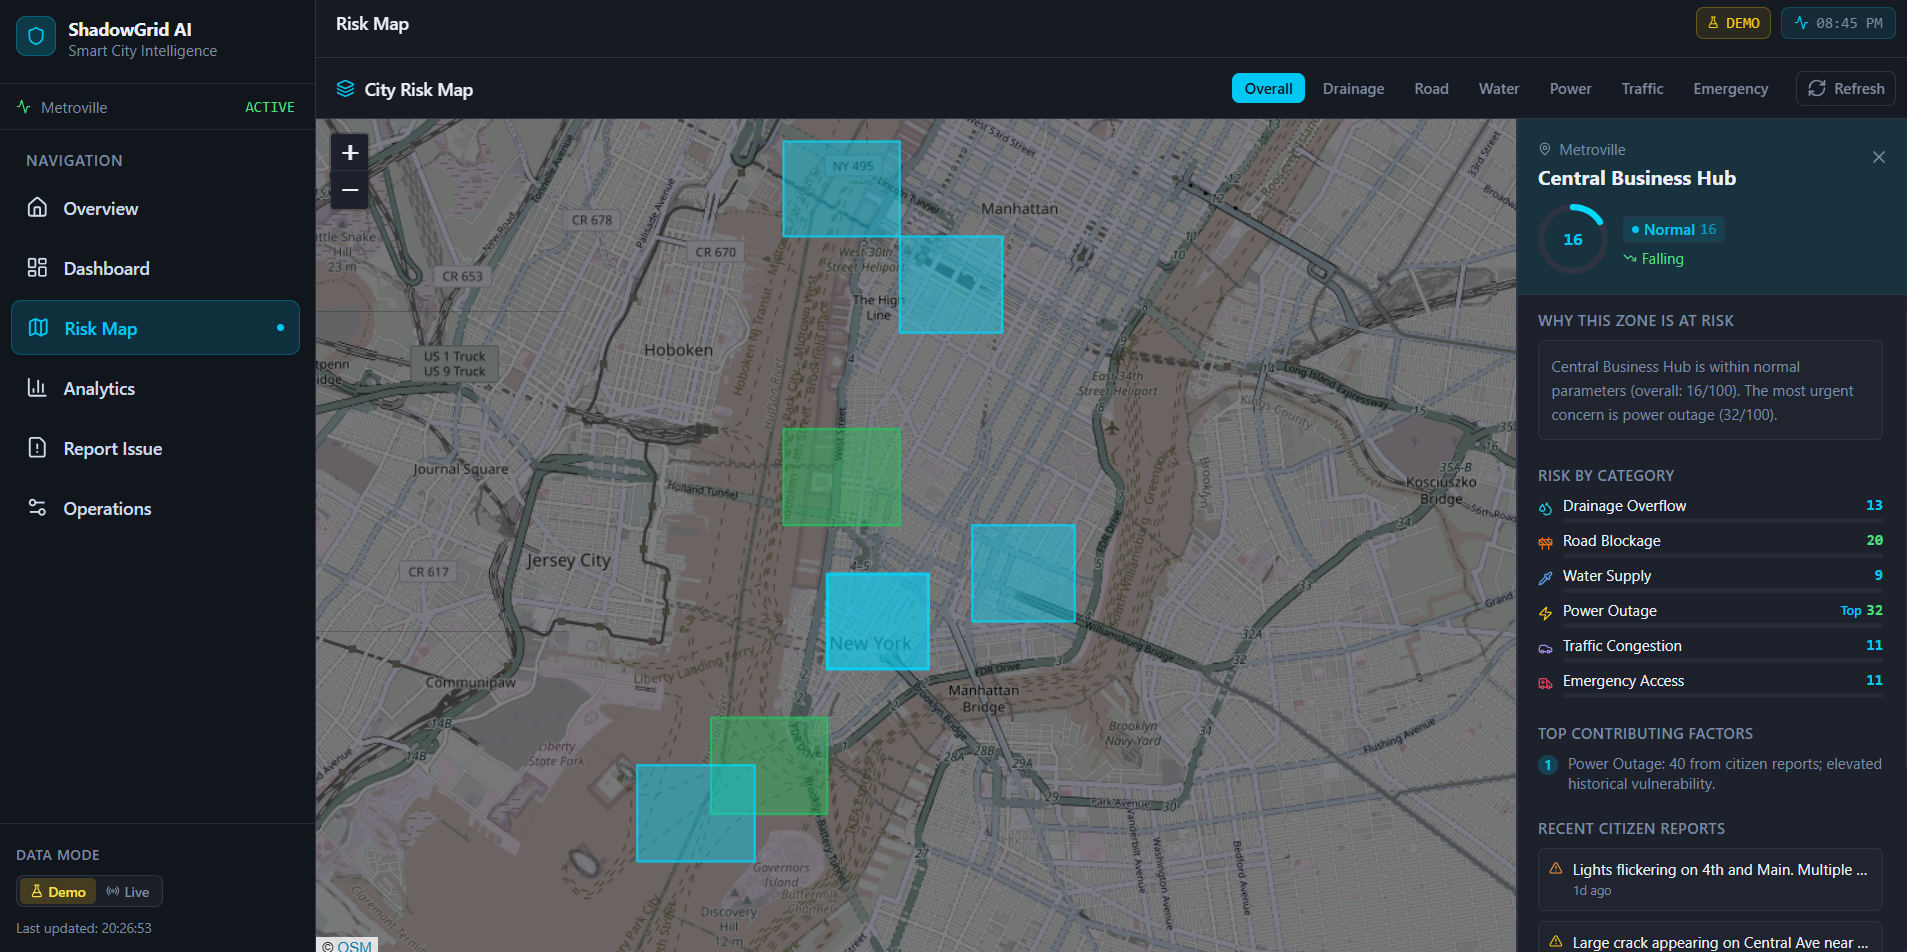
Risk Map
-
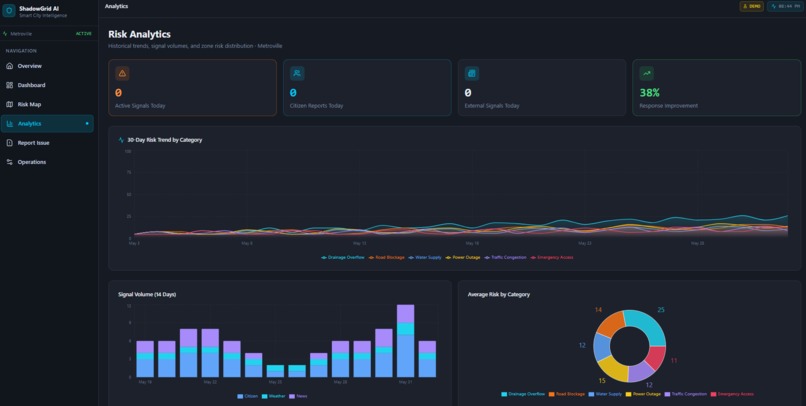
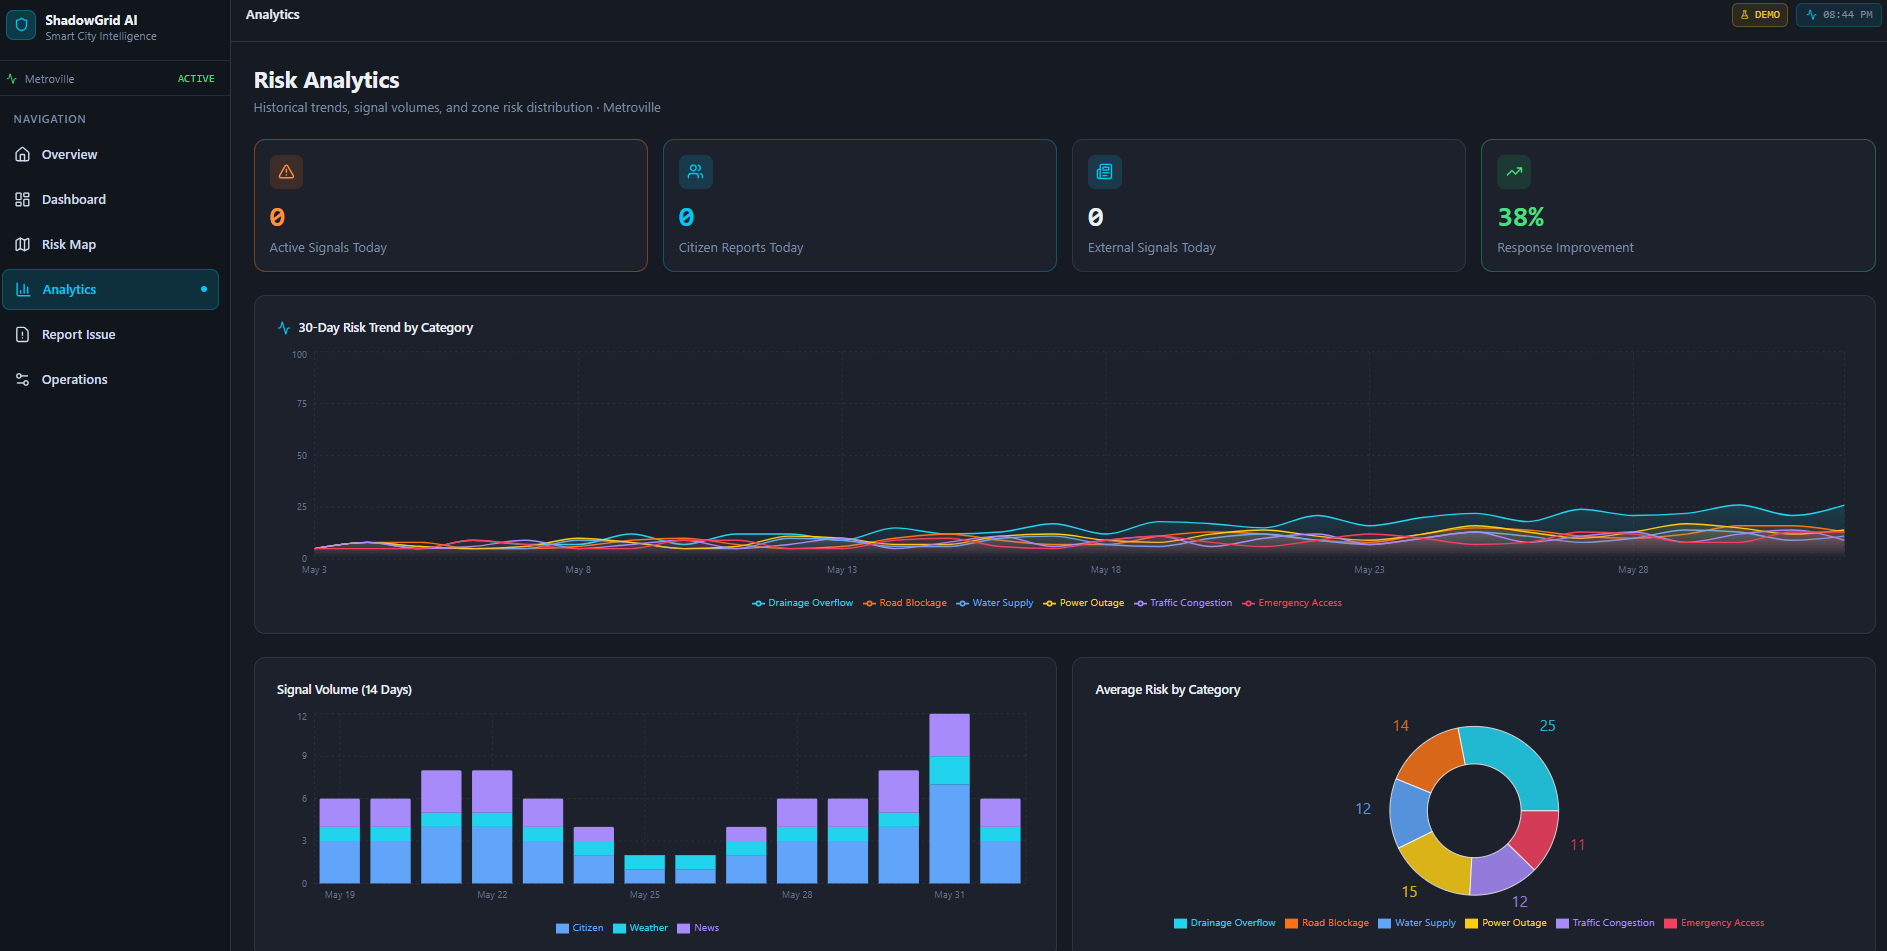
Analytics
-
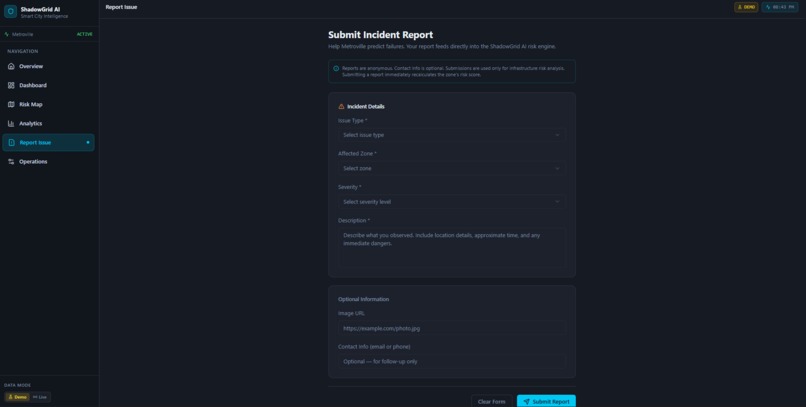
Report Issue
-
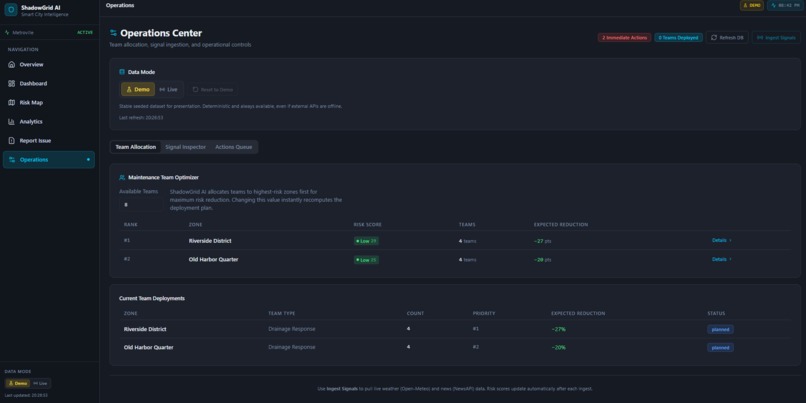
Operations
Inspiration
ShadowGrid AI was inspired by a simple but important problem: cities usually respond after infrastructure failures happen, not before. A blocked drain, a power fluctuation, or rising congestion may seem like small isolated issues, but they often become much bigger emergencies if no one connects the signals early. We wanted to build a system that could bring those scattered warnings together and turn them into something actionable.
What motivated us most was the gap between available data and actual decision-making. Weather alerts, citizen complaints, and public incident reports already exist, but they usually live in different places. Our idea was to combine those signals into one platform that helps city operators understand which zone is at risk, why it is at risk, and what should be done first.
What it does
ShadowGrid AI is a predictive smart city failure intelligence platform. It analyzes signals such as citizen reports, weather conditions, public incident signals, and nearby zone influence to estimate infrastructure risk across different city zones.
The platform shows these insights on an interactive dashboard and risk map. Users can explore zone-level risk, view likely failure chains, read plain-language explanations, and see recommended preventive actions. We also added a live/demo data system so the project can be presented reliably in demo mode while still proving that it can ingest and work with real-world signals in live mode.
How we built it
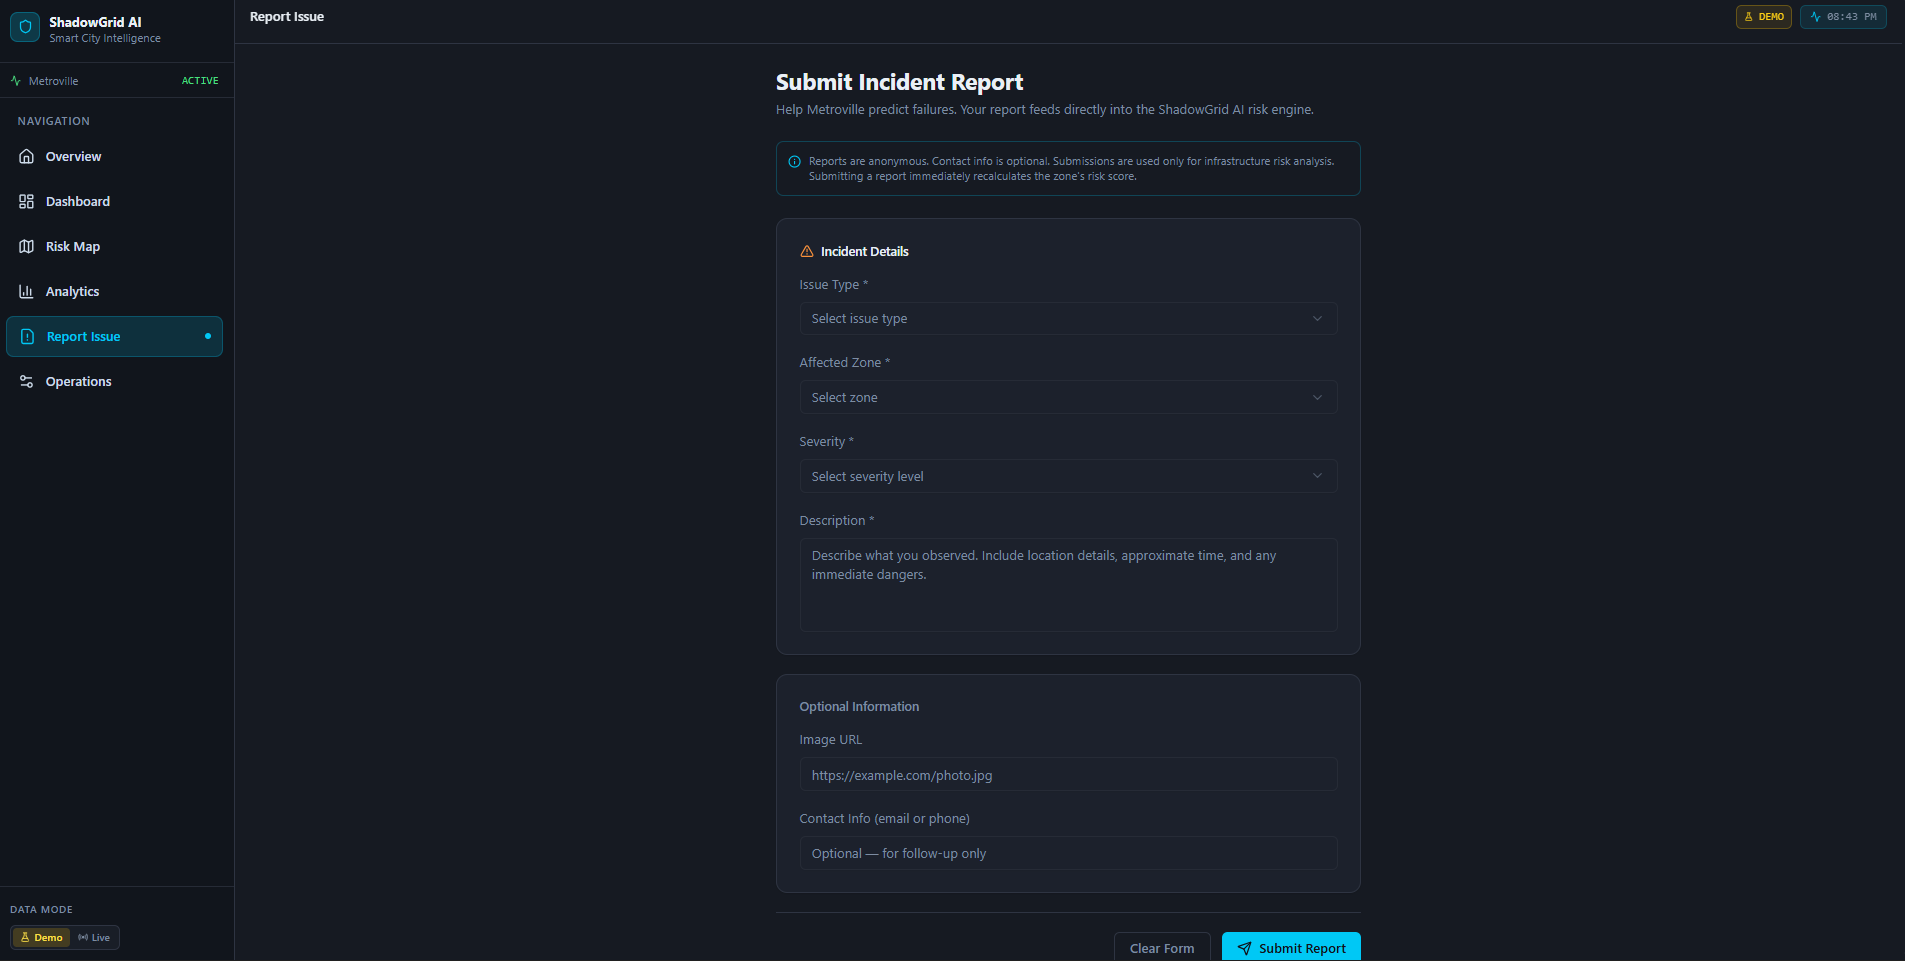
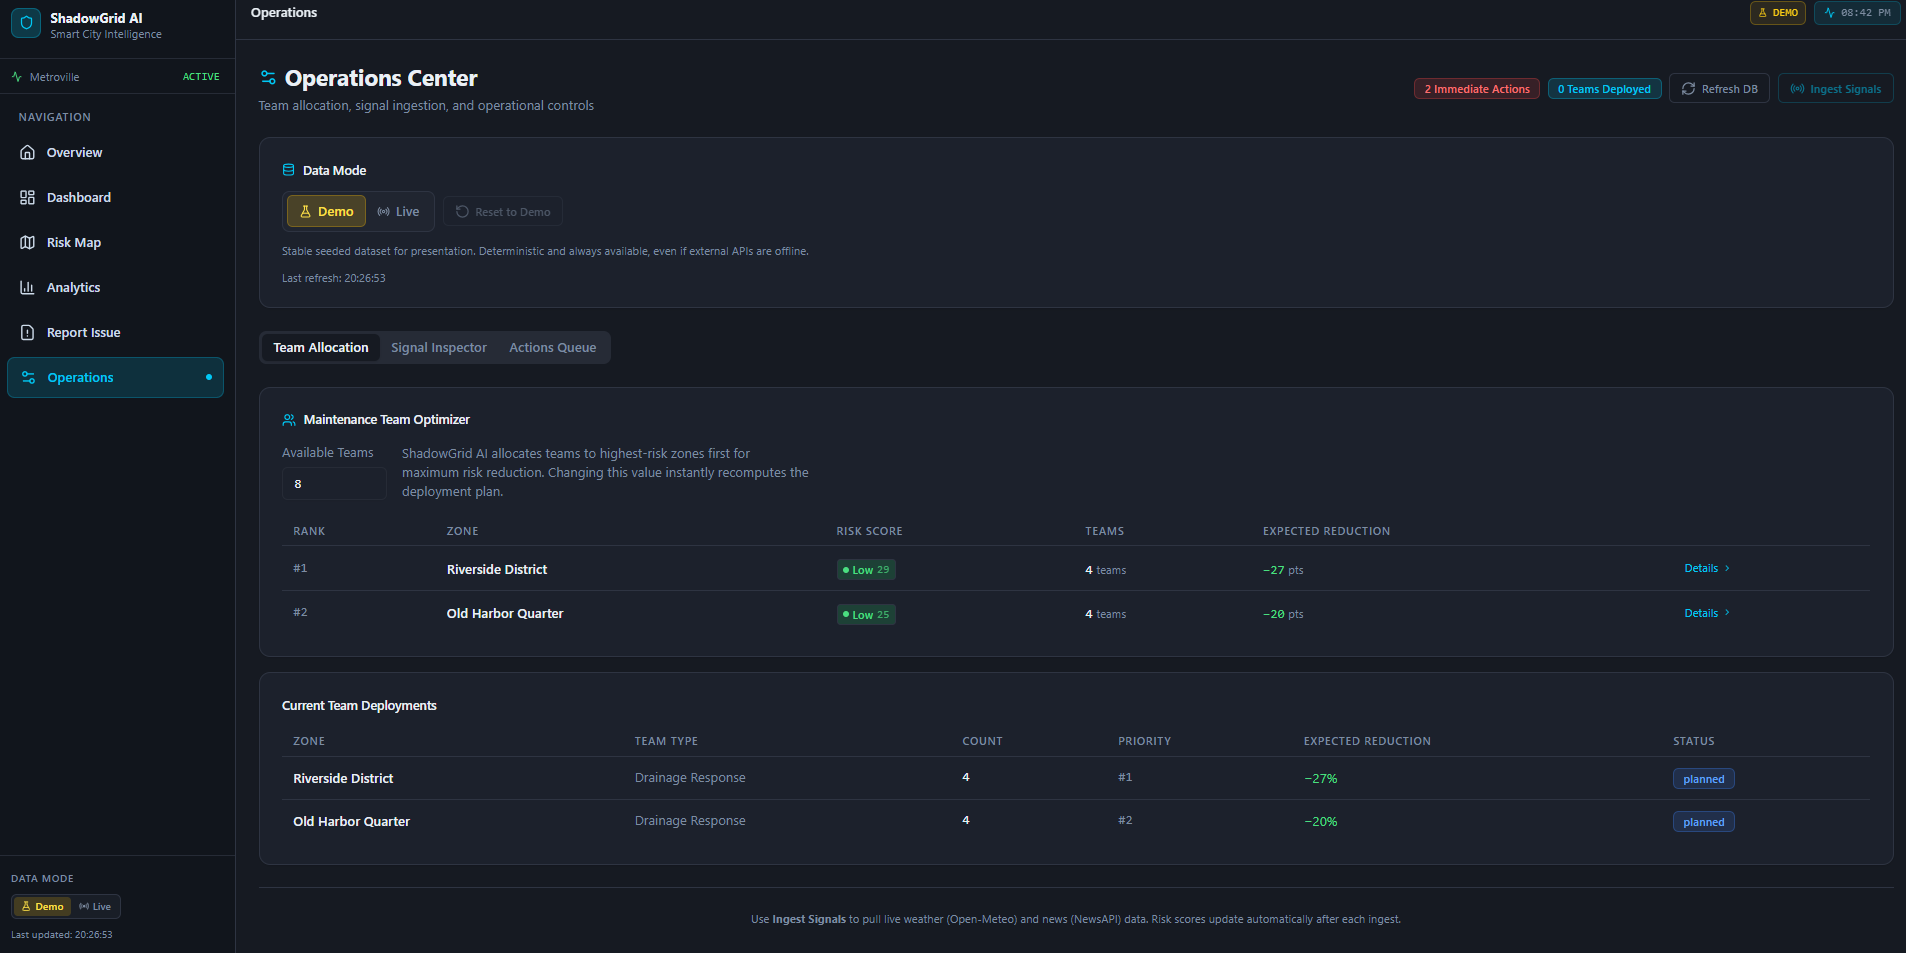
We built ShadowGrid AI as a full-stack web application with a strong focus on usability, explainability, and demo reliability. The frontend was designed as a smart city operations dashboard with interactive pages for the landing view, dashboard, risk map, analytics, reporting, and operations control.
On the backend and data side, we used a database-backed structure to manage zones, signals, reports, scores, recommendations, and failure chains. We created a risk scoring engine that combines multiple weighted inputs like citizen reports, weather severity, public signals, historical trends, and nearby zone propagation. We also added live data ingestion and separated demo and live datasets so the system could support both stable presentations and real data testing.
To strengthen the AI aspect of the project, we added an LLM explanation layer to turn structured risk data into human-readable summaries, and an NLP news classifier to better understand and categorize public incident reports from news sources.
Challenges we ran into
One of the biggest challenges was balancing realism with reliability. Live data is exciting, but hackathon demos also need to be stable. If an external API fails during a presentation, the whole experience can break. To solve that, we designed the platform to support both demo and live modes, with separate datasets stored in the database.
Another challenge was making the system feel intelligent without becoming a black box. We did not want to show random risk scores without context. Every score, recommendation, and failure chain needed to be explainable and easy to understand. That required careful thinking around the scoring logic, propagation model, and explanation design.
We also had to make sure the UI could handle a lot of information without feeling overwhelming. Since the platform includes maps, signals, analytics, recommendations, and AI-generated summaries, organizing everything into a clean and intuitive experience was an important challenge.
Accomplishments that we're proud of
We are proud that ShadowGrid AI became more than just a visual dashboard. It is a working predictive platform that combines multiple types of data into one coherent system. We successfully built a risk engine, zone-based mapping, failure-chain simulation, recommendations, and a dual demo/live architecture that makes the project both stable and believable.
We are also proud of the explainability aspect. Instead of hiding the reasoning, the system helps users understand why a zone is risky and what action should be taken. Adding the LLM explanation layer and NLP news classifier also made the project feel much more complete and aligned with its AI-focused goal.
What we learned
This project taught us a lot about building systems that sit between raw data and real-world decision-making. We learned that technical intelligence alone is not enough, the system also has to be understandable and trustworthy for users.
We also learned how important data modeling and fallback design are when working with both seeded and live data. Building separate demo and live datasets forced us to think more carefully about persistence, state handling, and system behavior under failure conditions.
Most importantly, we learned that good product thinking matters just as much as engineering. A project with strong logic becomes far more effective when the user experience makes the value immediately clear.
What's next for ShadowGridAI
The next step for ShadowGrid AI is to make the platform even more realistic and scalable. We would like to integrate more live data sources, improve location mapping, and support richer infrastructure intelligence across larger city networks.
We also see strong potential for expanding the AI side of the system. Future versions could include stronger predictive modeling, richer natural-language summaries, anomaly detection, and more advanced incident classification. Beyond the hackathon, ShadowGrid AI could evolve into a practical decision-support platform for municipalities, emergency teams, and urban planners.
At its core, the vision stays the same: help cities move from reactive response to predictive resilience.
Built With
- gemini
- leaflet.js
- newsapi
- open-meteo
- react
- recharts
- shadcn
- supabase
- tailwind
- typescript
- vercel
- vite

Log in or sign up for Devpost to join the conversation.