-
-
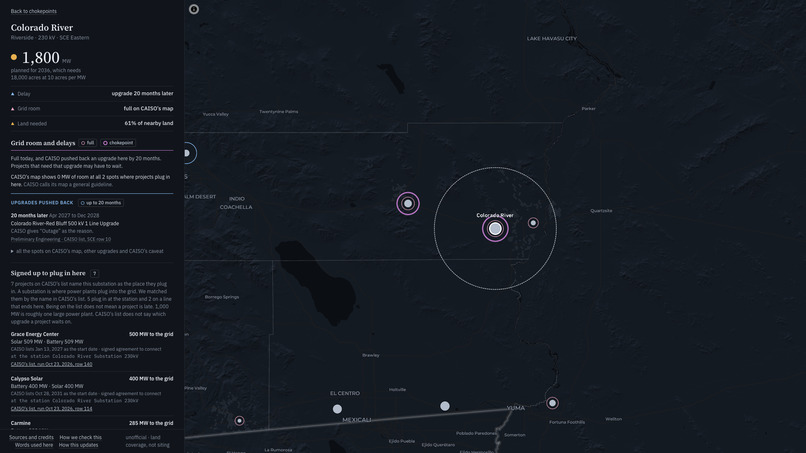
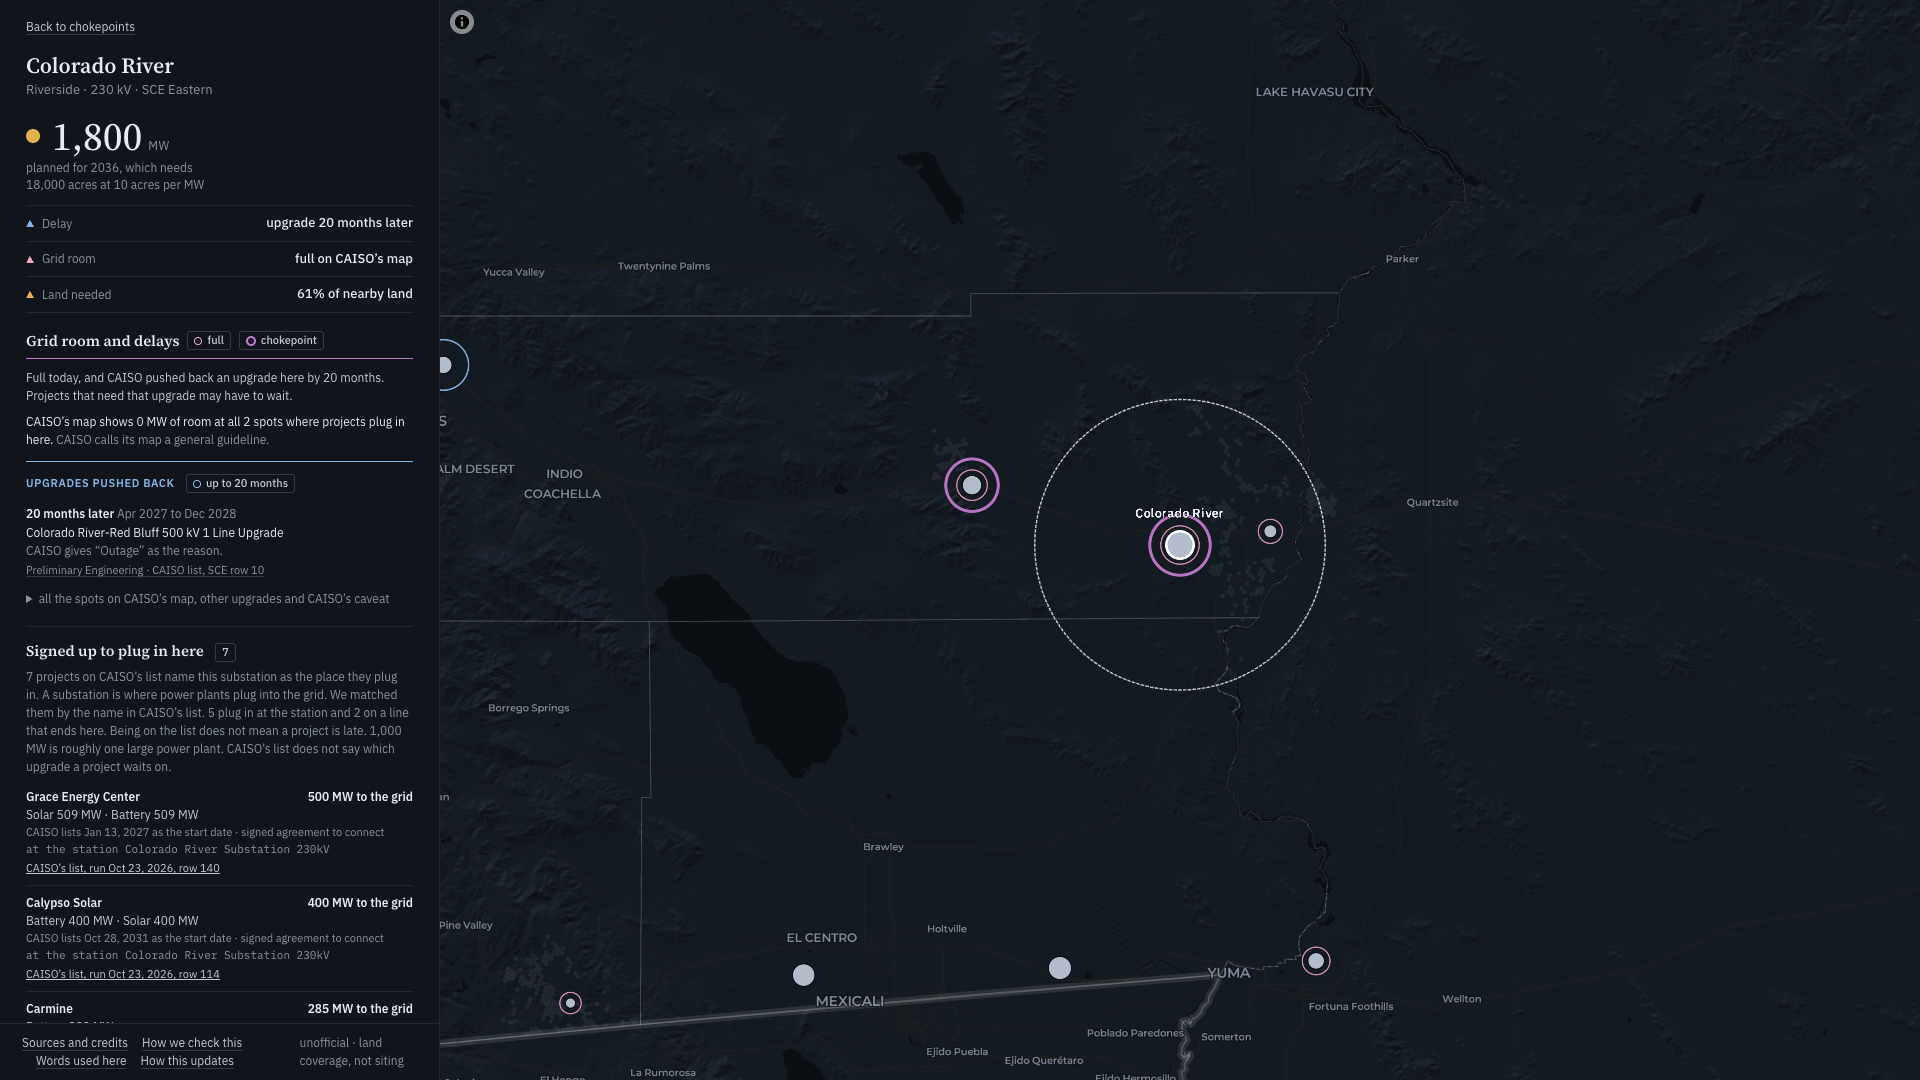
Colorado River in Riverside County is full, late and tight on land all at once.
-
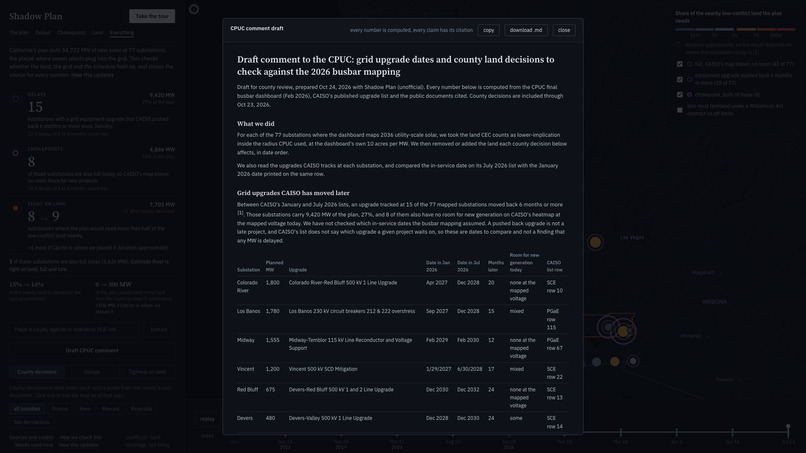
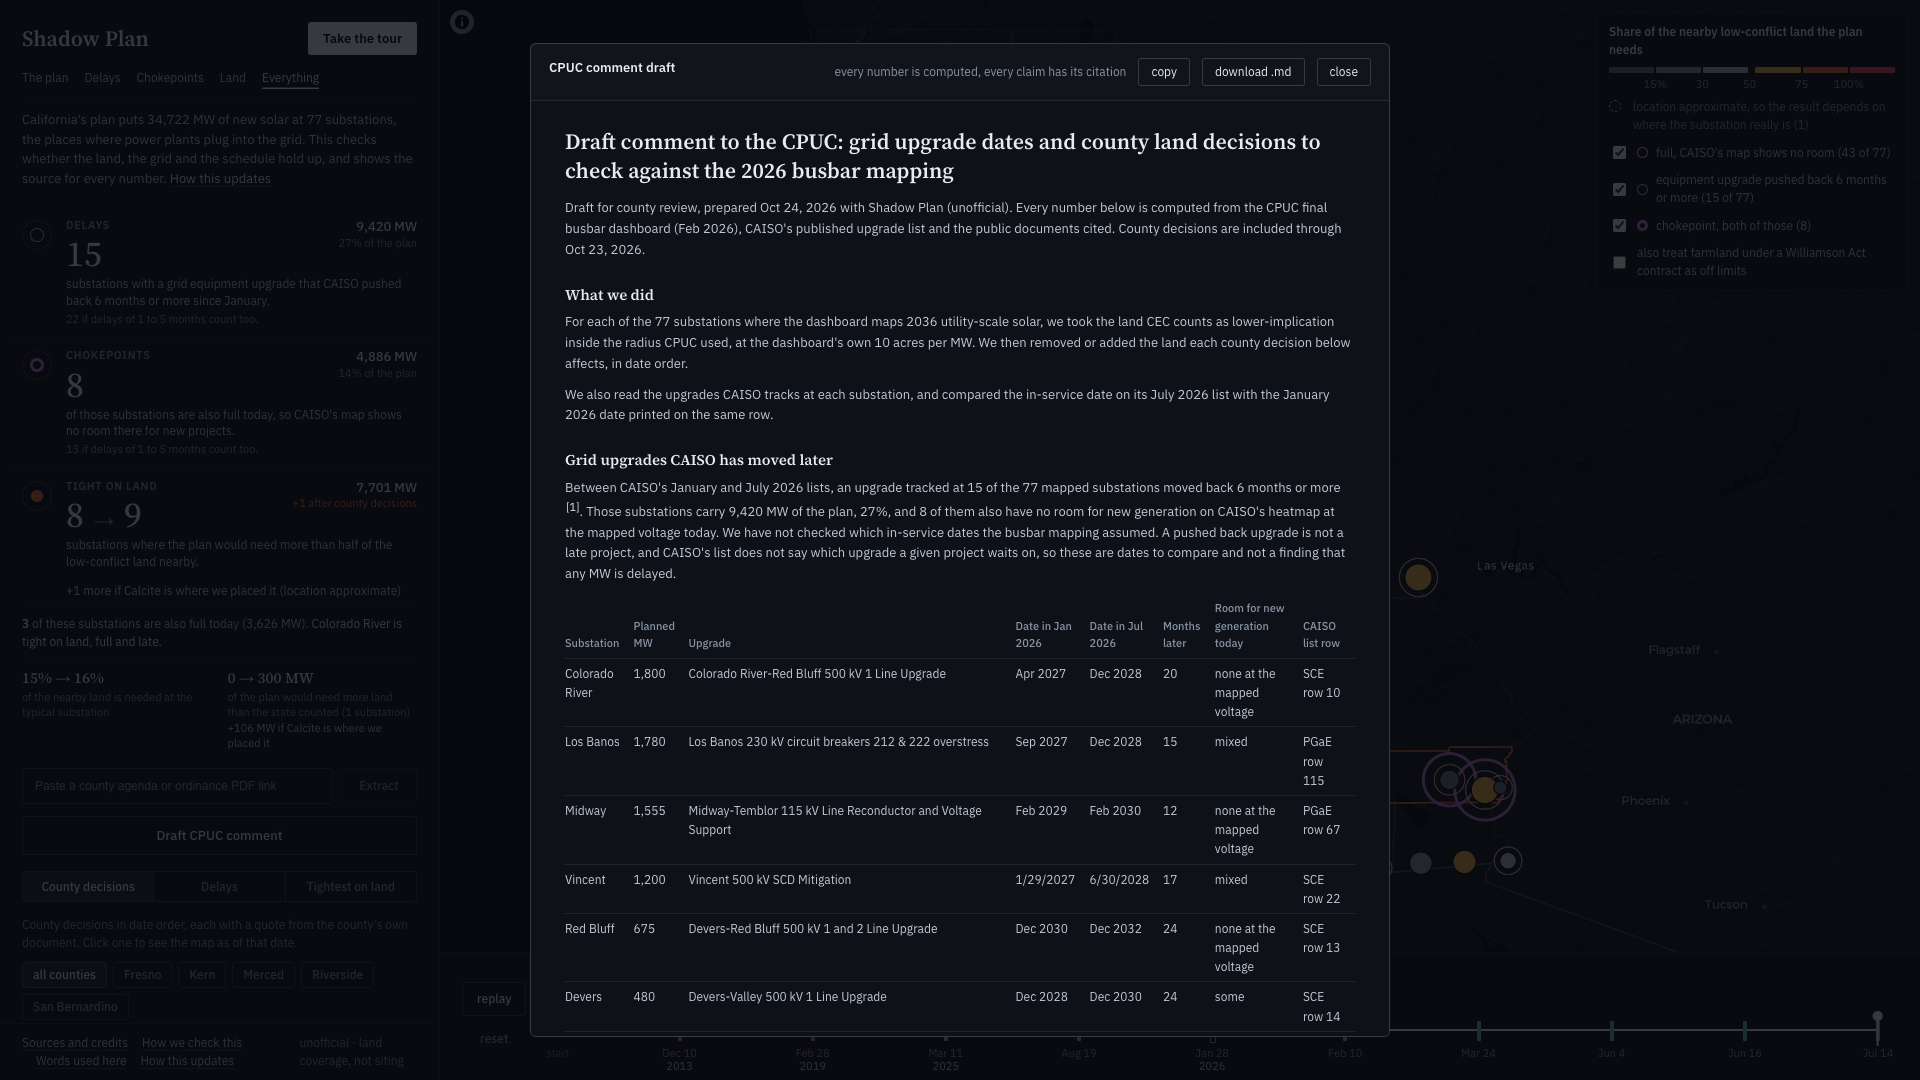
A draft comment to the CPUC, every number cited.
-
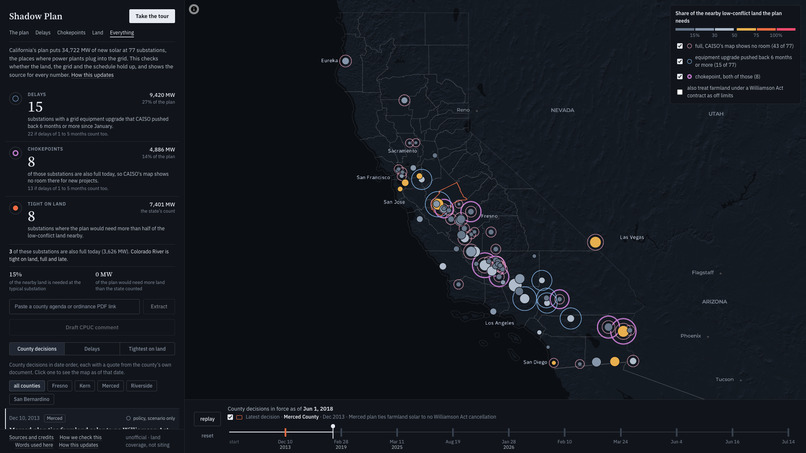
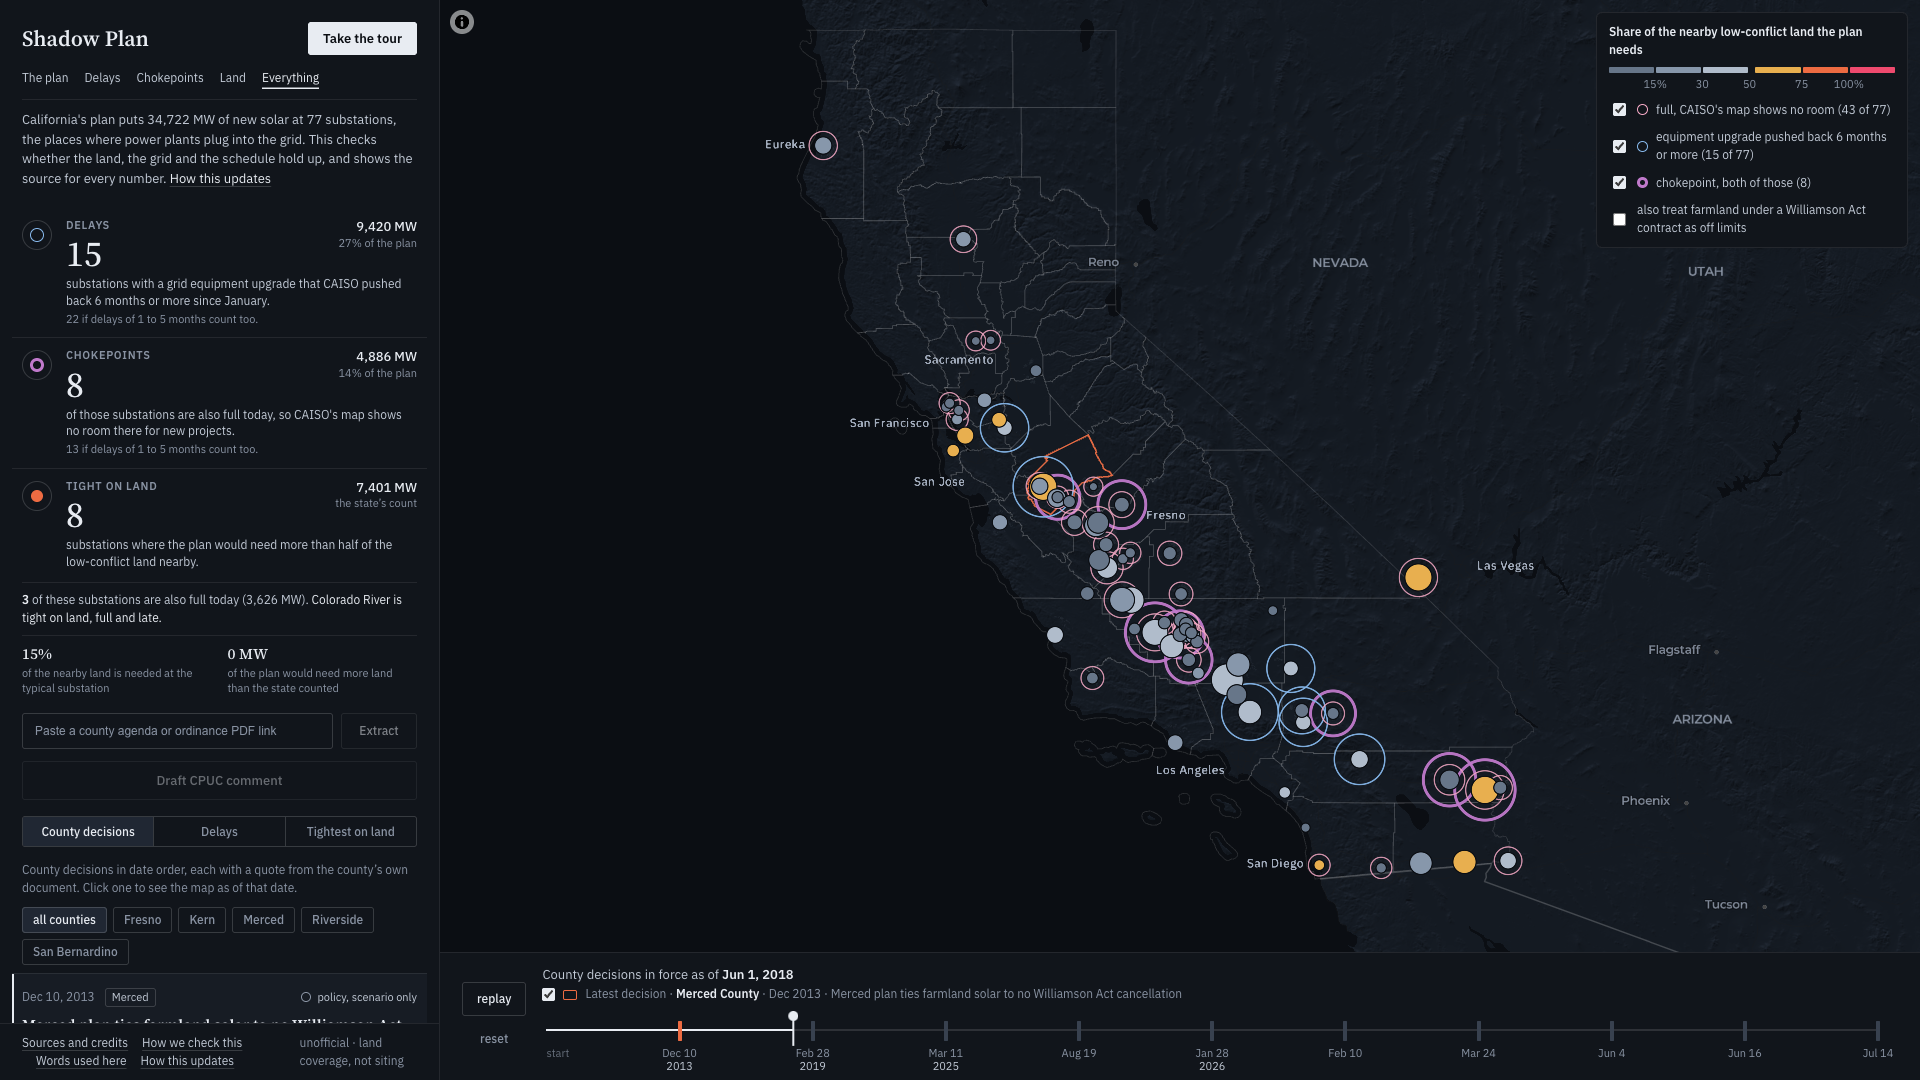
The state’s plan at 77 substations, with the ones where upgrades were pushed back, the grid is full or land is tight.
-
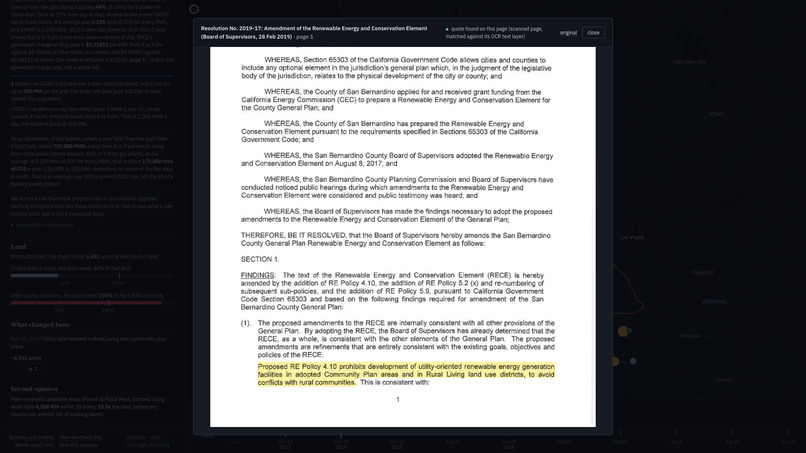
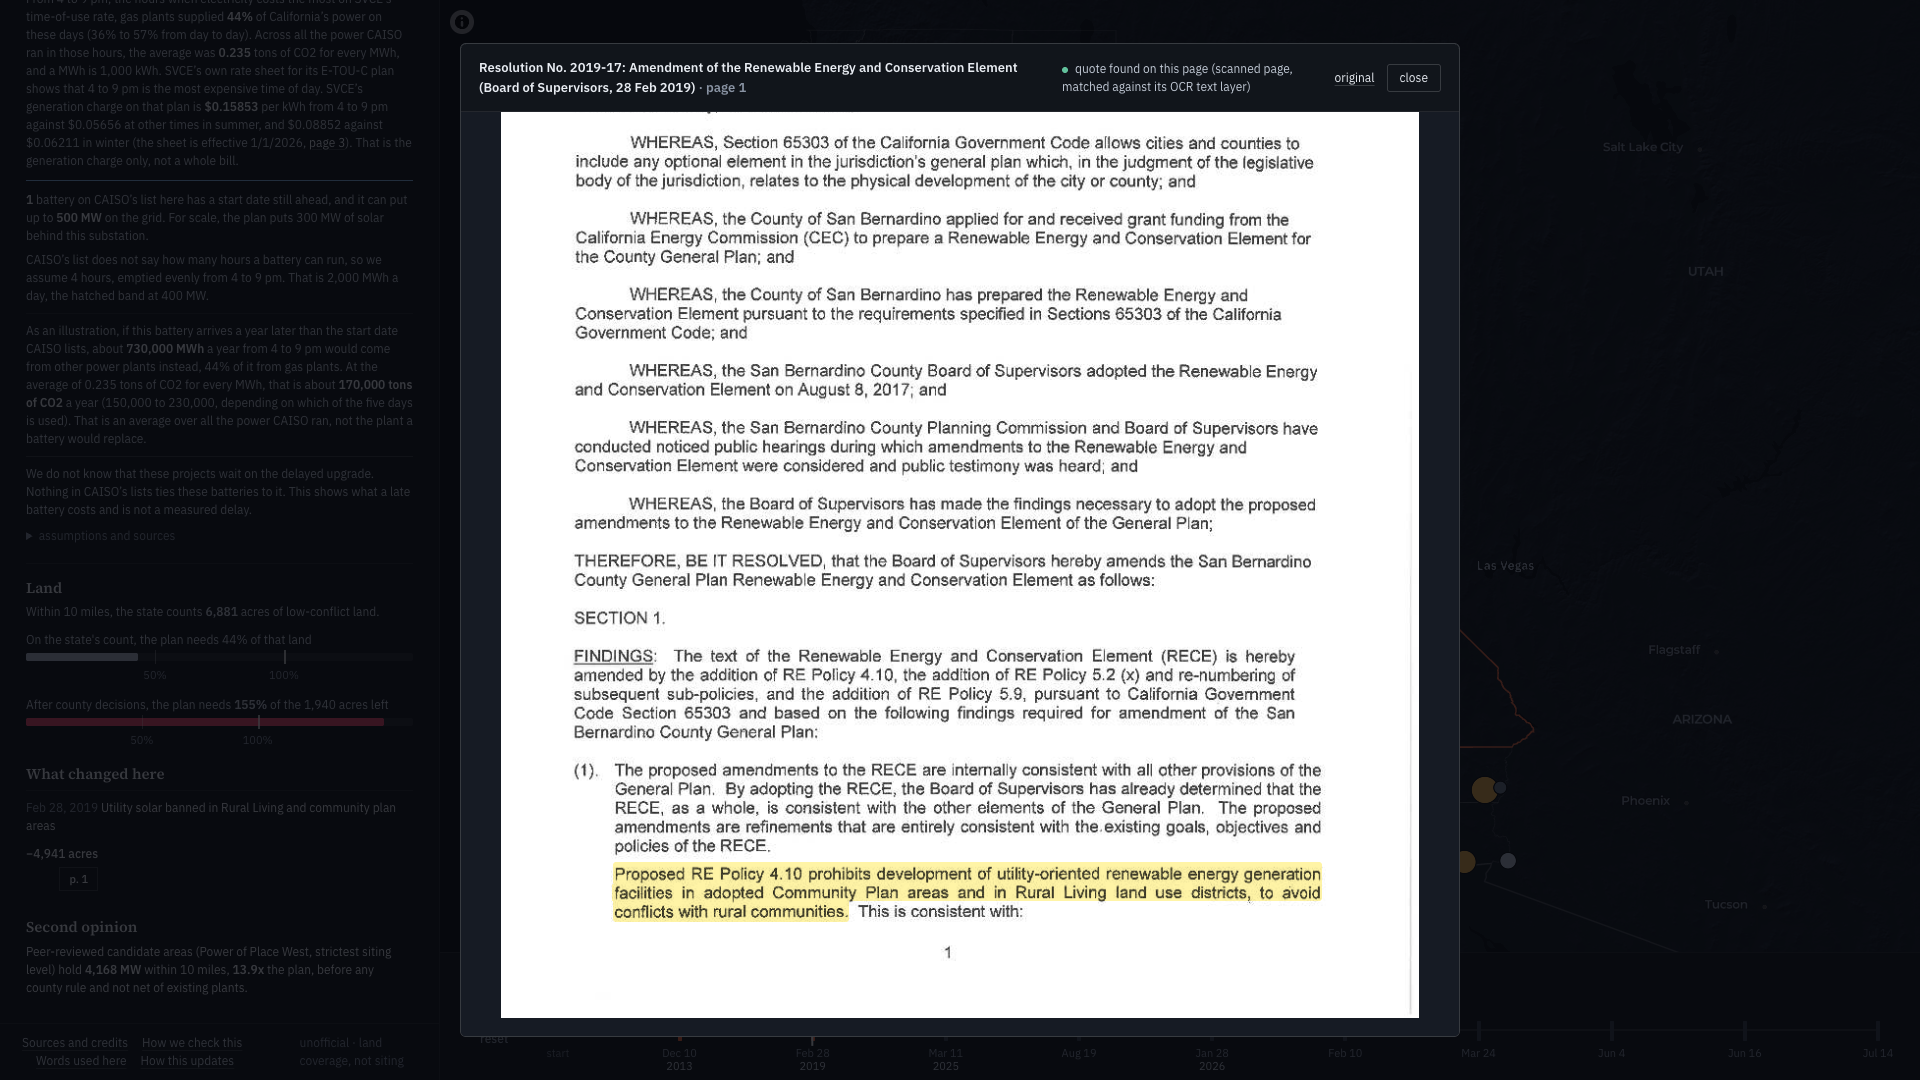
Every county decision carries a quote, highlighted on the page of the signed document.
-
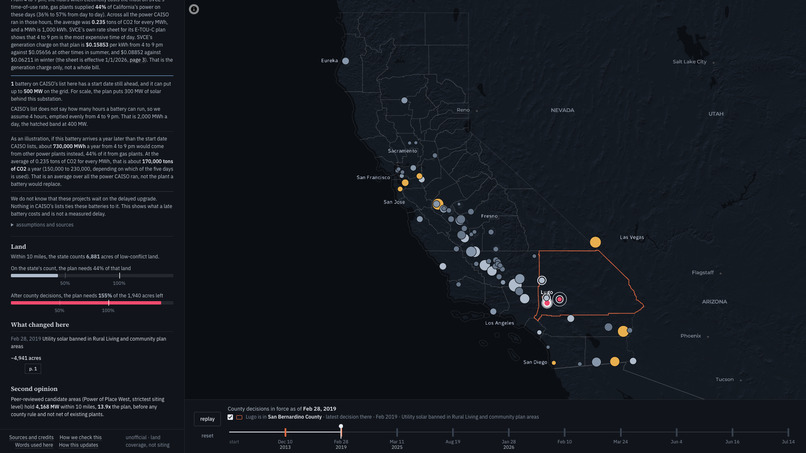
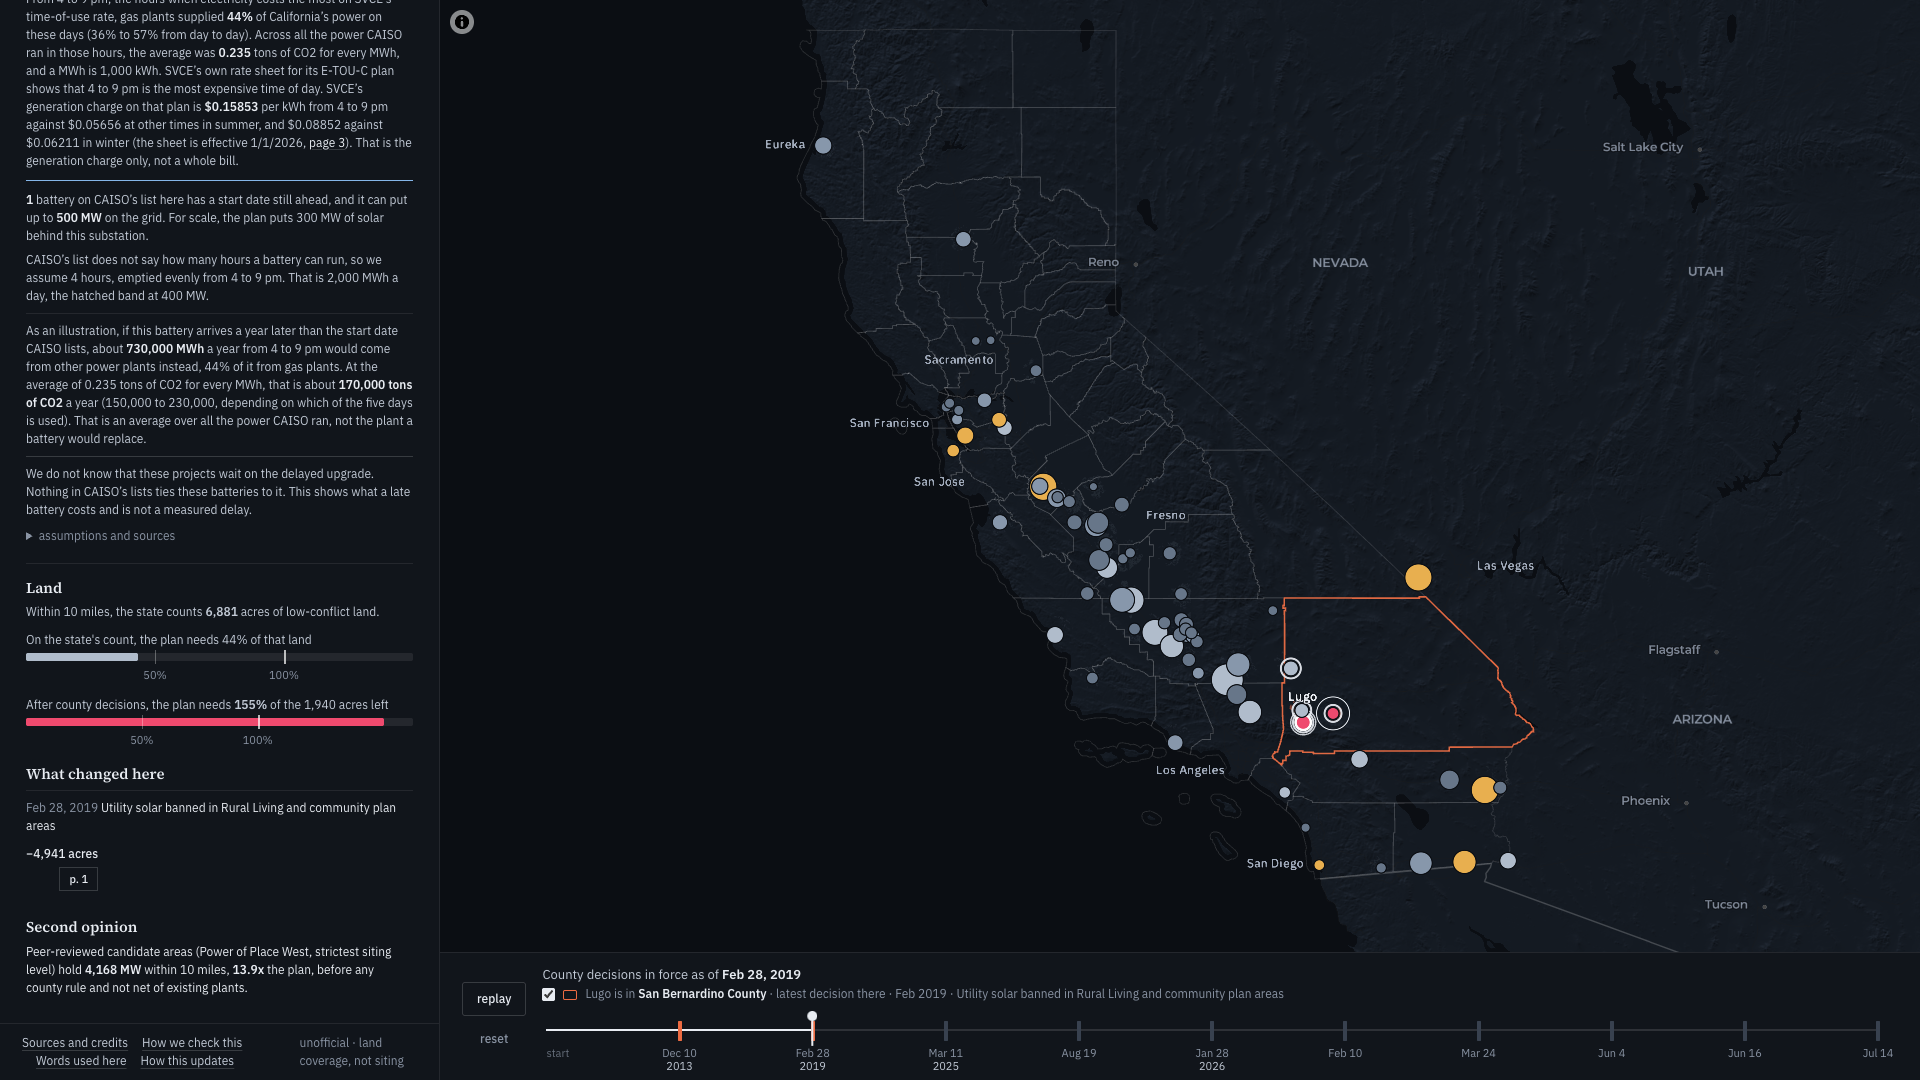
After San Bernardino County’s 2019 ban, only about 190 of the 300 MW planned at Lugo fits on the land left.
-
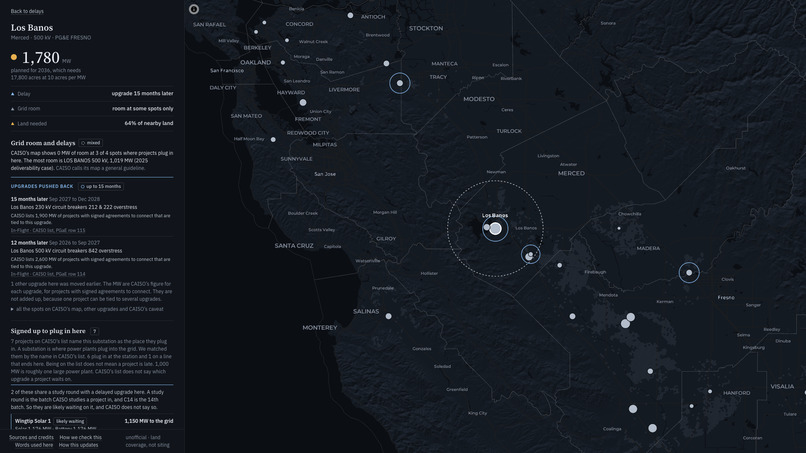
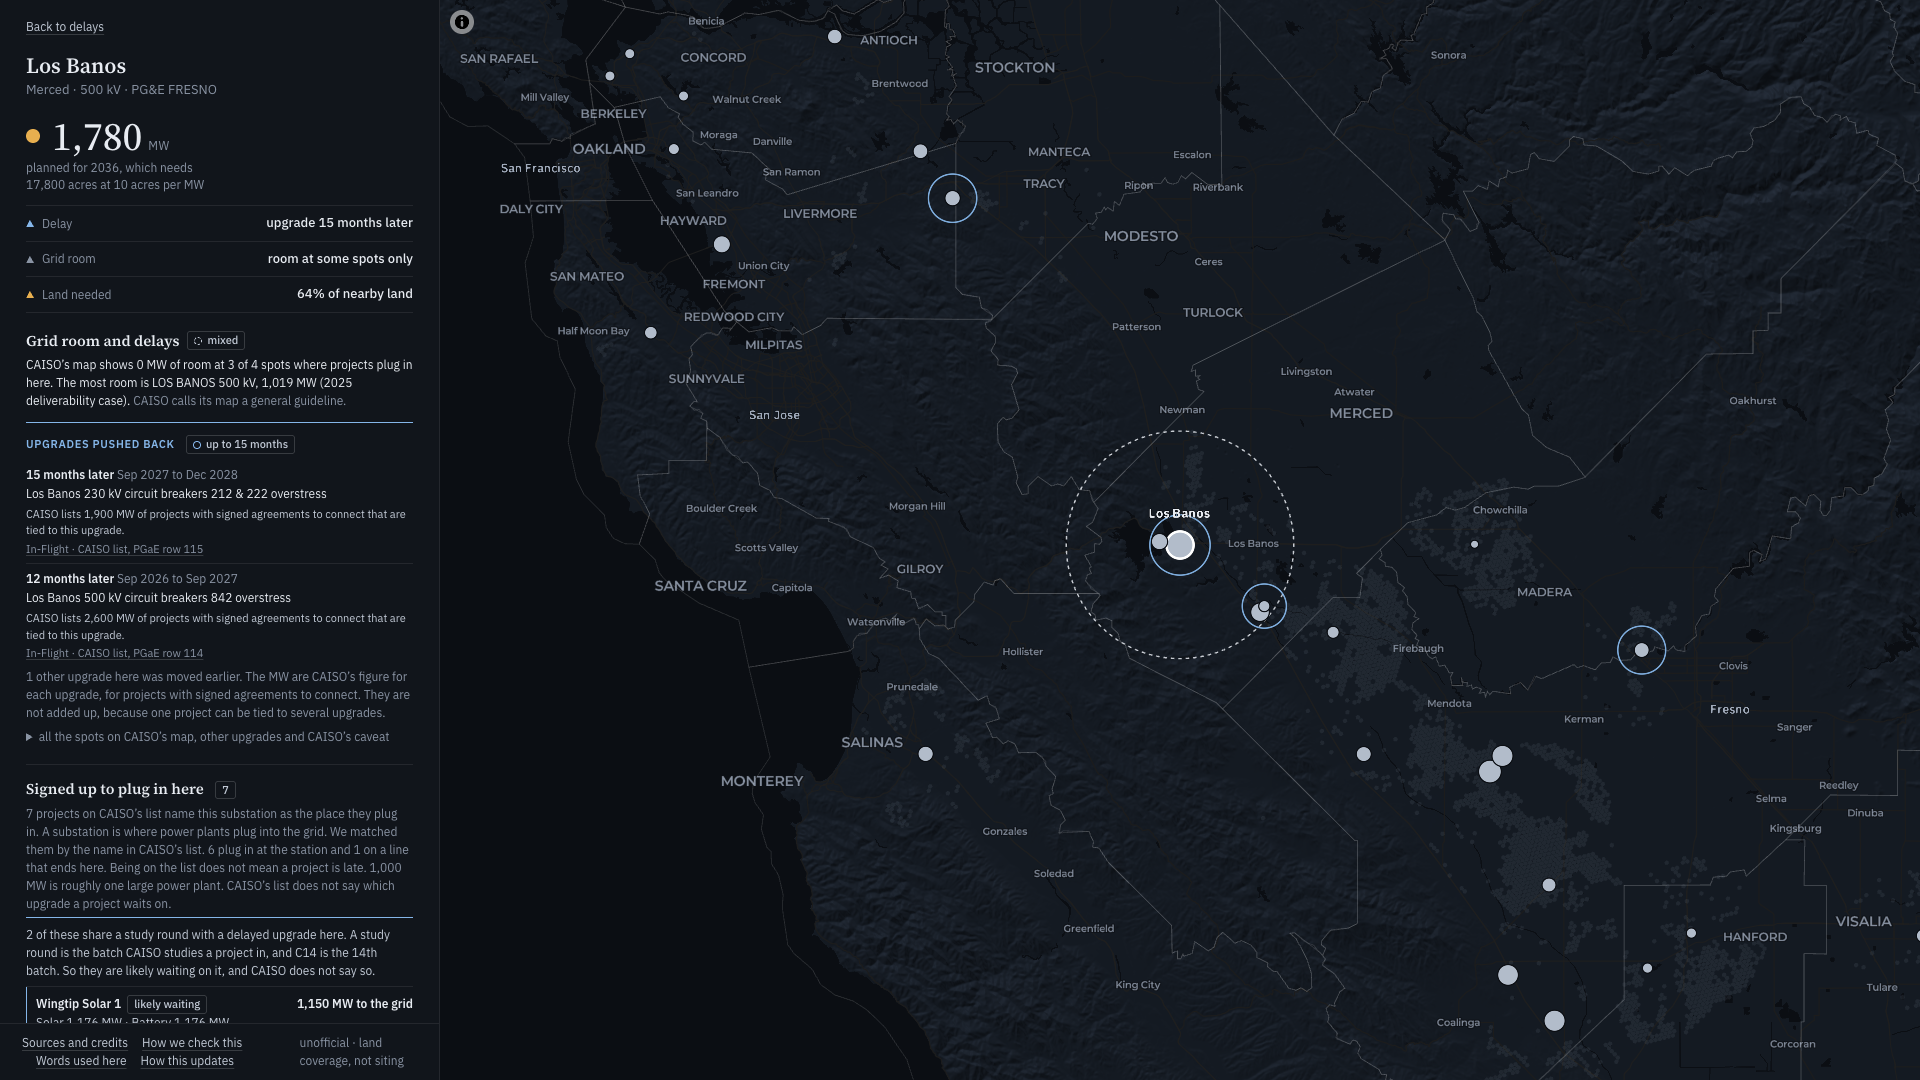
Los Banos. A breaker upgrade moved from Sep 2027 to Dec 2028, with 1,900 MW of signed projects tied to it.
Inspiration
We wanted to take Track 1 at the hours that are hardest, 4 to 9 pm, when solar fades and gas plants take over. California's answer for those hours is a plan, 34,722 MW of new solar and about 9,300 MW of batteries, mapped to 77 substations by 2036. Reading it, we kept coming back to a simple question the plan itself can't answer. Is any of this still on track?
What it depends on lives in different places. CAISO republishes its grid upgrade dates twice a year. Counties vote on where solar can go, in meeting agendas and scanned PDFs. The state counts the land once per planning round and moves on. So we put them side by side ourselves, substation by substation. One example of what fell out is that San Bernardino County's 2019 ban leaves room for about 190 of the 300 MW the plan puts at Lugo.
A few words used below. A substation is where power plants plug into the grid. 1,000 MW is roughly one large power plant. An upgrade is new equipment the grid needs before projects can plug in, like breakers, lines and transformers. CAISO runs most of California's grid and keeps the list of upgrades and the queue of projects waiting to plug in.
What it does
Shadow Plan is a map of the 77 substations. It opens on a short walk-through that takes the three checks one at a time, in the order above, with the map showing only the one on screen, and ends on the full view, where three counters sit beside the map. Delays counts the substations with an upgrade pushed back 6 months or more. Chokepoints counts the ones among them that are full. Tight on land counts where the plan would need more than half of the low-conflict land nearby. Dots are colored by that land share (grey and blue below half, orange and red above it), a pink ring marks a full substation, a thin blue ring marks a pushed back upgrade, and a chokepoint gets a heavy purple ring instead. Clicking a counter lists the substations behind it. The delays step also charts the batteries in CAISO's queue by the year each is listed to come online, with the part at a substation where an upgrade pushed back is due after that year picked out.
A buyer like SVCE could use it when it chooses which evening storage contracts to sign. CPUC staff could use it when they decide where the next mapping round should move MW, and county planners could use it to see where their rules cut into the plan.
Each substation card starts with what CAISO publishes about room on the grid. CAISO's map says how much new generation could plug in at each spot without an upgrade, so 0 MW means full. CAISO calls the map a general guideline and does not use it to accept or turn down projects. Below that are the upgrades CAISO tracks there. For each one we show the date it had in January 2026 next to the date it has now, CAISO's reason when it gives one, and CAISO's figure for the MW of projects with signed agreements to connect that are tied to it. We never add those figures up, because one project can be tied to several upgrades. Of the 98 upgrades on both lists, 27 moved later (18 of them by 6 months or more), 16 moved earlier and the rest did not move, so it is not all one way.
Next on the card are the projects in CAISO's queue that name the substation as the place they plug in. Los Banos has 7, and the largest is Wingtip Solar 1, 1,150 MW of solar and battery, listed for Sep 18, 2032. 2 of them, Wingtip Solar 1 and Australis, entered the same study round as the late upgrades there, so they are likely waiting on them. CAISO's lists never say which project an upgrade is for, so that is our inference.
Under that is a chart of how CAISO ran California's grid each hour on a typical recent weekday (the average of 5 weekdays, Oct 16 to Oct 22). It shades 4 to 9 pm, which is the peak period of SVCE's E-TOU-C time-of-use rate, the hours electricity costs the most on that plan. SVCE's other residential plan, E-TOU-D, peaks 5 to 8 pm on weekdays, so the window is not every customer's peak. In those hours gas plants supplied 44% of the power on average (36% to 57% from day to day). If the 2 batteries that are likely waiting on the late upgrades, up to 1,450 MW, arrived a year later than CAISO lists, about 2.1 million MWh a year in those hours would come from that mix instead, which is about 500,000 tons of CO2 at CAISO's own average. That is an illustration. The queue gives no battery duration, so we assume 4 hours emptied once a day, and the CO2 figure is an average over everything CAISO ran and not the plant a battery would replace. We do not know that these projects wait on the delayed upgrade, and we have no price data, so there are no dollars on the chart.
For land there is a timeline of county decisions under the map. When the playhead passes a decision, the land it takes out or adds is applied to every substation whose circle it touches, one decision at a time and in date order, so the colors, the counters and the feed move together. It goes both ways, since Merced's Las Camas overlay and Kern's Buttonbush approval add land while the 2019 ruling takes it away. Every decision carries a quote from the county's own document, and clicking it opens that document on the cited page with the sentence highlighted. Plain code checks that the quote is on the page, the viewer checks again in your browser, and an event whose quote is not there is dropped. You can also paste a county link and have it read live, take a guided tour that points at what to look at and says what it means, and have the app draft a comment to the CPUC from the numbers on screen with each claim numbered to its source.
It can be refreshed at any time by rerunning the pipeline, which is useful when CAISO publishes a new list of upgrades (it does at its transmission forums in January and July) or when the watcher sees a change on one of the 29 county, CPUC and CAISO pages it checks. Nothing updates by itself yet, and the watcher has not caught a live change yet. The state's map counts the land once per mapping round. This stacks what happened after it, the county decisions and the upgrades CAISO moved, each with its source.
How we built it
First, the state's plan. The CPUC's final busbar workbook gives each substation's 2036 MW, its circle and the acres the CEC counted, and we kept the workbook's own acres as the baseline because that is the number the state used.
Second, the grid. CAISO's map of room and its July 2026 upgrade list, which prints each upgrade's January 2026 date beside its current one, are copied row by row with the file and row each figure came from, and a verifier re-opens every file to check them. The delays are counted from those rows in whole months, with an upgrade counted once even when several substations list it, by two separate programs (Python for the write-up and TypeScript for the app), and a test checks that they agree.
Third, the queue and the evening hours. We download CAISO's queue report and match each project to a substation by the name in its point of interconnection text, which is the spot where it plugs in, keeping stations apart from lines that only end there. We also keep five days of CAISO's hourly fuel and CO2 files and the SVCE and PG&E rate sheets we checked the 4 to 9 pm window against. Separate tests re-open every file and recompute each figure.
Fourth, the state's land as geometry. We rebuilt that land from the CEC's own map layers (the Core Land-Use Screen) and clipped it to each circle, which matches the workbook within 5% on both measures at 56 of the 76 substations we could place (median difference 0.0% on the base land and 1.65% on the low-conflict land). The app lists the 14 that do not match, and a test fails if a county decision is ever applied at one of them.
Fifth, the decisions. A watcher snapshots 29 public pages (county agendas, ordinances and CEQA notice lists for five counties, plus the CPUC, CAISO and Williamson Act pages) and diffs them. When a page changes, a language model reads it and returns an event with a quote and a page number. We picked the 9 documents behind the 10 decisions in the demo ourselves, and the watcher has not run long enough for us to claim it has caught a real change. The five counties hold 67% of the plan's MW, at 41 of the 77 substations, and the delay and grid checks cover every county.
Sixth, each decision becomes geometry (zoning layers, assessor parcels, or the sections a notice names), then H3 cells, then acres inside the circle of every substation it touches, with the method written on its card. The county layers are today's, so the boundaries behind the 2019 ruling may have moved a little.
The app is TypeScript and React on Vite with MapLibre, deck.gl and pdf.js, and the data steps are Python (shapely, pyproj, openpyxl). The tests re-read every cited PDF page themselves, check that each counter on screen equals what the data files say, and recompute the 2019 ruling with a second implementation that agrees within 1% at all four substations it touches (same layers, so that checks the arithmetic and not the choice of data). A script breaks each of these on purpose in a throwaway copy of the repo and checks that its test fails.
Challenges we ran into
A pushed back upgrade is not a late project. The plan looks out to 2036, and CAISO's lists do not say which project an upgrade is for, so we count substations where an upgrade moved and show the dates, and we do not say that any MW are delayed. The batteries chart has the same limit. The queue does not say which upgrade a battery waits on, so it shows what sits at the same substation as an upgrade due later, and not which batteries are late. Several delays are only a month or two, which is why the headline uses 6 months and the looser count sits beside it.
The vote count was the next one. Press coverage said 4-1, and we only caught the 5-0 because every event has to carry a quote from the document itself. Scans were another, since 7 of the 9 county documents are scans and 3 of those had no text layer at all, so we added one with OCR for the quote check and the highlight.
The queue has no field for the substation, only free text, so matching by name needed care. A plain search would have counted a project at Altamont Midway as a Midway project, so we compare the whole name, keep lines that only end at a substation apart from the station itself, and show the matched text next to every project.
Substation locations were harder than we expected. Most come from the CEC's layer, but a few have no published coordinates and are placed from the workbook's own distances, so we show those as approximate. Last, land turned out not to be the binding limit at most substations (peer-reviewed candidate areas hold at least 1.4 times the plan at all 73 where we could compute it), so we talk about margin and not about what is infeasible. The state's count of low-conflict land is the tighter test, and it is also the one that county decisions move.
Accomplishments that we're proud of
15 of the 77 substations, 9,420 MW of the plan, have an upgrade that CAISO pushed back 6 months or more since January, counted from CAISO's own rows, and 8 of them are chokepoints that are full today. On land, before any county decision 8 substations would need more than half of the state's low-conflict land to reach the plan, and after the 10 decisions we have so far it is 9 (7,701 MW), or one more if Calcite is where we placed it. Treating the farmland under a Williamson Act contract as off the table, as a scenario, takes that to 15. Each of the 9 decisions backed by a PDF has its quote found on its cited page by a check that does not trust our own pipeline.
What we learned
Going in, we thought of the state's plan as the answer. It turned out to be a snapshot, and what changes it is scattered. CAISO moves upgrade dates twice a year, and not only later. Of the 98 upgrades on both of its lists, 27 moved later and 16 moved earlier. Counties change land rules in meeting agendas and scanned resolutions, and the state's land count does not know about them. And the source matters more than we expected. Press coverage of the San Bernardino vote said 4-1 and the signed resolution says 5-0, and we only caught that because every decision has to carry a quote from the document itself. Every number in Shadow Plan links to the page it came from for the same reason.
What's next for Shadow Plan
We have not talked to any of the people this is for yet. The ones we'd like to ask are buyers like SVCE (it is judging this track, and the contracts it signs only deliver if the projects get built and connected on time), county planners who want to see what a decision does to the state's plan, and CPUC staff before the next mapping round. We left out any step that moves MW between substations on purpose, because that needs transmission engineering we don't have and the land count alone would make it look more certain than it is. The other thing we would add is where supply is needed most. CAISO's Local Capacity Technical Study names the areas where generation has to be located locally for reliability (LA Basin, San Diego-Imperial Valley, Greater Bay Area and others). We have not placed our 77 substations in those areas, so we do not say how much of the plan is inside one.
Nothing below is done yet. Each limit comes with the step that would remove it.
Five counties, not 58. Only the county watcher is limited to five, and the delay and grid checks already cover every substation. The five hold 67% of the plan's MW. Platforms like Legistar and CivicPlus host agendas for many local governments, so one adapter for each could cover many counties at once. Our five do not share one. San Bernardino is on Legistar and Merced on CivicPlus's Agenda Center, Kern and Fresno post on their own county pages, and Riverside we only watch through the state's CEQA notice search, which covers every county and which all five of ours already use. Scanned PDFs go through OCR, and a quote that is not on its page is still dropped.
Reruns by hand. The watcher can run on a schedule and send what it finds to whoever subscribes, and CAISO's forum page, which it does not read yet, can be added so that a new upgrade list starts a rerun.
Projects tied to upgrades by guesswork. We only know that a project and an upgrade share a study round, so we call the link likely. CAISO's cluster studies assign upgrades to projects, so reading those reports should confirm which projects wait on which upgrade, though parts of them are redacted.
No prices on the evening chart. CAISO's market prices for the same hours would let it show dollars next to the tons of CO2.
Built With
- deck.gl
- maplibre
- ocr
- pdf.js
- playwright
- python
- react
- tesseract
- typescript
- vite

Log in or sign up for Devpost to join the conversation.