Inspiration and problem
Community organizers need a clear way to compare outdoor activity hours, while recognizing that historical data and a small model cannot determine whether an activity is safe. ShadeWindow explores an explainable, local-first planning interface rather than an emergency alert or medical tool.
What it does and who it is for
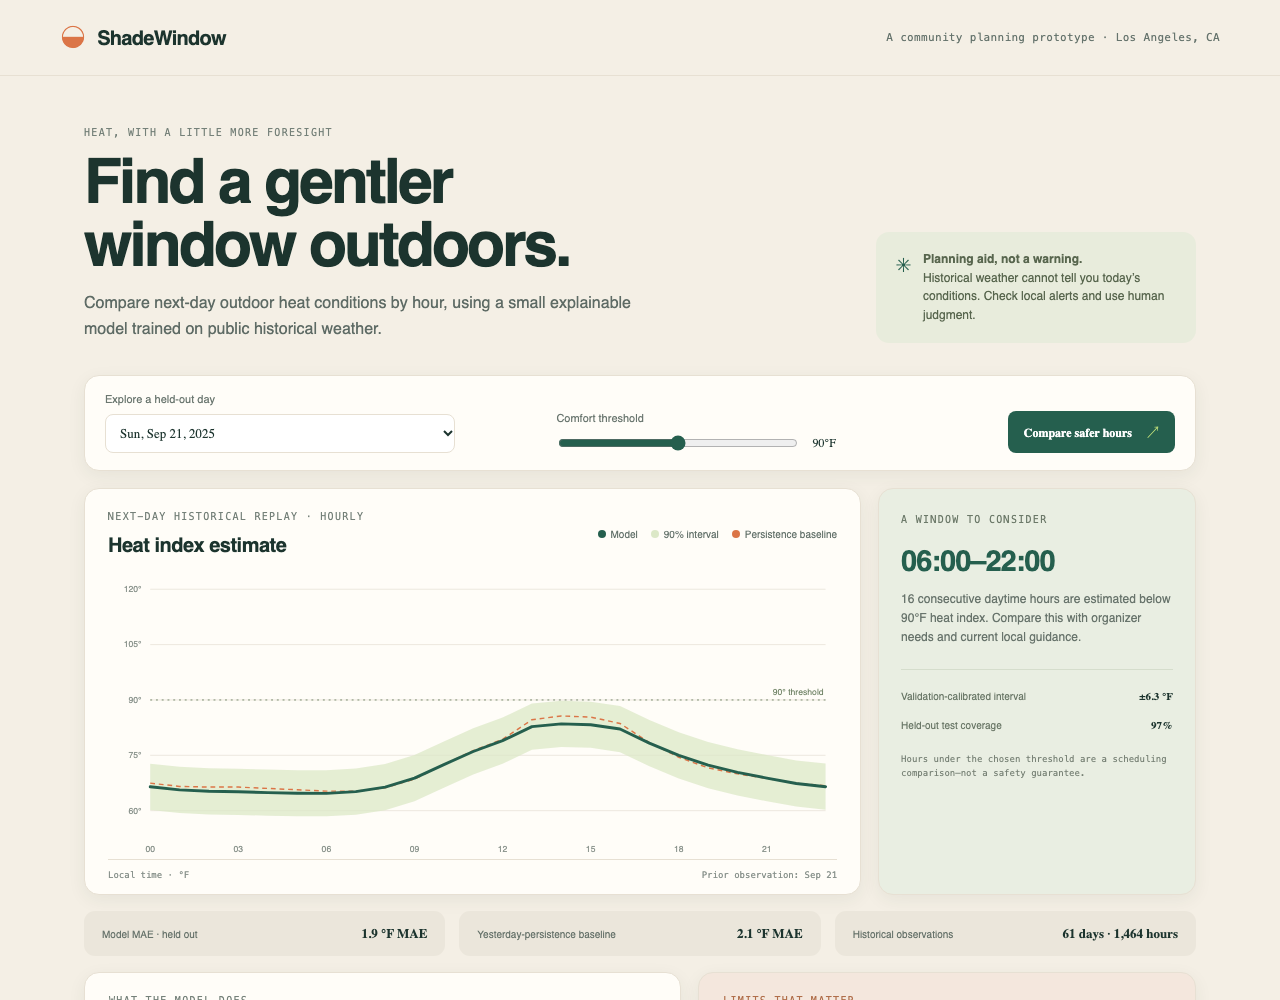
The browser demo replays held-out historical Los Angeles days. Users choose a day and heat-index comparison threshold, inspect hourly model estimates beside a yesterday-persistence baseline, and see the longest daytime run below their chosen threshold. The comparison is intended for community organizers exploring scheduling trade-offs, not for current-weather decisions.
How it was built
The pinned October 5, 2026 build uses static HTML/CSS and JavaScript ES modules. Deterministic ridge regression (lambda 2, unregularized intercept) predicts hourly temperature and relative humidity from the previous day's same-hour and adjacent-hour observations plus cyclical time features. A NOAA/NWS heat-index calculation converts those predictions into the displayed estimate. There are no runtime hosted AI calls, analytics, or third-party requests. The local demo loads only its bundled files.
Evaluation and technical challenges
The 61-day Los Angeles sample is split chronologically into 42 training days, 9 calibration days and 10 untouched test days. Calibration produces a symmetric residual-based interval. Re-running the pinned model produced a held-out heat-index MAE of 1.91 degrees F versus 2.05 degrees F for persistence; empirical test interval coverage was 96.7%. These figures describe this small historical holdout only, not operational accuracy or learning/health outcomes. The central design challenge is communicating uncertainty without turning a comparison threshold into an unsupported safety claim. The implementation demonstrates reproducible evaluation and the distinction between reanalysis, prediction and actual current conditions.
Data attribution and limitations
Weather data by Open-Meteo.com, CC BY 4.0: https://open-meteo.com/en/terms . The bundled ERA5 reanalysis covers Los Angeles from August 1 through September 30, 2025. It is gridded historical data, not a local station reading or a live forecast. One city, one season and one sequential holdout do not establish generalization. Sun/shade, wind, exertion, hydration, clothing, health and acclimatization are not modeled. No clinical, medical, emergency-alert or safety guarantees are made. Check current local alerts and public-health guidance.
AI-use disclosure
AI assistance was used in development. The product's model is deterministic JavaScript ridge regression; it makes no runtime AI/provider calls. The demonstrated results come from the bundled historical sample, not generated weather or claimed real-world trials.
Build and availability
Pinned source commit: 941c0cfee317a5de5db57c985ce67f6d10083cc3. The GitHub repository is currently private; no public deployment is claimed. The attached screenshot was captured from the actual pinned local build. No source files were changed for this entry.

Log in or sign up for Devpost to join the conversation.