-
-
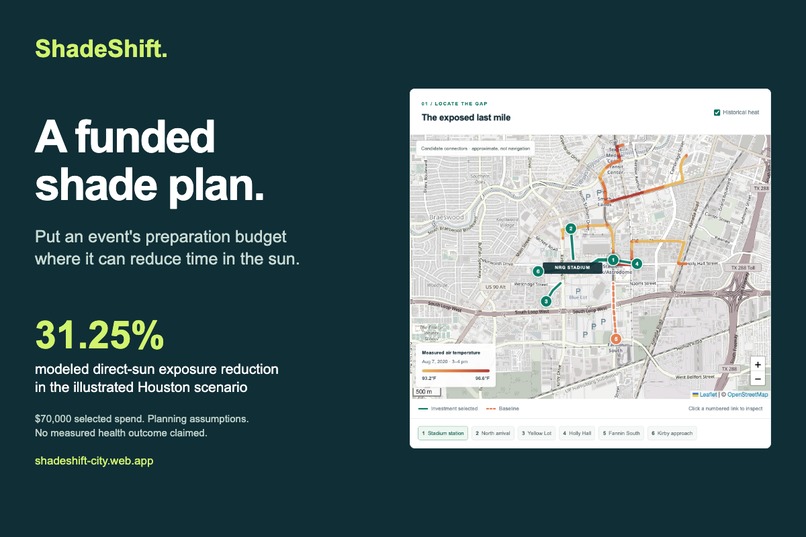
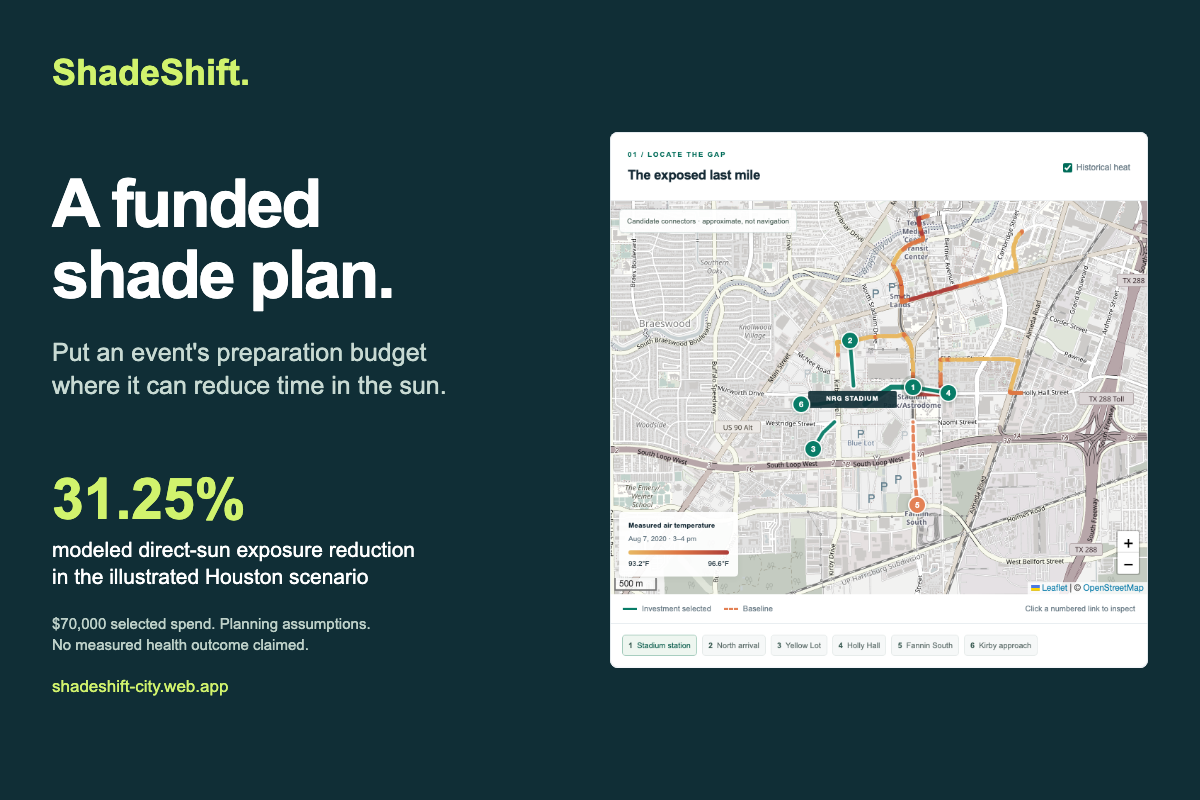
A $70,000 Houston scenario models 31.25% less direct-sun exposure. Assumptions and tradeoffs remain visible.
Inspiration
The ticket gets you a seat. It does not get you shade.
A visitor's event experience starts on the walk from transit and in the outdoor queue. The operations team has a practical decision: with a limited preparation budget, which locations should receive shade, shorter queues or refill capacity?
We chose Track 3 to connect visitor activity, heat and the built environment to that decision. Houston's stadium-and-transit geography grounds the detailed case. The 2026 World Cup is our case study; future games, concerts, festivals and conventions are the recurring use.
What it does
ShadeShift is an interactive investment workbench with six Houston candidate links. Set a budget and community-weighted allocation, inspect historical heat and transit anchors, edit demand and intervention assumptions, and compare the baseline with a proposed plan.
The map includes 654 measured historical street-temperature observations. A national atlas compares 539 historical modeled-weather samples across the 11 U.S. host venues. Evidence, assumptions and calculated outputs are labeled separately.
Operators can change package cost allowances, stress-test delivered effectiveness, pin comparisons, export CSV or versioned JSON, import scenarios and print a decision brief. Email/password accounts support private saved plans. A legacy view separates resident walking exposure from event queues and includes maintenance and recurring operating allowances.
How we built it
The application uses Vite, React and TypeScript, with Leaflet, Recharts and Zod. Firebase Hosting serves the application; Firebase Authentication manages email/password accounts; Firestore stores saved versions with owner-only database rules.
A deterministic allocation engine checks up to 15,625 portfolios, selecting one intervention package per link. It maximizes modeled direct-sun person-minutes avoided within the initial budget and community constraint.
The accounting is inspectable: arrivals × walking-plus-queue duration × unshaded fraction × sunlight assumption. Combined shade and queue effects are applied before subtracting the result from the baseline. Water access is a separate service measure, not a fictional reduction in sunlight or temperature.
The weather benchmark rebuilds offline from pinned raw responses. Exports preserve resolved inputs, model version, catalog and calculated results. Historical temperatures provide context; they do not drive the optimizer or predict illness.
Results and tradeoffs
In the illustrative Houston case, a $70,000 starting portfolio models 23.8% less direct-sun exposure, with capacity for 1,200 refills per arrival window.
With a $75,000 cap and a 25% community-weighted minimum, the exposure-maximizing portfolio also spends $70,000 and models 31.3% less exposure. Its community allocation is 27.4%, but refill capacity becomes zero. That is a decision to examine, not a benefit to hide: a single exposure objective does not satisfy every operating need. At 60% delivered effectiveness, the same optimized plan models an 18.8% reduction.
Both portfolios require $70,000 initially. Across 12 event windows, their modeled first-year allowances are $171,200 and $251,400, respectively. The optimizer constrains first deployment, so recurring operating cost remains a separate decision.
The atlas reveals a second tradeoff. In the sampled 2025 afternoons, Houston has the highest median heat index, 97.8°F, while Philadelphia has the highest 95th percentile, 107.8°F. Typical conditions and hot-tail afternoons tell different stories. These are historical model comparisons, not city-readiness rankings or forecasts.
All intervention benefits are scenario estimates. No venue deployment, medical outcome, customer adoption or revenue is claimed.
Challenges we ran into
The hardest problem was false precision. A polished map can make assumed footfall look measured or make old temperatures look current. We made provenance and limitations visible, and kept sunlight exposure, water, money and resident reuse in distinct units.
Independent review exposed practical problems in versioning, export safety, zero-benefit recommendations and legacy accounting. We corrected them and added regression coverage. Database rules enforce ownership rather than relying on hidden interface controls.
Accomplishments that we're proud of
A complete hosted workflow connects evidence to an editable budget decision, a comparison and a reusable export. Twenty model tests, fifteen Firestore security test groups and seven browser workflows pass against Firebase emulators. Public hosted browser checks and a disposable real-account save/load/delete test also pass.
The optimizer was cross-checked against an independent enumerator. All 654 measured heat points and 539 weather rows were validated, including recalculated heat indices and percentiles. Tests verify software behavior within their scope; they do not establish field accuracy.
What we learned
A useful sustainability tool must make tradeoffs visible. Maximizing exposure reduction can remove refill service or shift investment away from everyday residents. Those consequences belong beside the headline result.
We also learned to start with a buyer and a recurring job. Our first customer hypothesis is the venue operations director preparing each event's outdoor arrival plan. Existing GIS, weather-alert and incident-management tools already serve this market. Our focused contribution is the budget-to-intervention decision between those tools.
Commercial path and legacy
We propose a $5,000 assisted two-event pilot and a $6,000 annual venue subscription as prices to test. Hardware, staffing and permits remain separate. The pilot would measure planning time, verify counts and shade on site, compare estimates with observations and test renewal value.
Reusable shade needs an owner, maintenance funding and a verified community use. Resident passages, reuse days and sunlight assumptions remain editable. A future advantage would come from verified venue constraints, costs and deployment performance, not ownership of public heat maps.
What's next for your project
Field-check candidate links with venue, transit and accessibility staff. Replace illustrative inputs with counts, queue observations, shade audits and supplier quotes. Trial an approved reversible plan, document error and evaluate a second event before expanding.
Try ShadeShift | Source code | Pitch deck | Methods and results
Testing instructions
Open the app with no login. Pin the default comparison, click Optimize investment, and compare 23.8% with 31.3% modeled reduction at the same $70,000 spend. Move delivered effectiveness to 60% to see 18.8%. Inspect the refill and community tradeoffs. Export JSON, change an input and import it to restore the plan. Explore the eleven-city atlas, Evidence & method and Legacy & delivery. For private saves, create a free email/password account, save a named plan, reload and open it from Saved plans. No API key or shared credentials are needed. Full testing guide.
Built With
- firebase
- firestore
- leaflet.js
- playwright
- python
- react
- recharts
- typescript
- vite


Log in or sign up for Devpost to join the conversation.