-
-
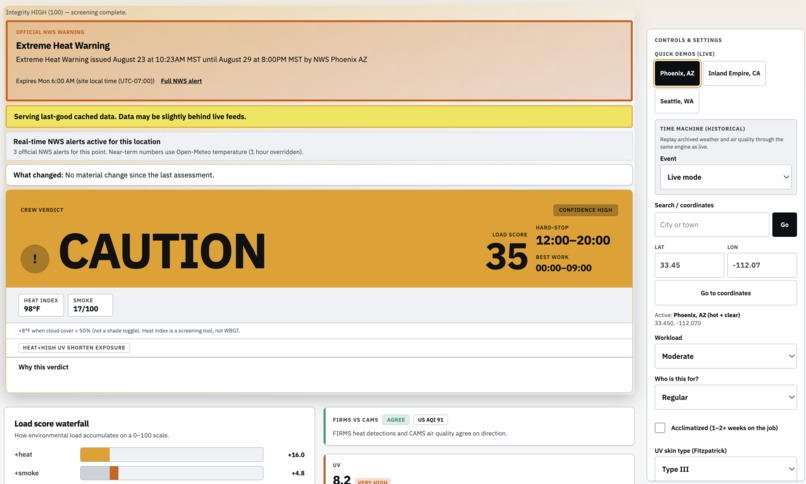
Preview
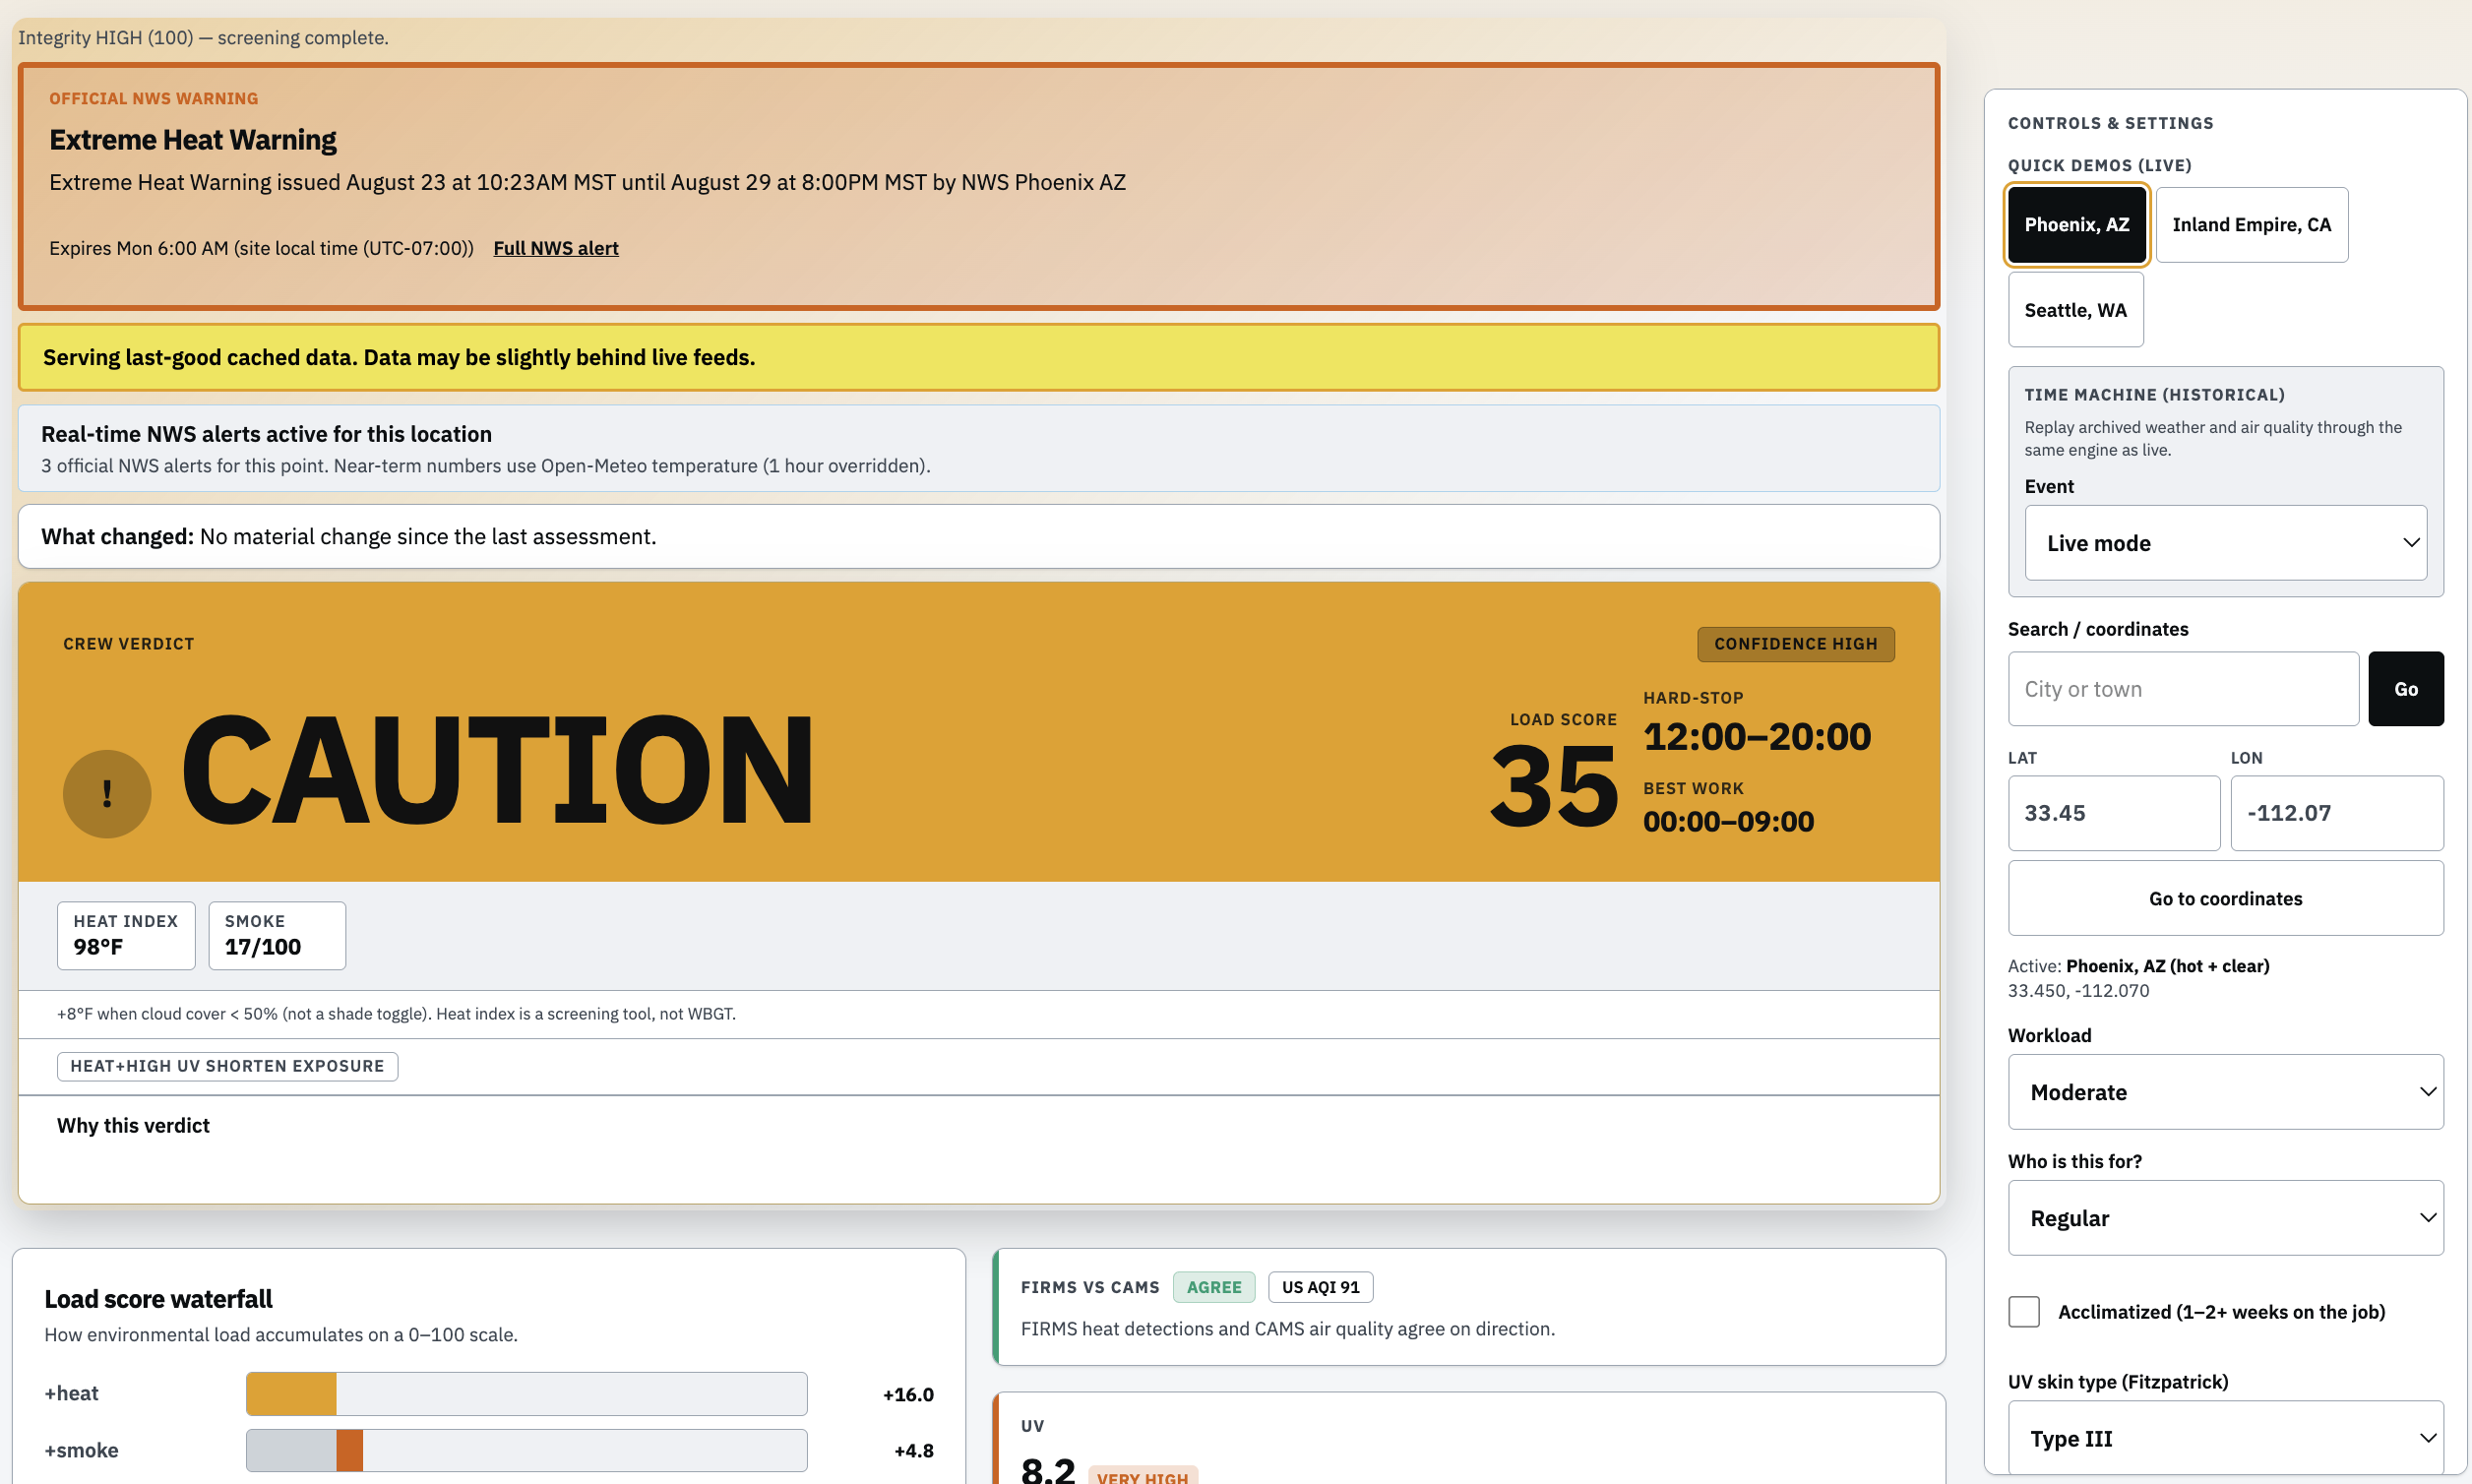
Inspiration
This hackathon gave us the freedom to build whatever software we wanted, so I wanted to build something meaningful. I spent the first few days of the hackathon just researching large, high impact issues that affect people all around the world. After going through and even scrapping a lot of ideas, some of the issues that stood out to me were climate change, pollution, and public safety. Then I realized all 3 of these issues are related, and now I just have to figure out what involves all 3. Obviously, climate change increases temperature and UV and pollution contaminates air quality and even can add a smoke risk. Both of these issues are outside, so I need to protect the people who are outside the most. After some thinking, I decided construction crews would be the best target audience to this as after further research, I found out that heat sends about 28,000 US workers to injury every year, and heat deaths have been climbing nearly 17% annually since 2016! Wildfire smoke adds an estimated 11,000 to 24,000 deaths a year! They're both really dangerous, and nobody's checking them together... Learning this made me committed to creating a solution that helps protect these people from the worsening conditions every year, and this led to the development of ShadeCast.
What it does
ShadeCast tells outdoor crews when to work and when to stop. It combines local conditions like heat, modelled smoke, UV, air quality, wind, and live NWS storm alerts into one verdict (GO, CAUTION, RESTRICT, or STOP) and has hourly work and rest minutes across the next five days. Every number is computed with a sophisticated and accurate Python algorithm. It uses a large language model to write the data and safety ratings into briefings for the crew, and based on the situation, it will even recommend deterministic, well researched actions and protective measures to take throughout the shift to stay safe. And we make sure that if our data is ever inaccurate, we let the user know and avoid misleading them or giving them false information.
How I built it
The part that mattered most was planning. I spent the first couple of days deciding what to build and getting NASA's FIRMS and POWER APIs before writing real code, which is how I figured out early on that POWER is a reanalysis archive and can't be used as a forecast. From August 6th to the 24th I built it in phases and shipped each as its own pull request. The deterministic risk engine and its tests were built first, then the data integrity layer, air quality and UV, real-time NWS storm alerts, and finally the dashboard, charts, and printable shift sheet, including one detour where I spent hours debugging a map that never rendered and eventually remade it from scratch. I used Cursor's agent throughout to assist in development, but all the decisions that shaped the product were mine, not only the stack, features, and UI/UX, but which source is allowed to answer which question, where the language model is not allowed near the math, and what the app should admit it doesn't know.
Challenges I ran into
The worst one was a map that simply wouldn't draw. I spent six rounds of debug commits (and a couple hours) instrumenting MapLibre's paint pipeline before realizing the library was the problem and replacing it with another type of map, which rendered on first paint and, unlike the WebGL version, could actually be unit tested. The other two challenges were smaller but taught me more: my data integrity checks were so strict they flagged legitimate dry heat days as corrupt because the Rothfusz heat index diverges at low humidity, and I spent a week treating FIRMS fire detections as a proxy for smoke before accepting that a satellite seeing a fire 400 km away tells you nothing about the air a crew is breathing, so smoke now comes from CAMS PM2.5 modelling, and FIRMS only signals heat.
Accomplishments that I am proud of
I'm proud that it actually works, and that it's honest because every number comes from tested Python code, and the AI only puts those numbers into plain English so it can never hallucinate wrong data. I'm also proud it works almost fully outside the US (except NWS alerts, which are not required), and the shift sheet that a supervisor can print and walk away from instead of staring at a dashboard all day.
What I learned
I learned how to plan properly, how to keep an AI away from the math that matters, how to use agentic coding IDEs well, and when to give up on a library instead of debugging it a sixth time. The biggest thing that I learned was realizing the hard part isn't getting data, it's knowing what each source is actually allowed to tell you. For example, a satellite seeing a fire isn't the same as knowing the air a crew is breathing, and I had to rebuild the whole smoke pipeline once that clicked.
What's next for ShadeCast
I want to test it against real WBGT sensors and real logged heat incidents, because right now it's built on OSHA and NIOSH thresholds and historical replays but has never been checked against a real worksite. I also want to hand it to actual crew supervisors and hear what they like and don't like about it.


Log in or sign up for Devpost to join the conversation.