-
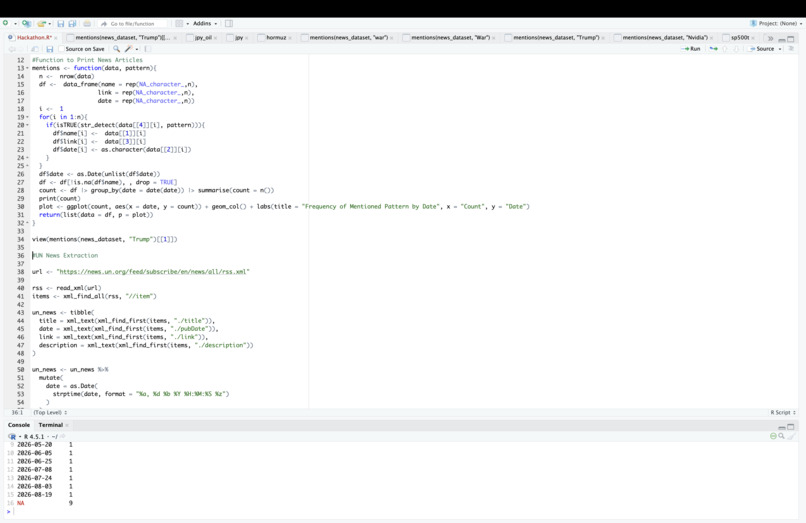
Here is the code producing relevant news articles and a plot of their frequency by date
-
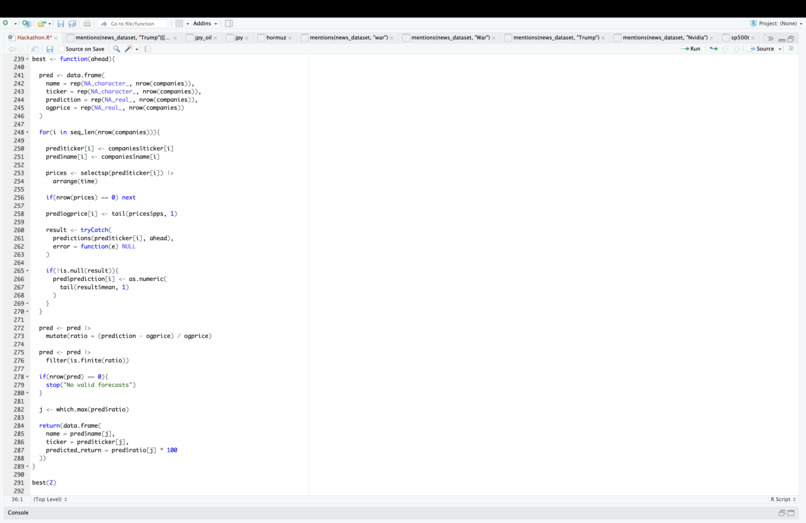
Here is the code finding the company in the S&P 500 with the highest expected percentage increase in share price
-
-
-
-

Satellite image of the straight of Hormuz. Shows ships transiting.
-
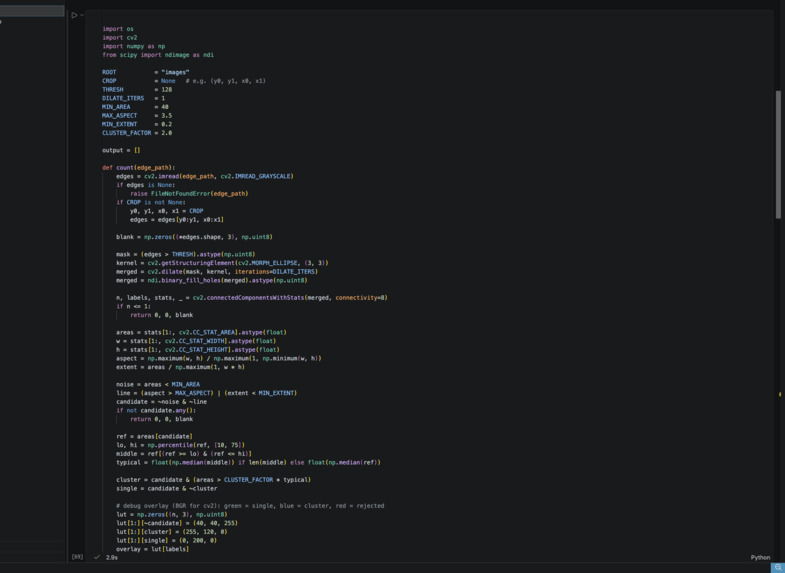
Code calling a satellite image API at month time-intervals.
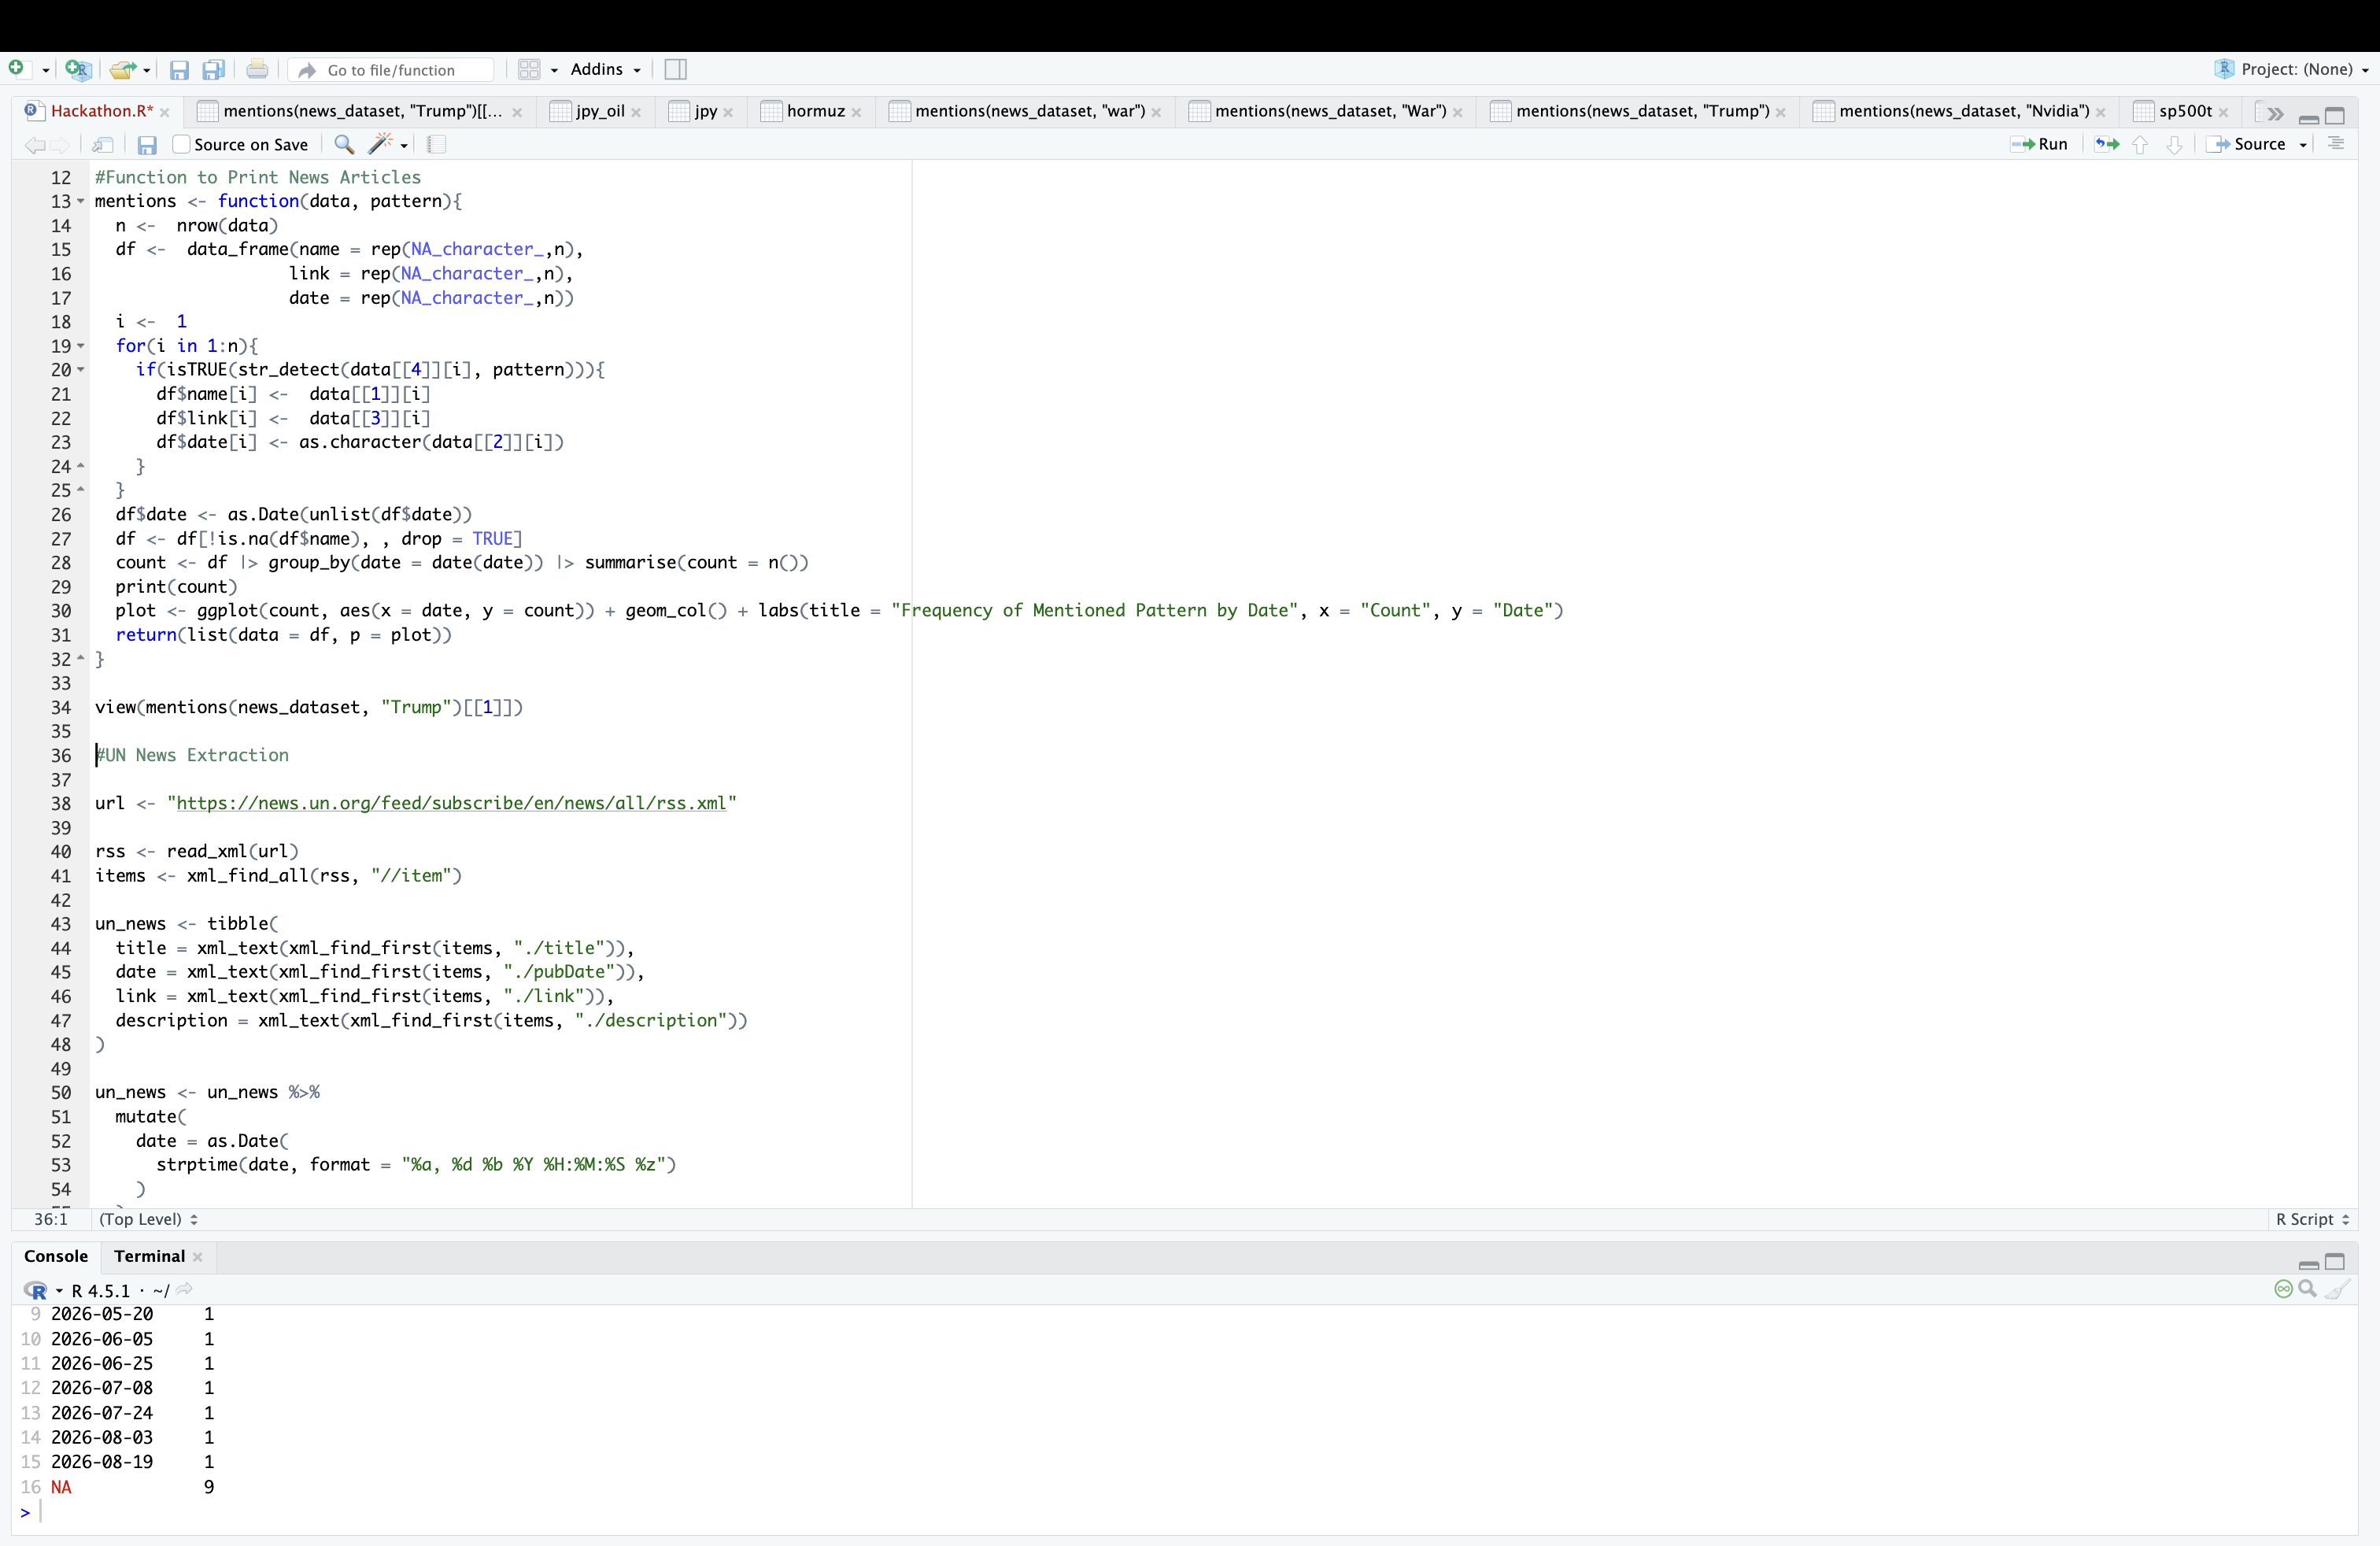
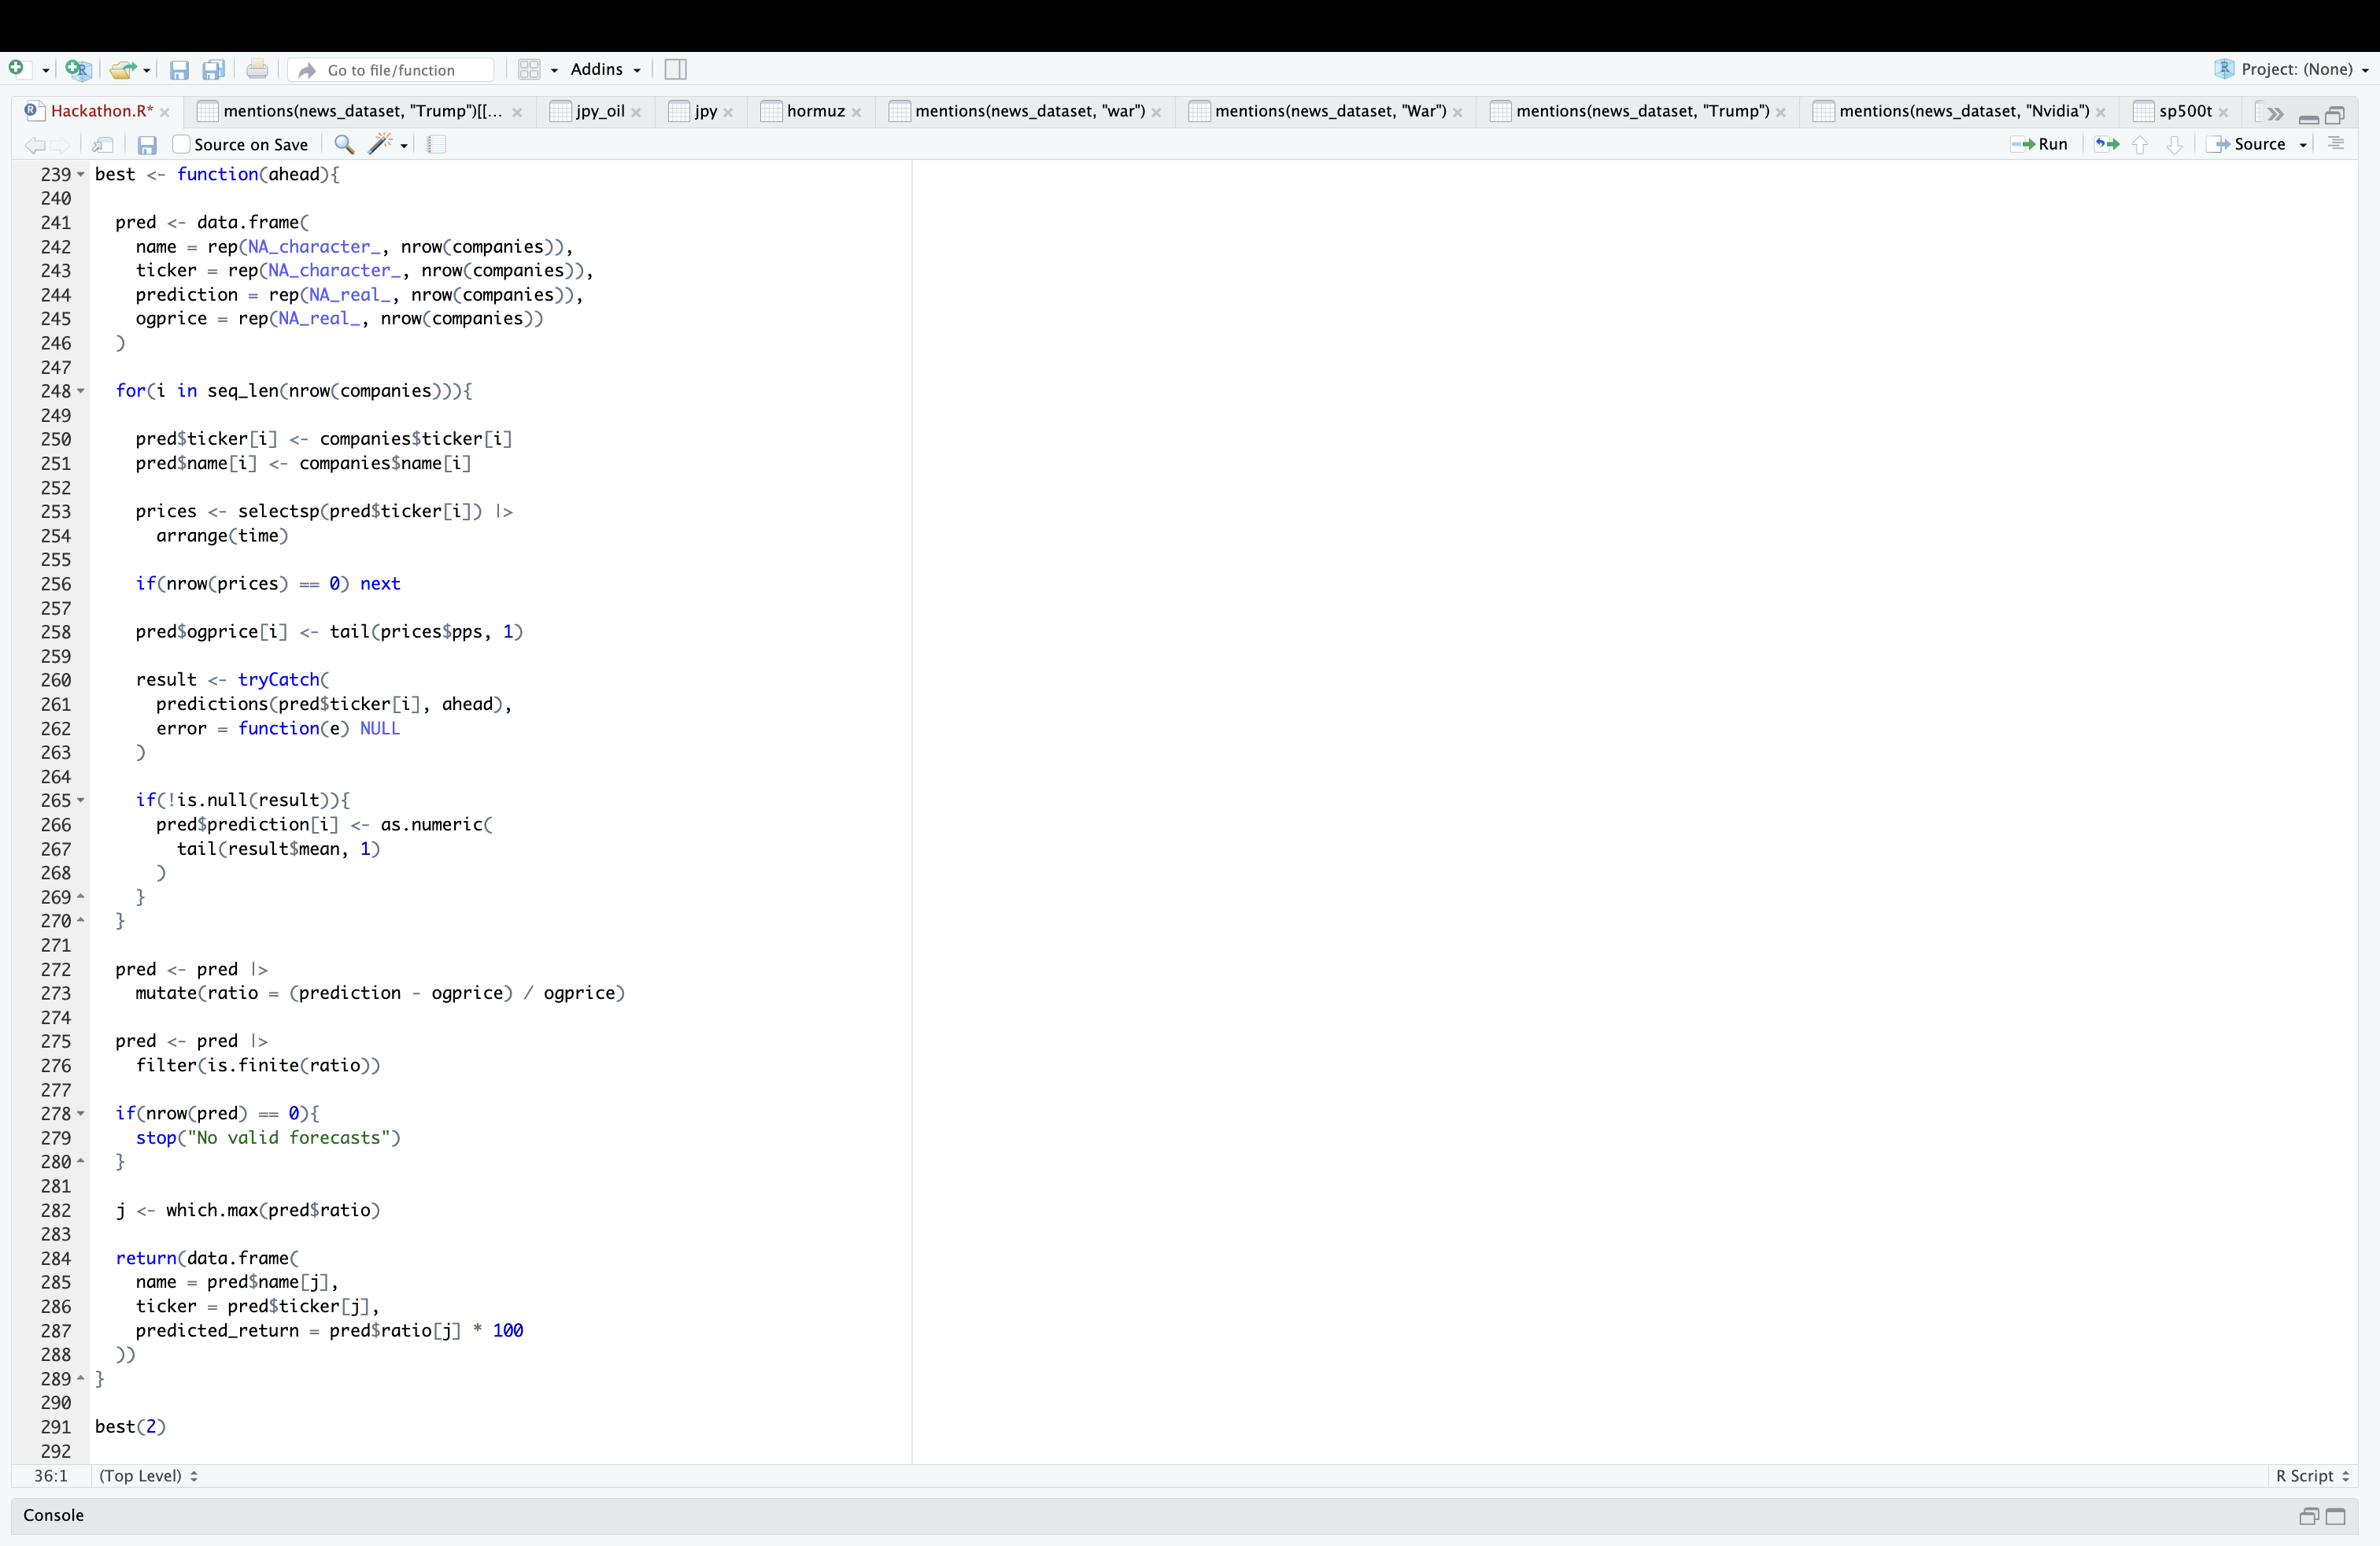
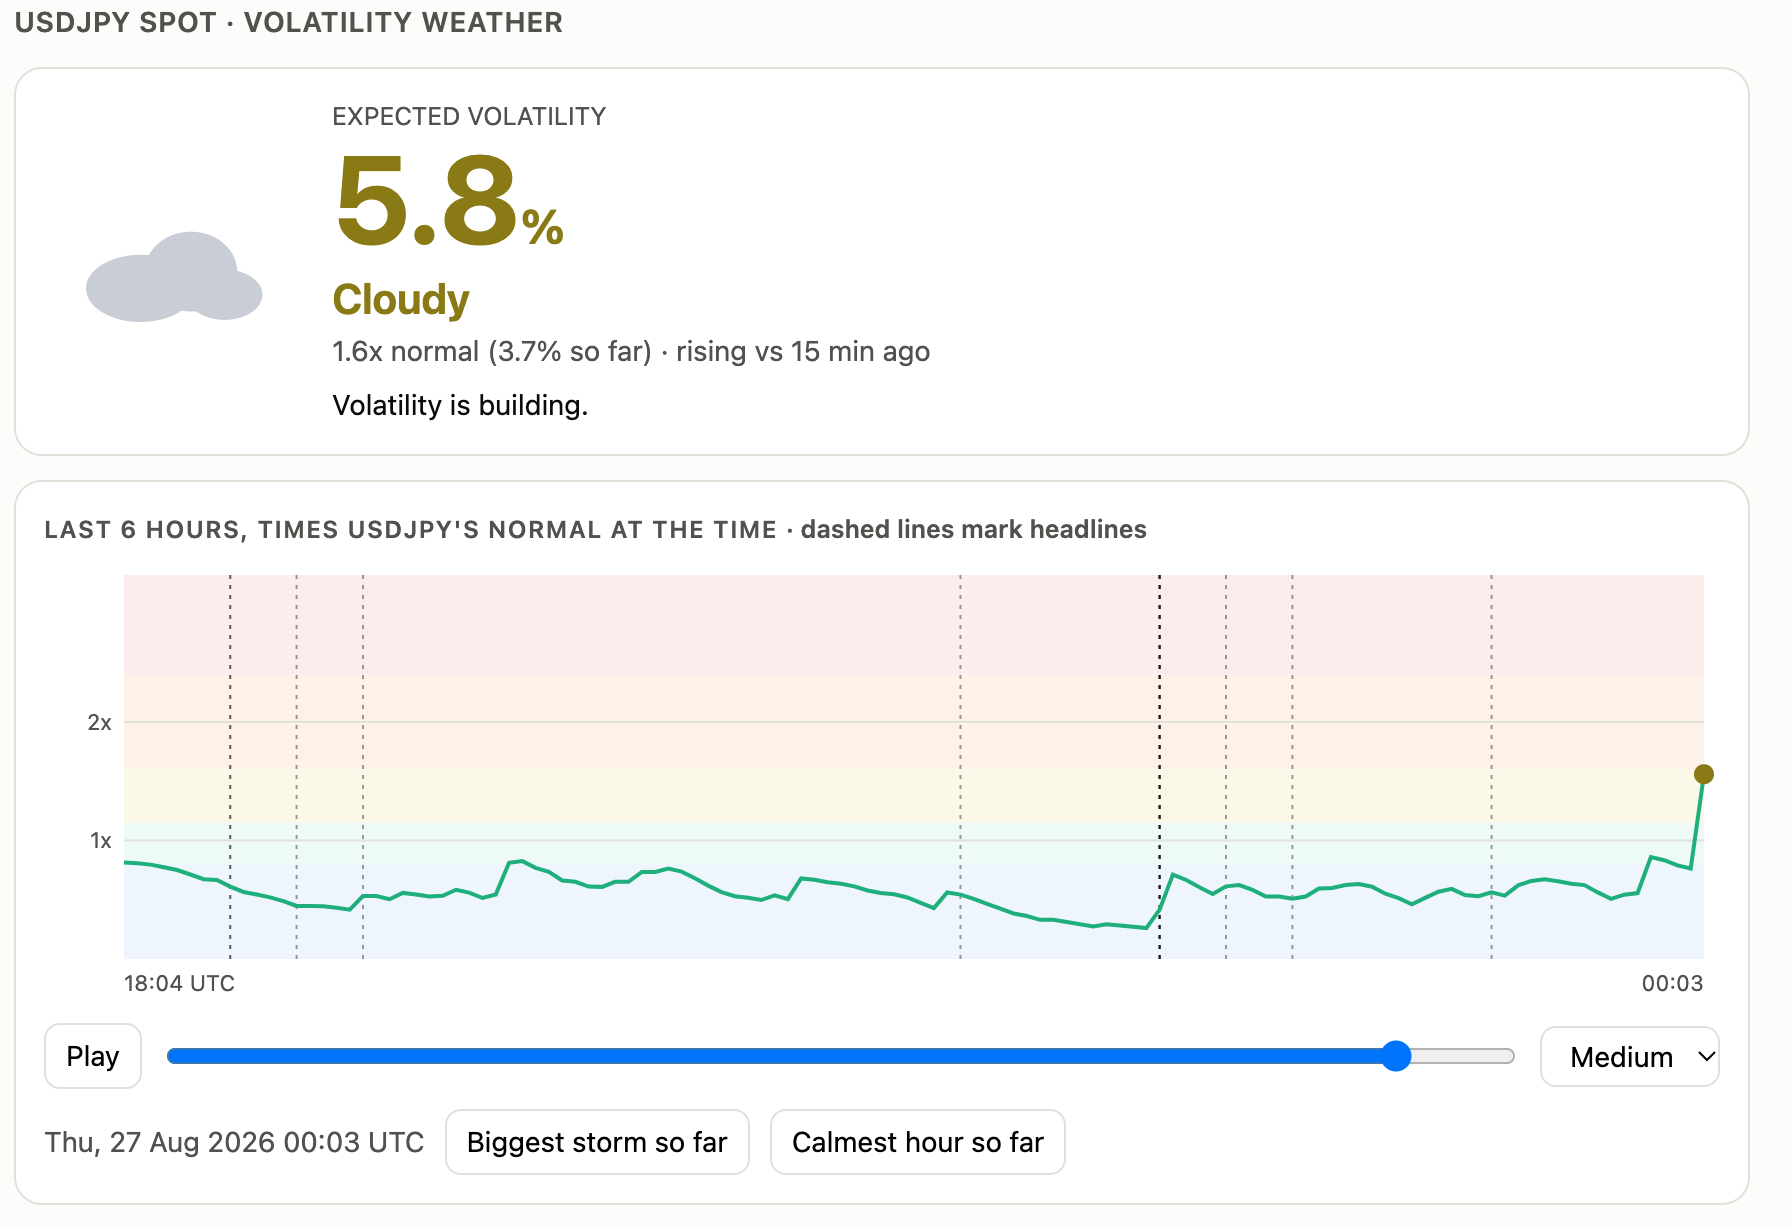
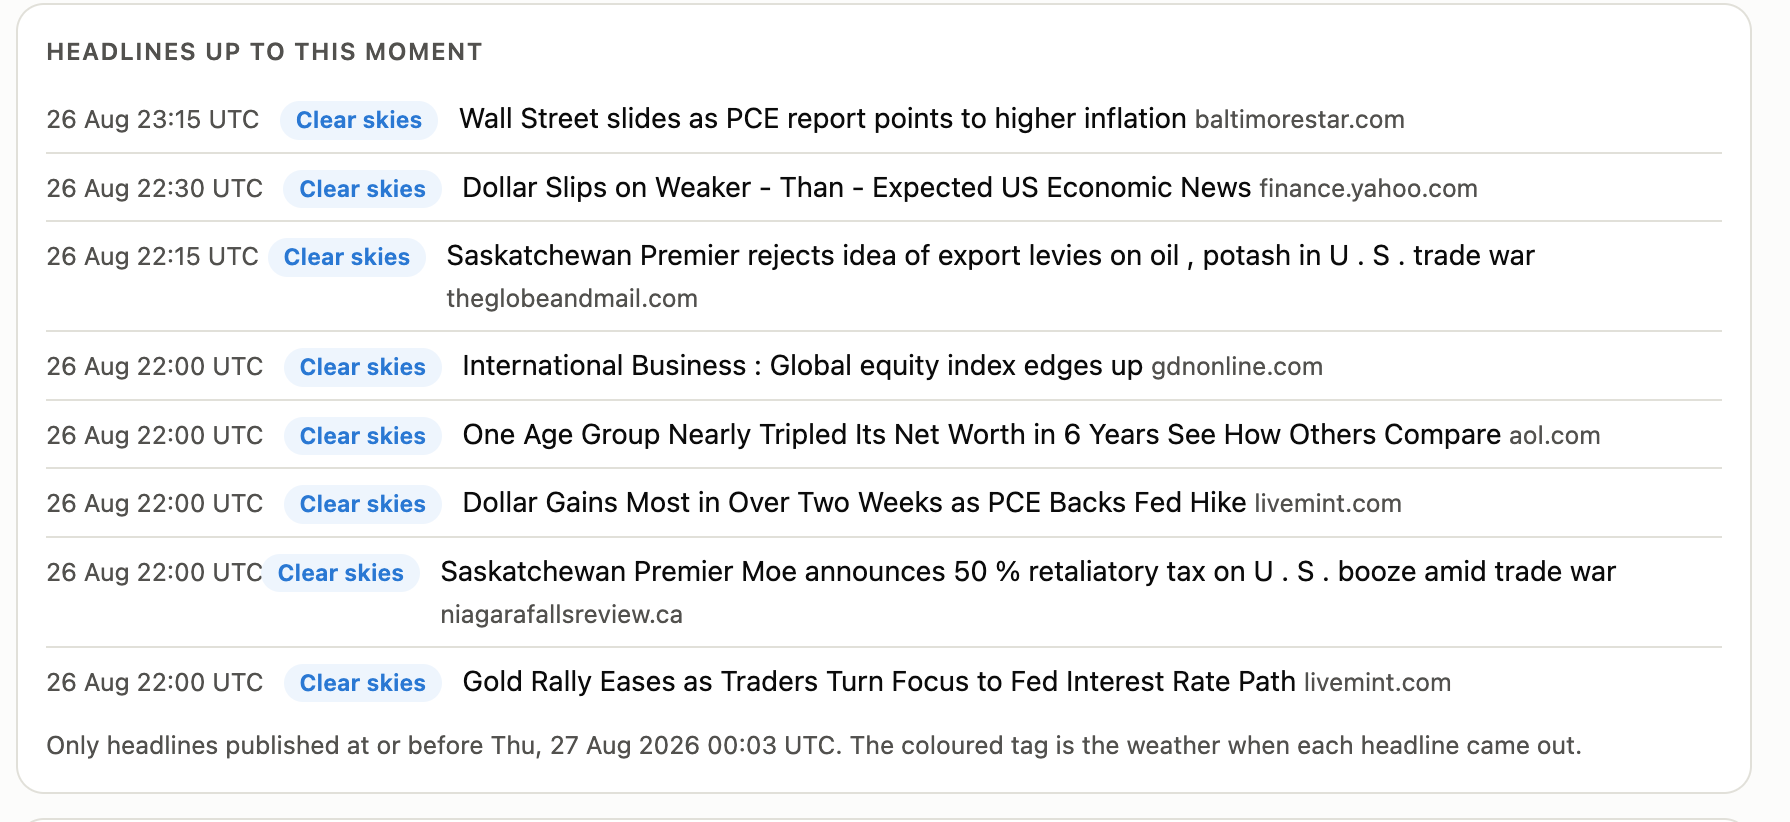
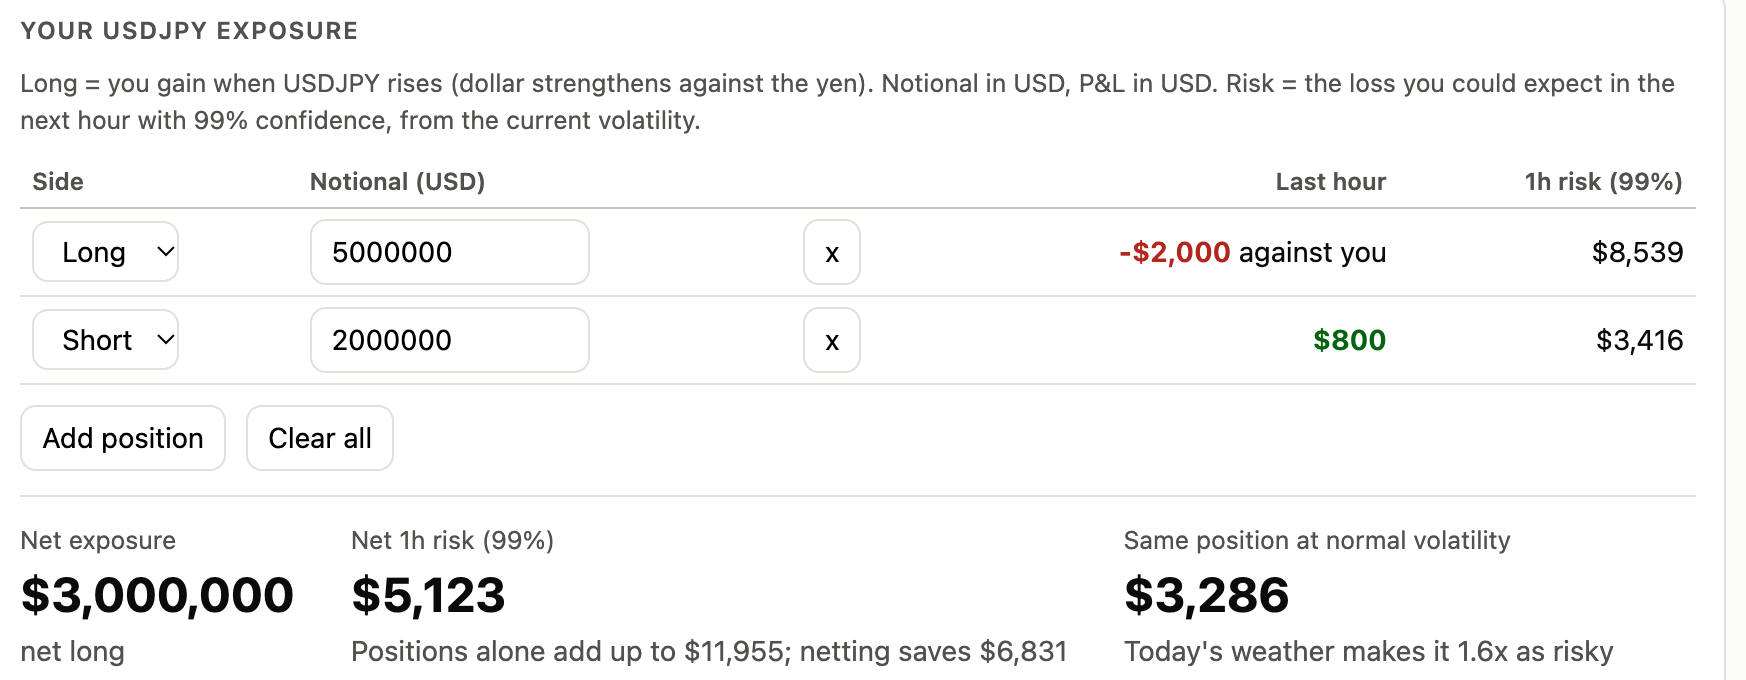

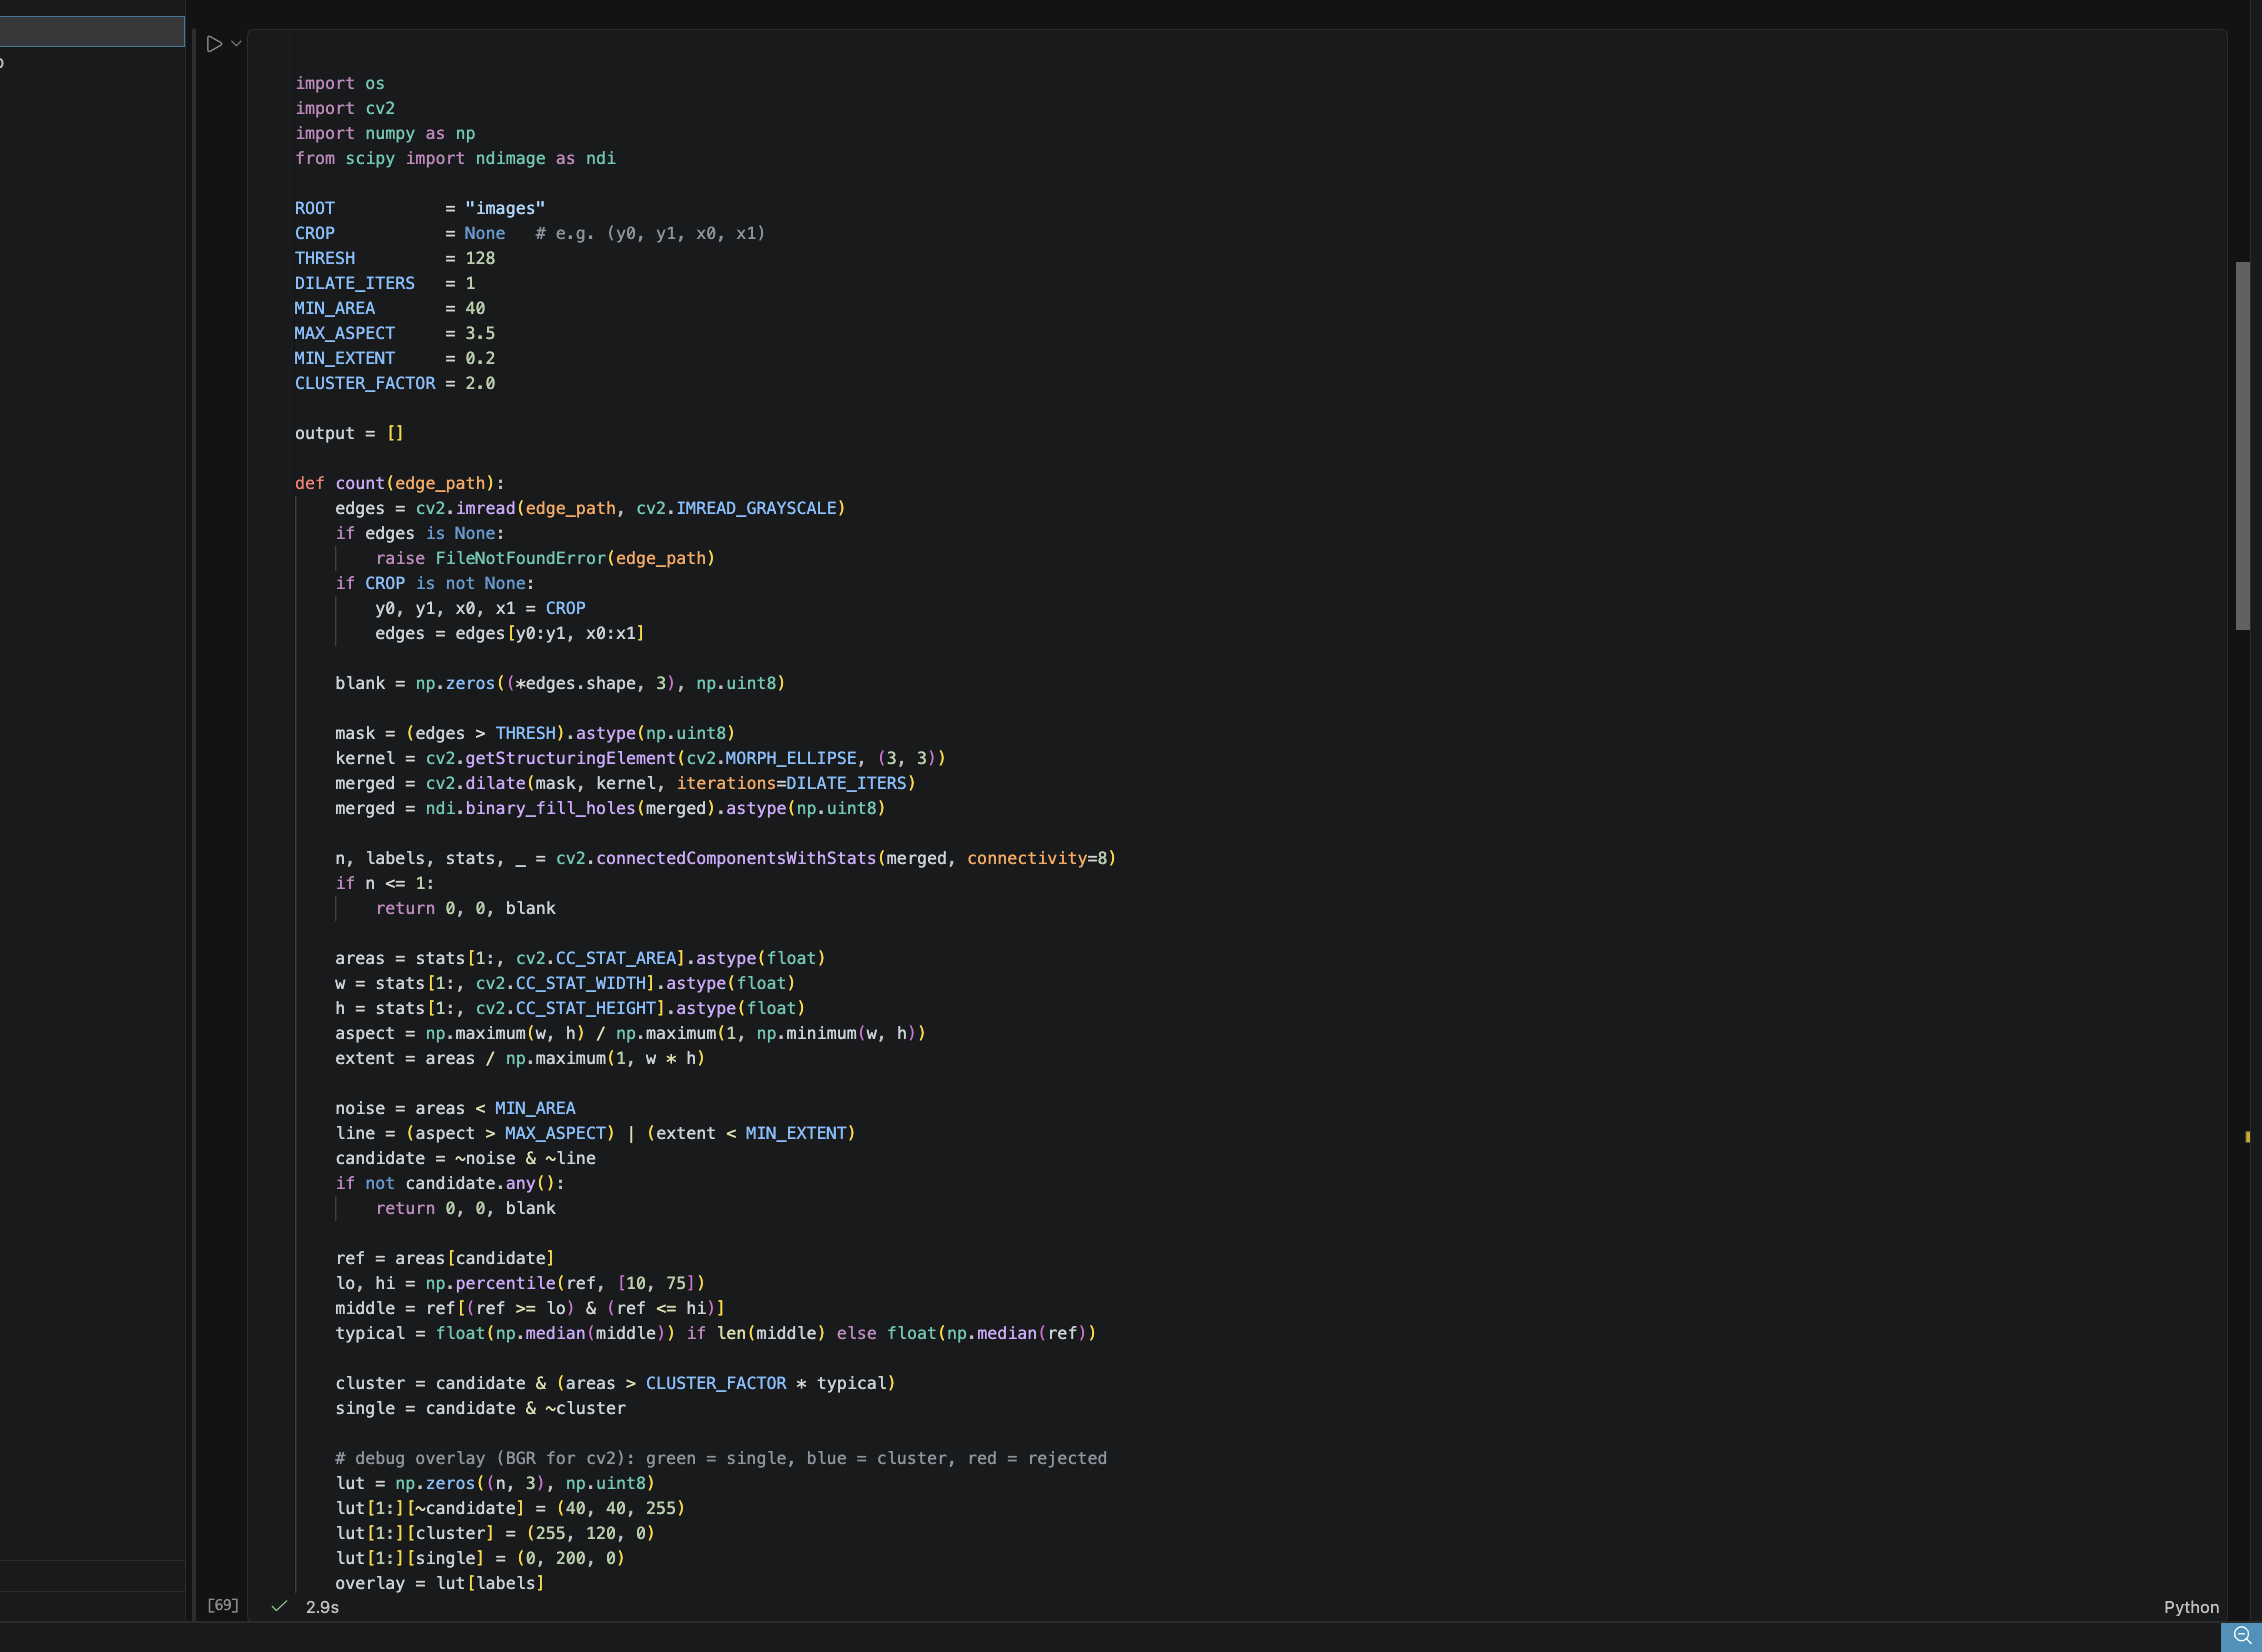
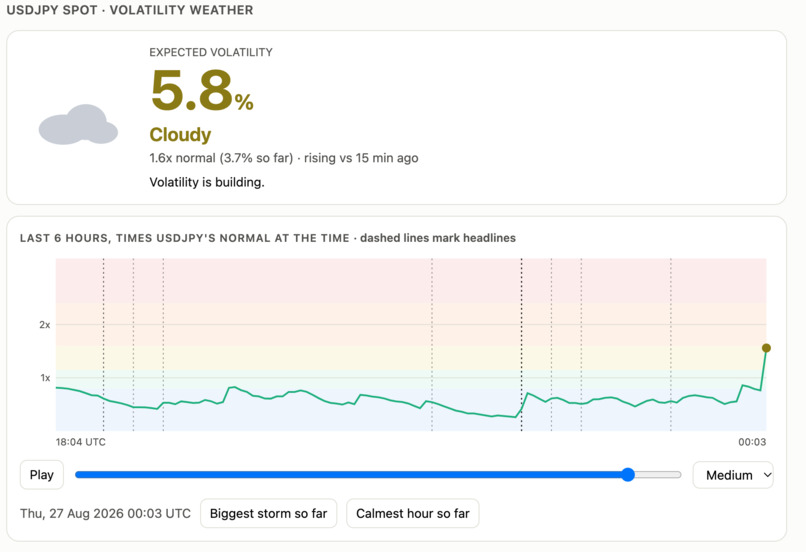
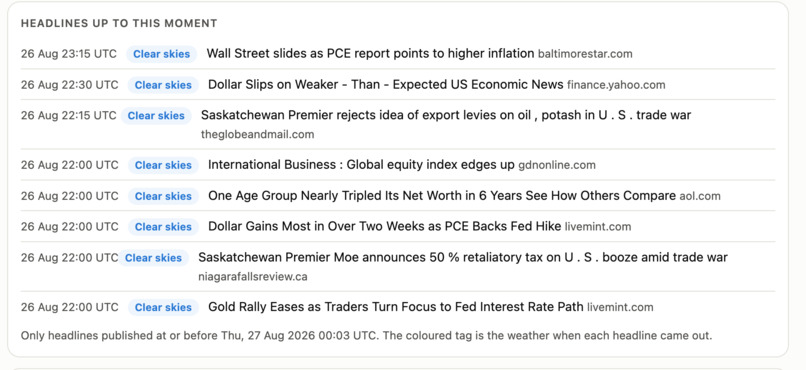
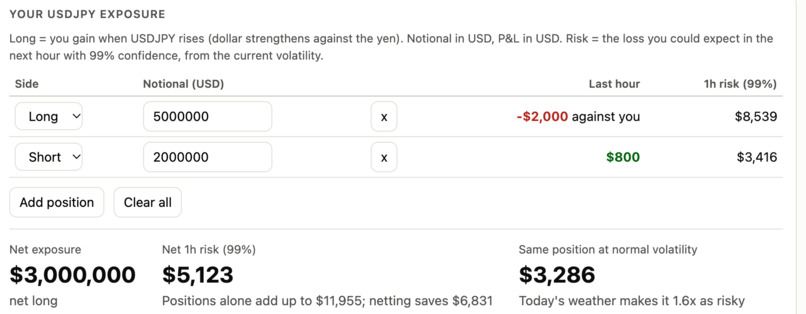
We undertook the project from SPX-FX, which was themed upon protecting investments from Risk. We aimed to build a dash board which included important news articles, data on the JPY to USD, and data from the Straight of Hormuz. Our idea was to build a dashboard containing helpful information which could help you make investment decisions. We each decided to tackle different areas of the dashboard in order to best divide the project and split it up. We met many challenges along the way, which including difficulties with finding and cleaning data and getting it into a clear and understandable form. We agreed that we should look for important factors which might affect exchange rates. One factor was the number of ships entering and exiting the straight of Hormuz every day. Joe tackled this, pulling satellite data and built a computer vision system that counted the number of ships and then used this number as a proxy for economic indicators. Theo decided to tackle which investment decisions might work best to give us maximum predicted returns in some given time period. He obtained a dataset on the share prices of the S&P 500 companies, and used ARIMA models to predict the share prices, allowing us to find out which company could give us the largest return on investments. He also developed code to scrape well known news sites for relevant news articles using a keyword such as 'Trump' or 'Oil'. Haran worked on the core of the dashboard presenting a weather forecast indicating periods of volatility. For example, stormy suggests a period of high volatility. We also have exposure on the dashboard, showing the risk for taking different short or long positions during that time. The weather forecast is based on the USD JPN Spot data and takes the past price differences with exponentially decaying weights as you go further back and compares this with the past median price. This takes advantage of the fact volatility clusters.
There is certainly much room to expand here. The main problem is that our dashboard is somewhat slow frequency, whereas what is required is high frequency. Sadly we don't have time to expand on this as much as we would like to!
