-

Homepage
Inspiration
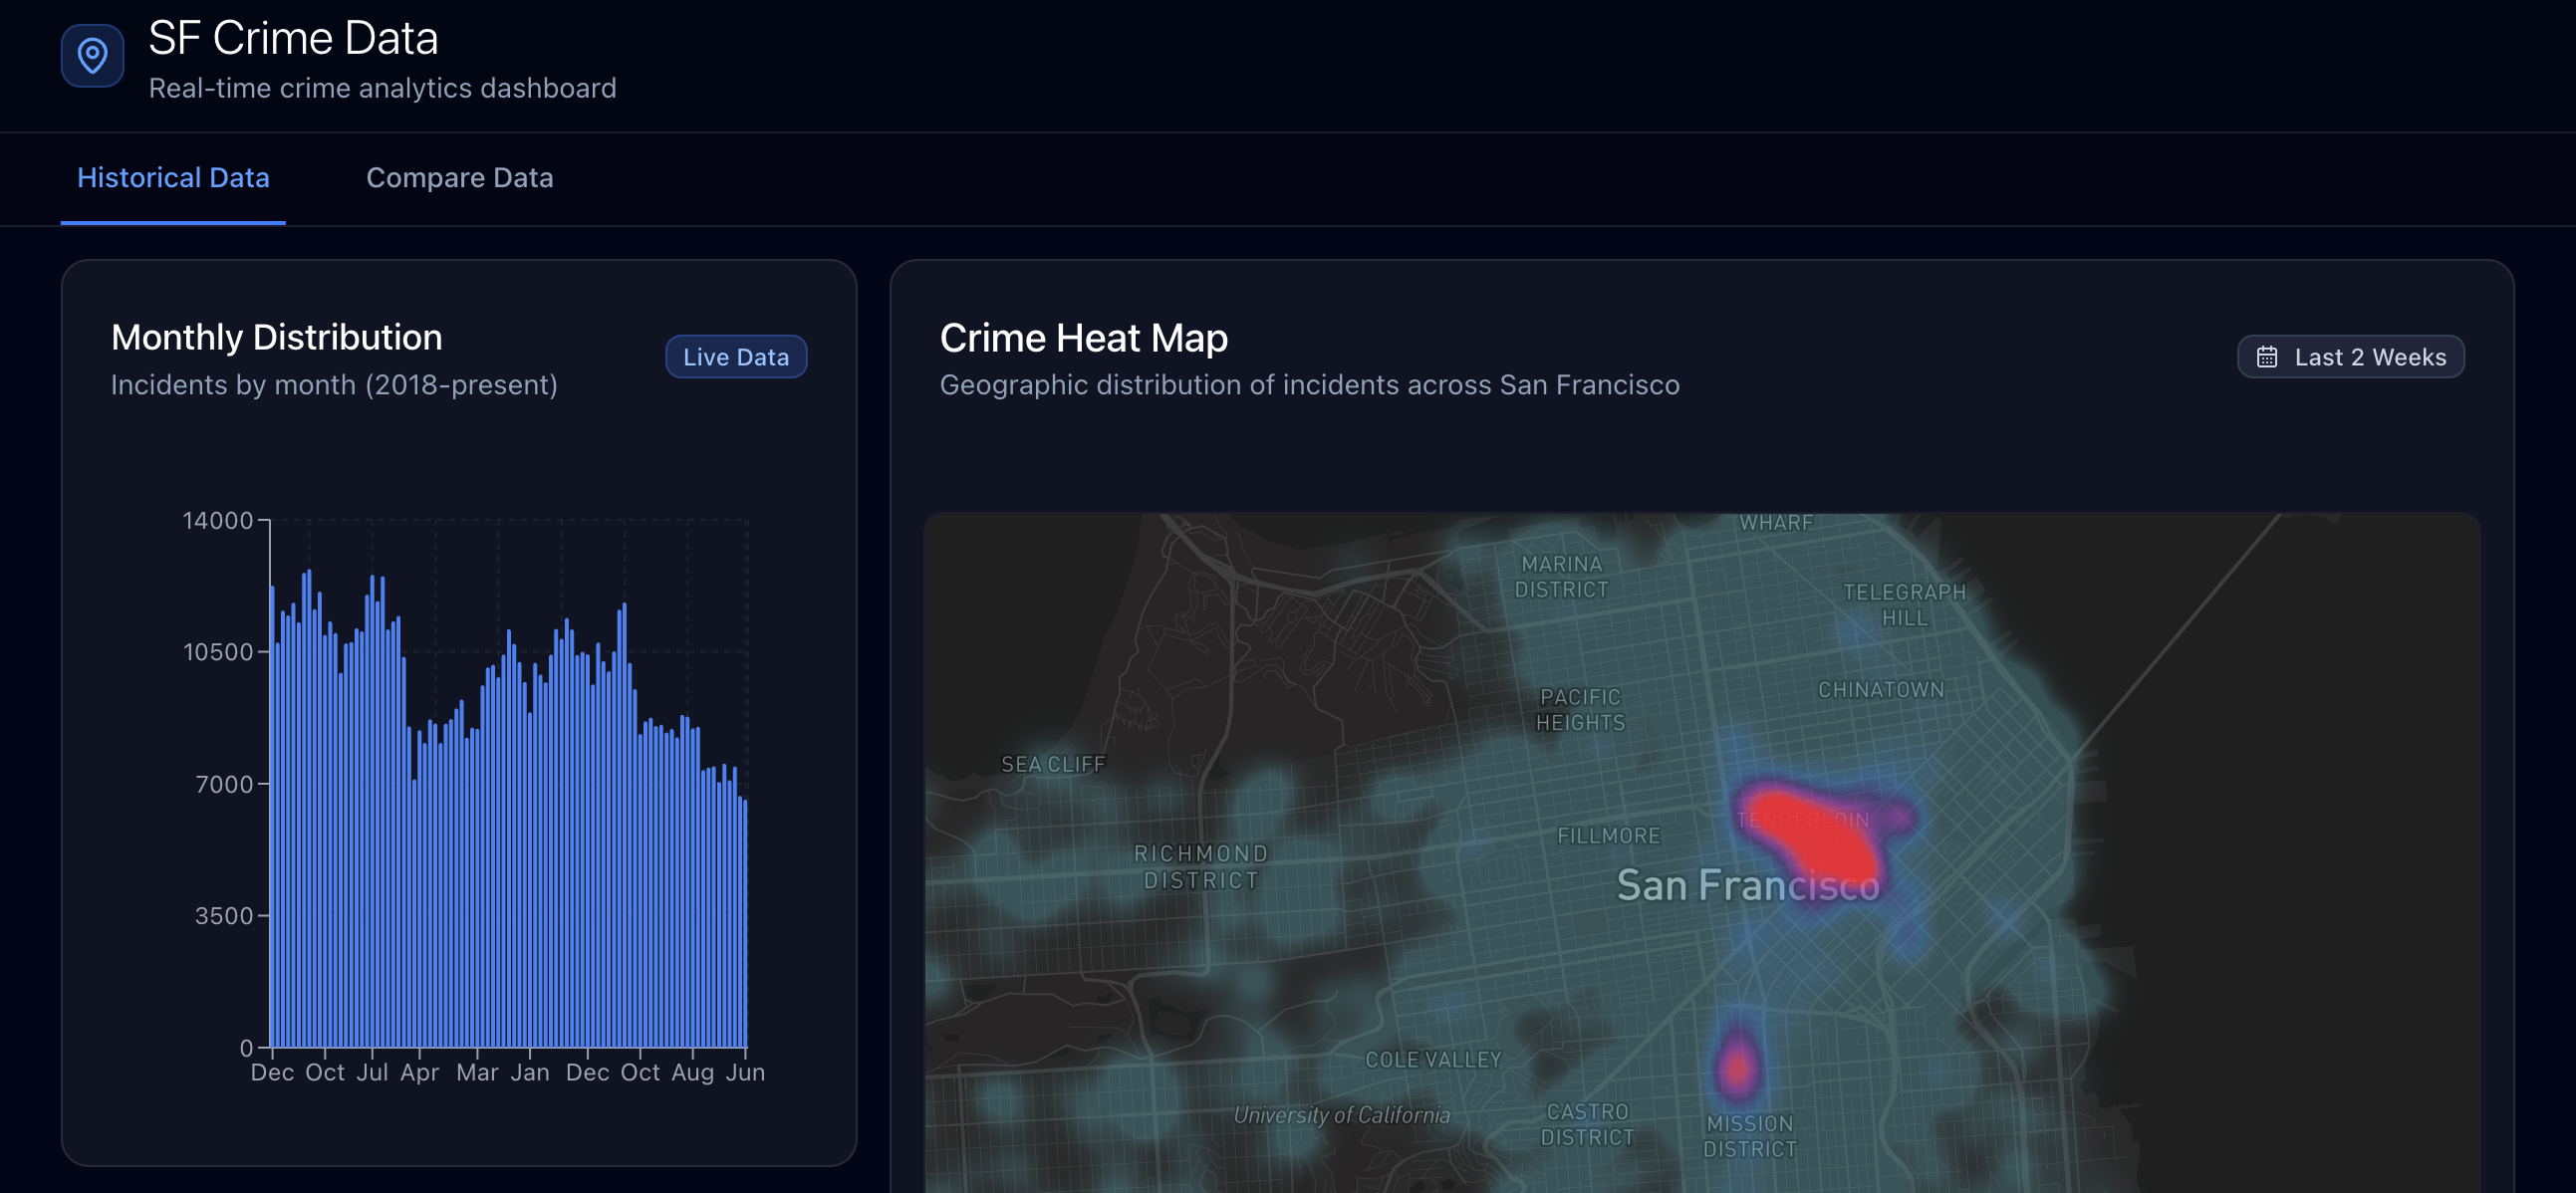
I just moved to SF and making sense of whether the city is improving or getting worse can be difficult. Visualizing public datasets on crime is an easy way to cut through the noise on the internet.
What I Learned
The SFGov datasets are pretty good and easy to work with overall.
How I Built It
I felt I'd need a database for more advanced analysis, so I started by analyzing the dataset and then dumping it into a SQL database. Then I built a nextjs app to visualize things I thought would be interesting.
Challenges
Performance is still a challenge, a lot of the data can be cached so I want to add another database table for cached views of the data.
Built With
- nextjs
- python
- typescript
- vercel

Log in or sign up for Devpost to join the conversation.