-
-
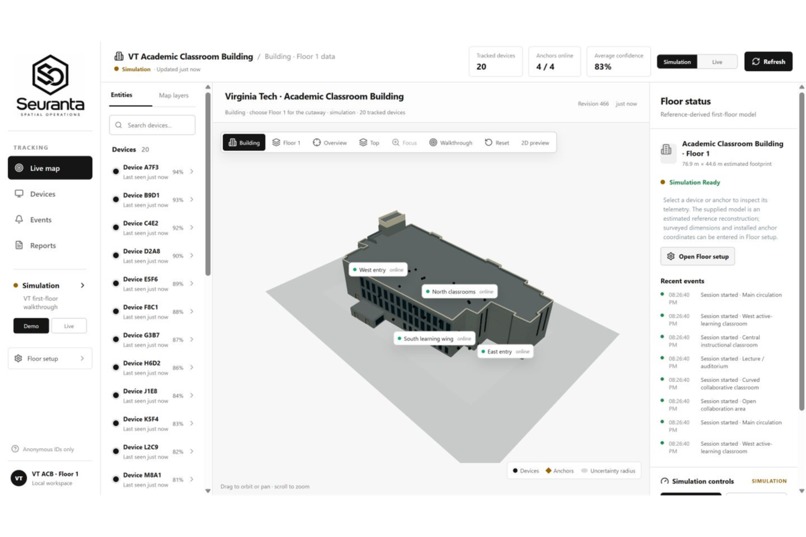
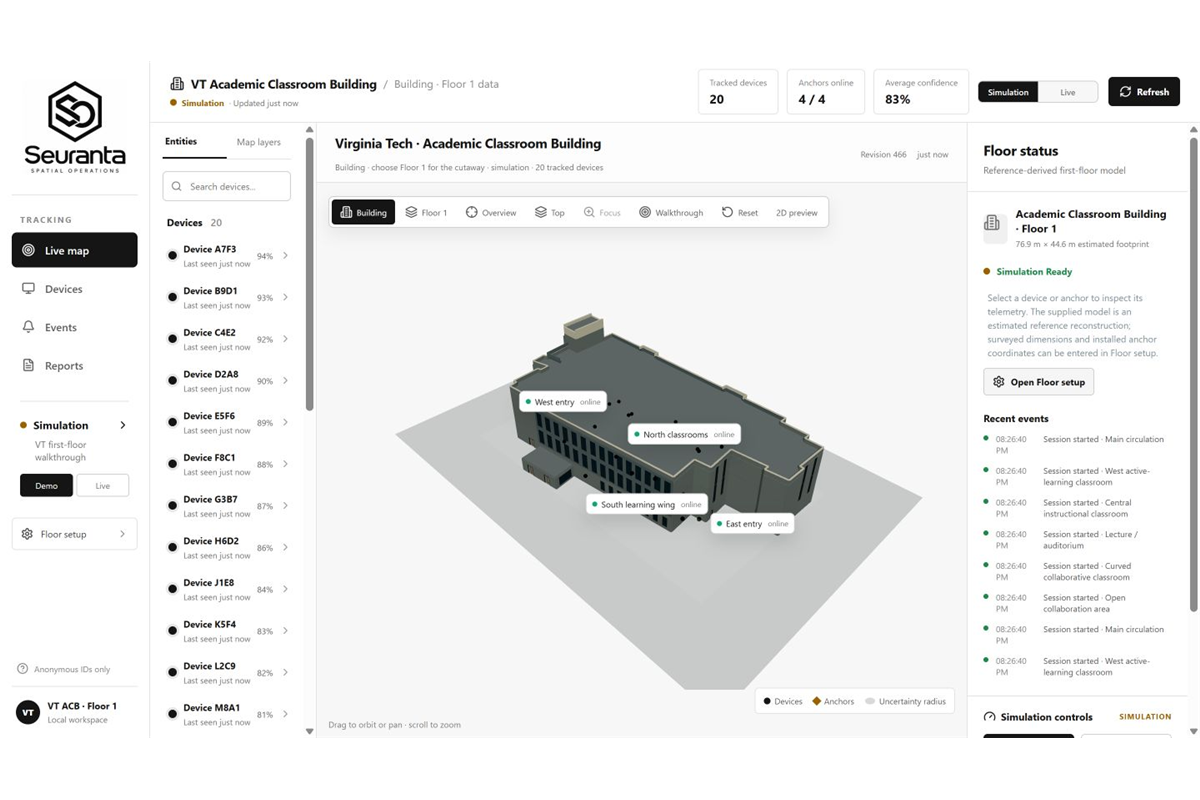
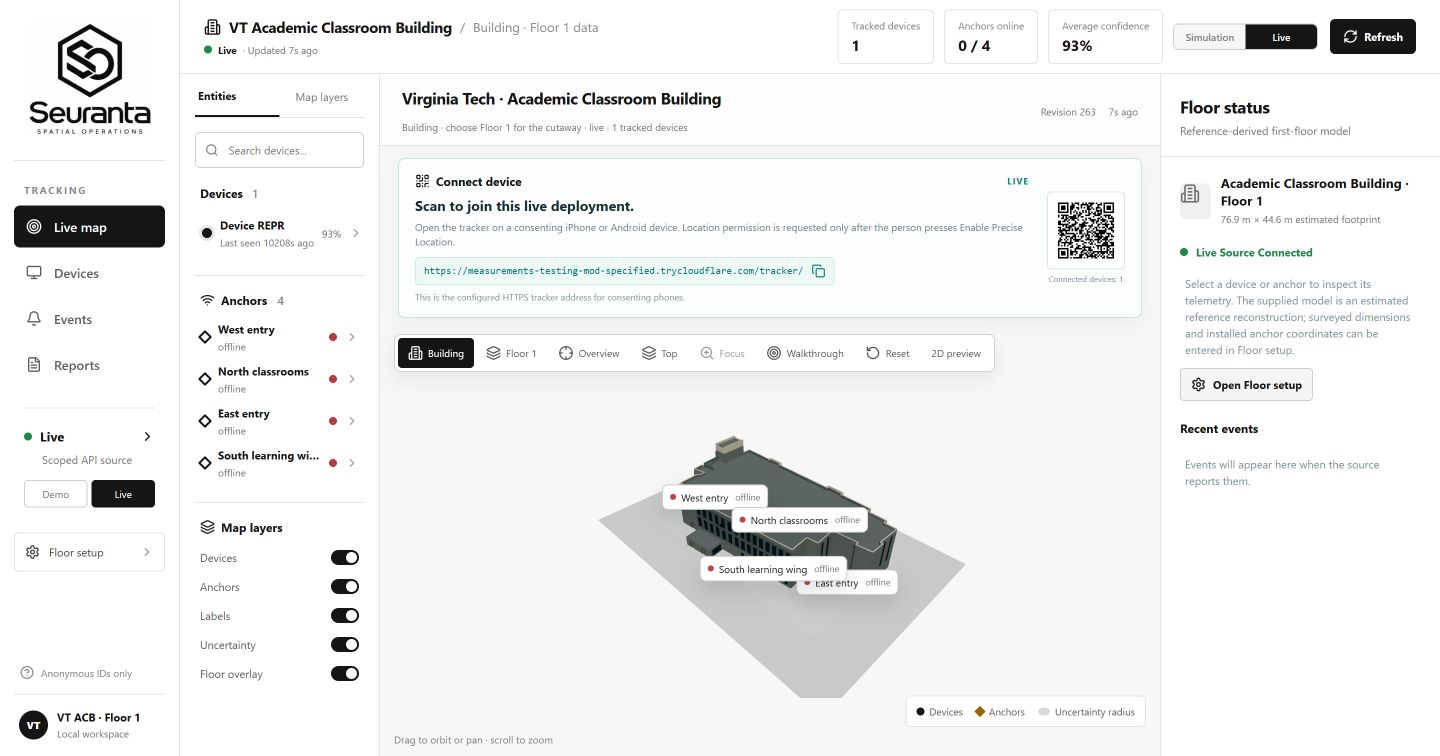
Wide-area Seuranta dashboard for authorized teams monitoring anonymous device activity, building status, and recent events.
-
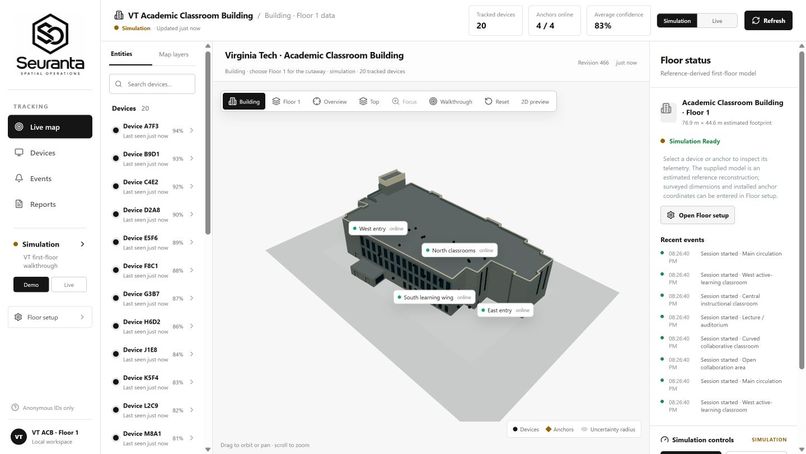
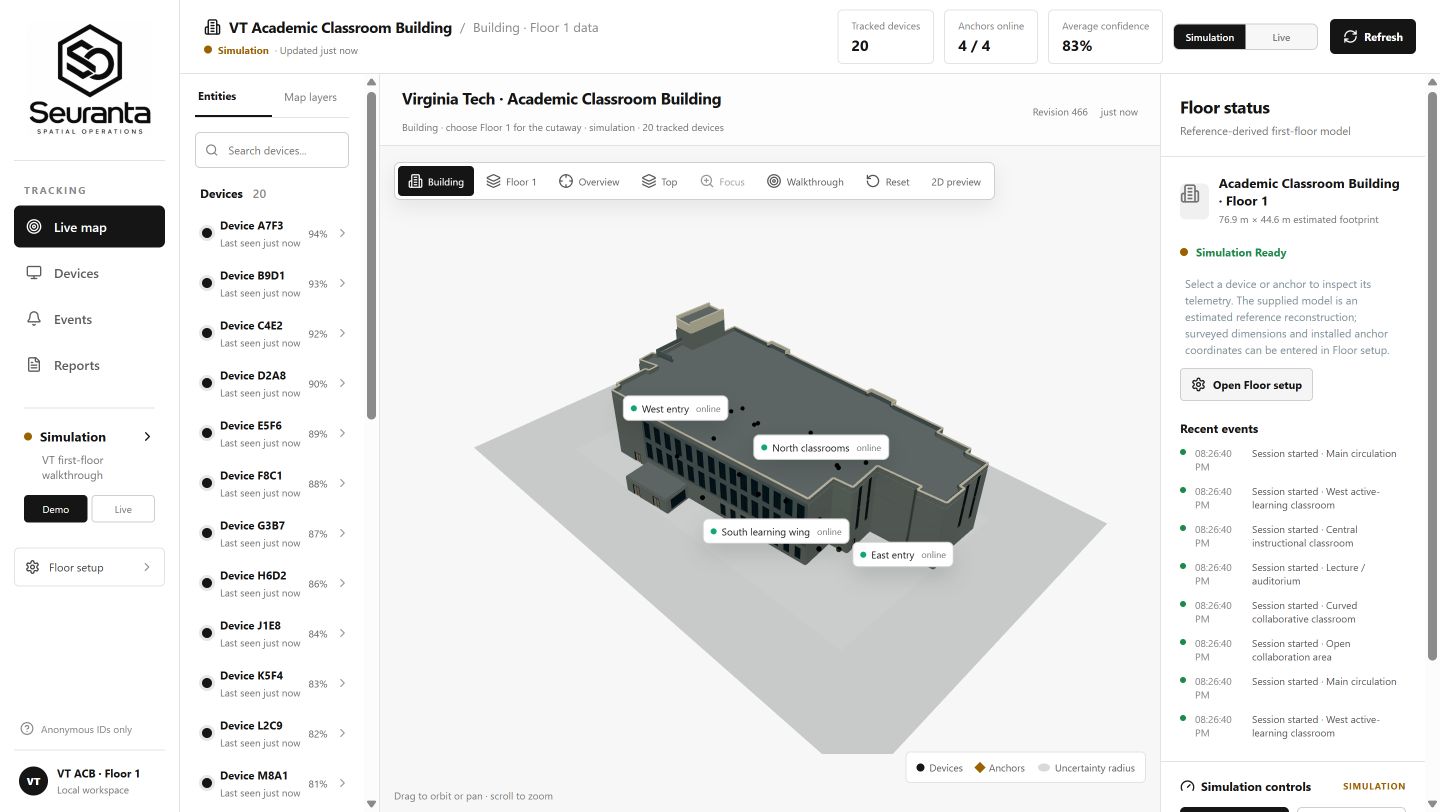
3D building view showing anonymous devices as black spheres and planned anchors across the Academic Classroom Building.
-
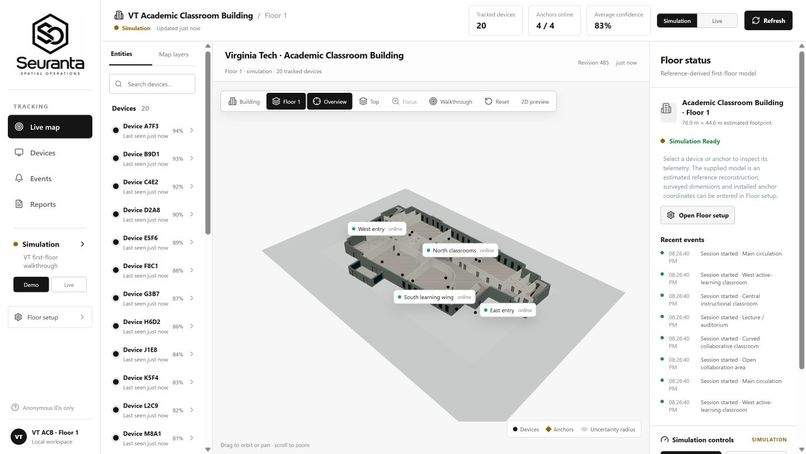
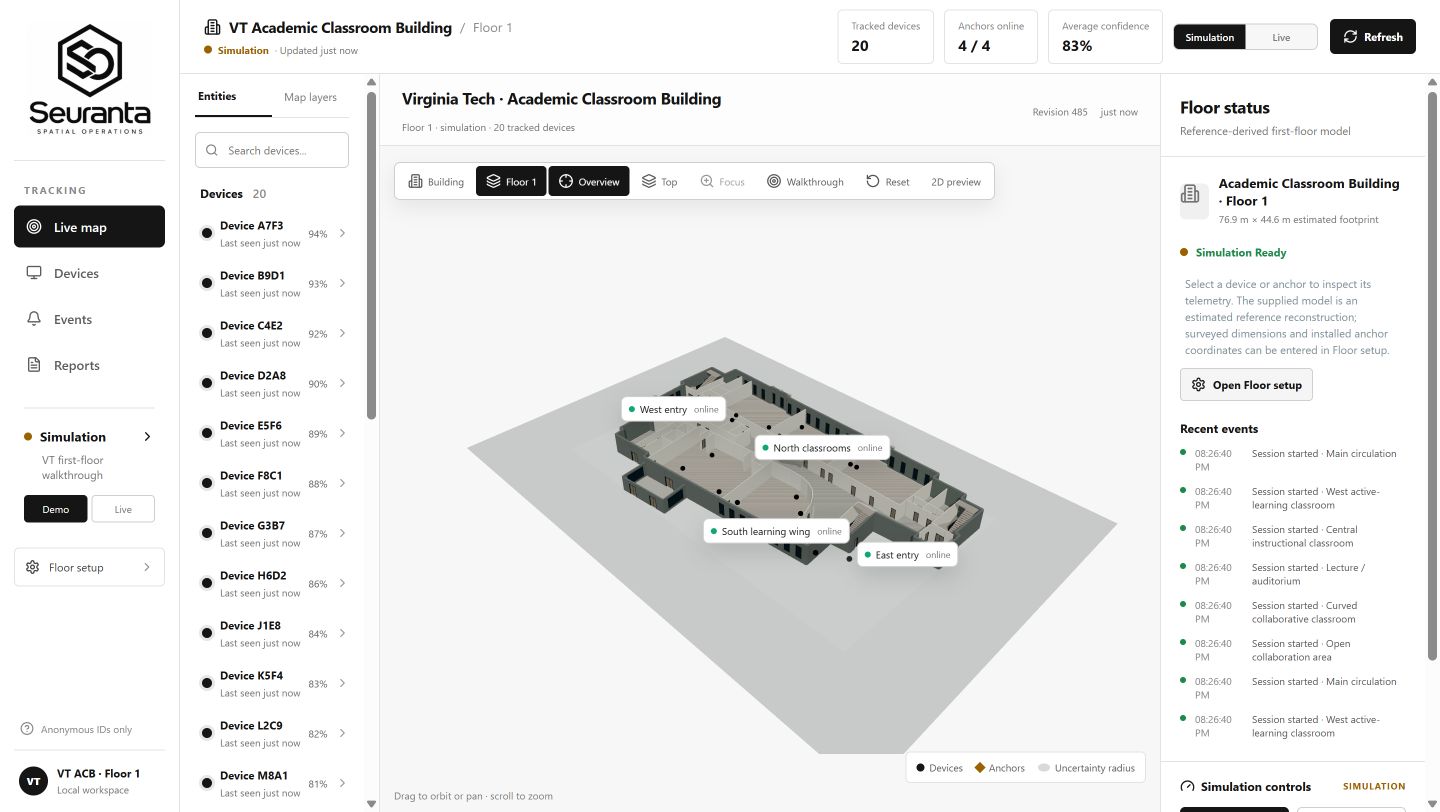
Floor 1 cutaway showing estimated anonymous device positions across classrooms, entrances, and shared spaces.
-
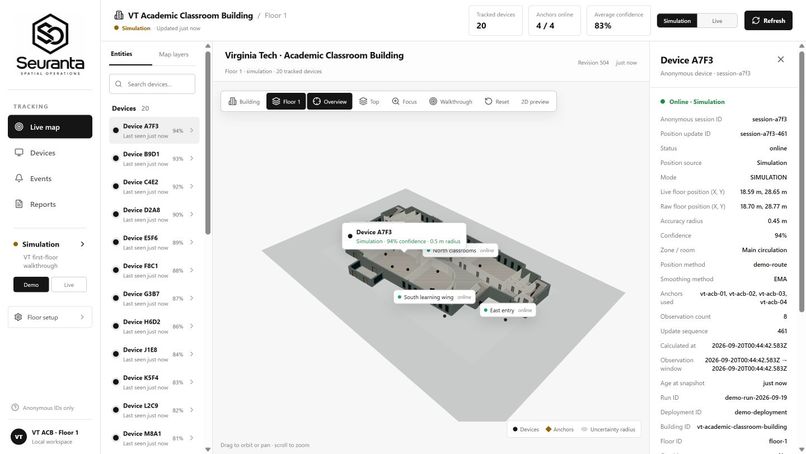
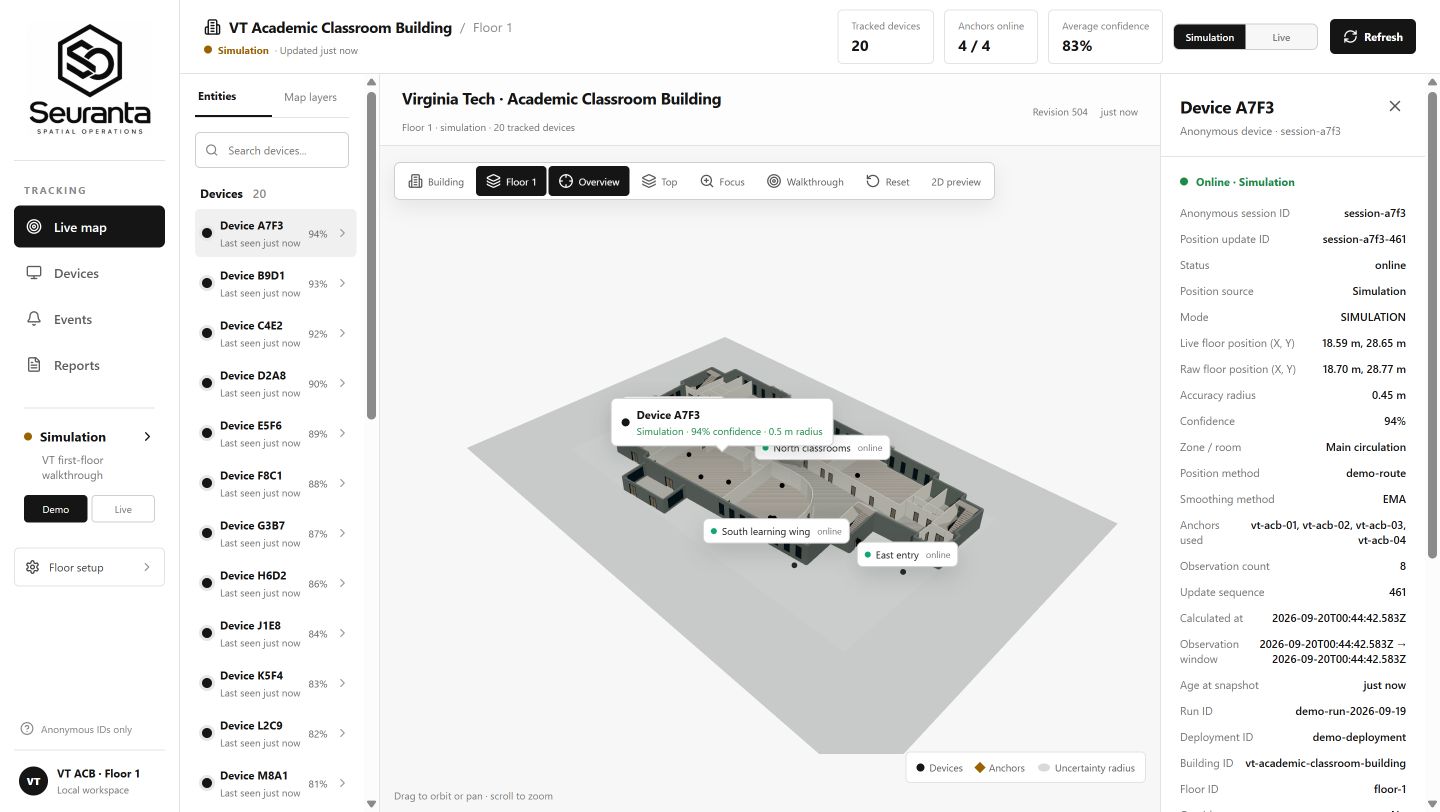
Selected anonymous device with estimated position, confidence, uncertainty radius, source, and latest update.
-
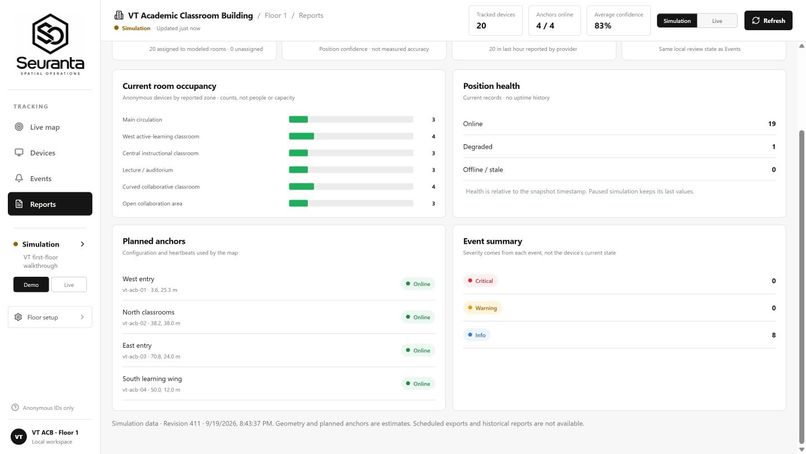
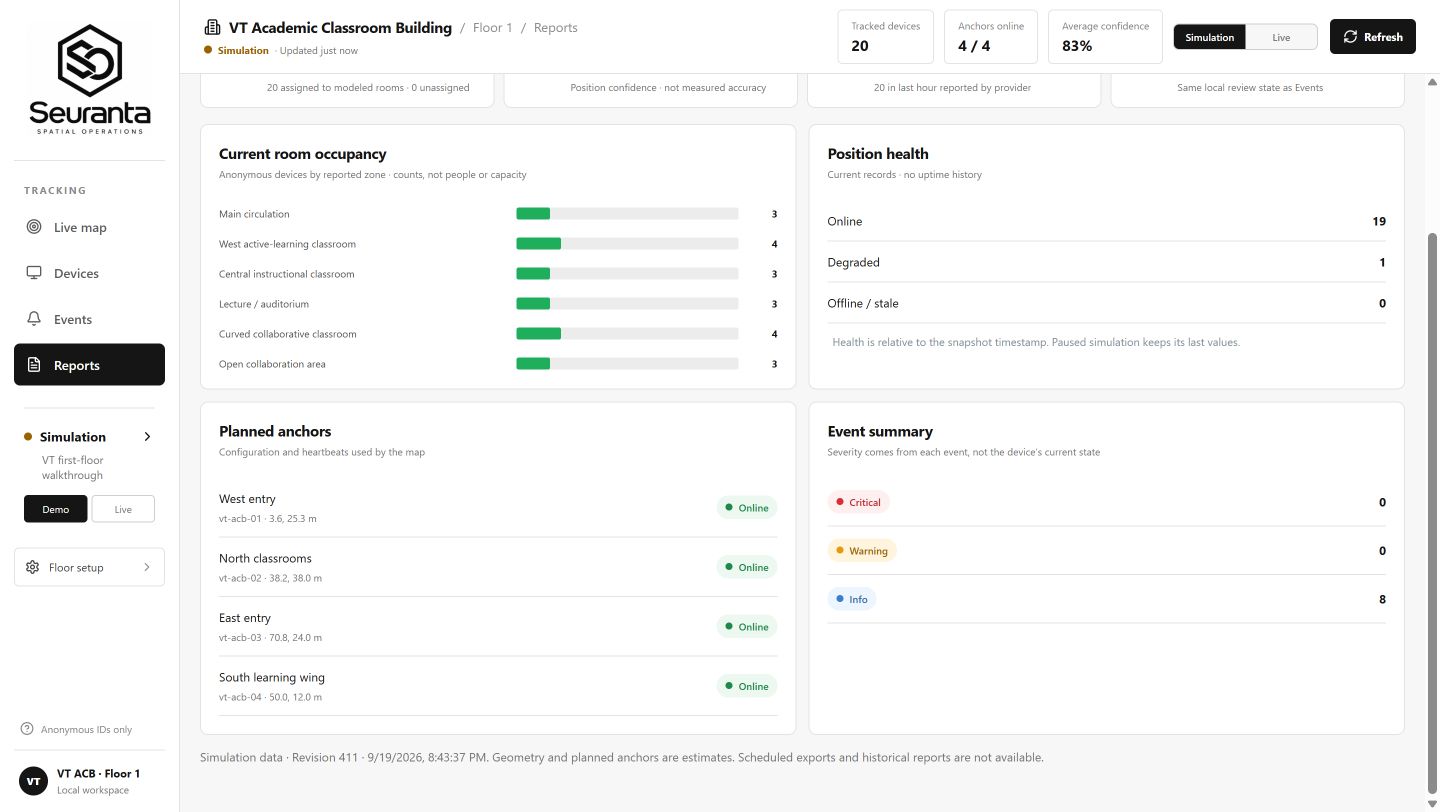
Reports summarize anonymous device counts, room activity, position health, anchor status, and event totals.
-
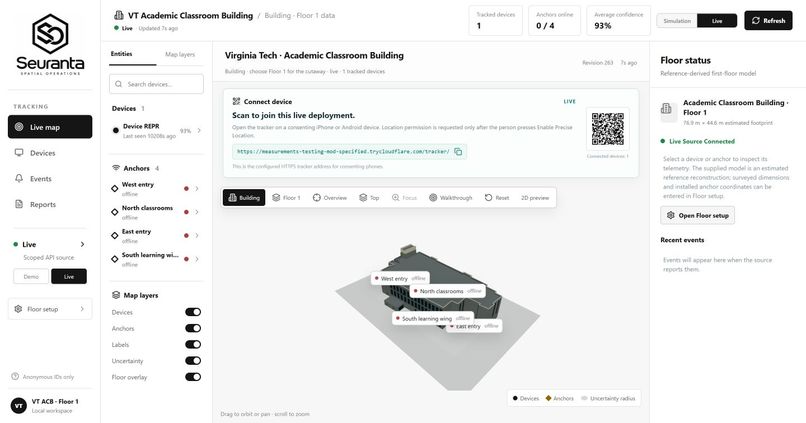
Live QR onboarding lets a consenting participant choose whether to share precise location with the monitoring dashboard.
-
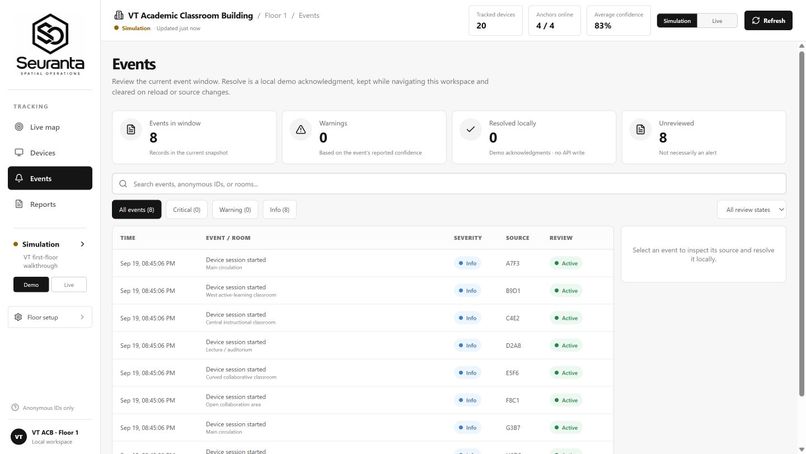
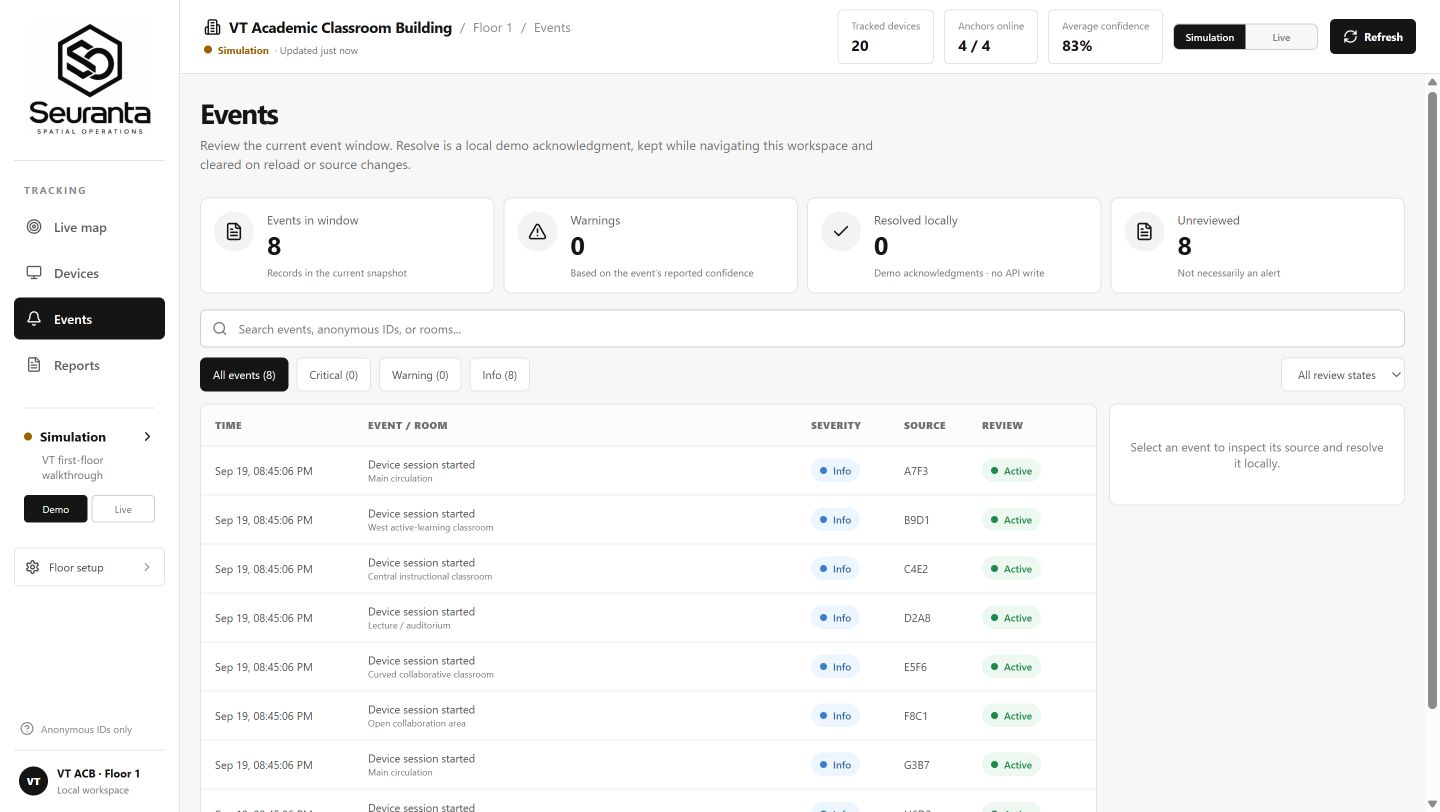
Events view for reviewing anonymous activity by time, room, severity, and device ID.
Inspiration
Large buildings and public spaces generate constant movement, but the tools used to monitor them are often disconnected. Security teams may have cameras, sensors, reports, and alerts without one clear picture of how activity is distributed across the entire site.
We started with a simple question: what if an operator could understand a large environment from one live spatial view?
That idea became Seuranta, a spatial surveillance and operations platform that transforms anonymous device-location estimates into an interactive map. Our first target environment is Virginia Tech’s New Classroom Building, but Seuranta is designed as a scalable platform that could be configured for malls, campuses, transit hubs, event venues, warehouses, and other large facilities.
Instead of forcing operators to interpret coordinates or switch between disconnected systems, Seuranta places activity inside the environment where it is actually happening.
What it does
Seuranta displays anonymous device-location estimates as live-updating black spheres on a 3D model of the monitored environment.
Operators can:
- View activity across the full building
- Focus on an individual floor
- Search for and select a device
- Review its estimated position, room, confidence, uncertainty radius, source, and latest update
- Monitor anchor and system health
- Study general foot-traffic patterns
- Review events and historical reports
- Switch between a 3D model and a simpler 2D view
The dashboard is designed to support large-area surveillance, crowd-flow analysis, security operations, facility management, and monitoring of restricted or sensitive zones. For example, a mall could use aggregated movement patterns to understand congestion, while a security team could monitor activity near a restricted area.
In educational environments, Seuranta could support authorized campus-safety operations. Any individual-level location use would require proper authorization, notice, privacy protections, and compliance with applicable policies and laws. Seuranta is intended for transparent and authorized monitoring—not covert personal tracking.
Live mode and simulation mode
Seuranta includes two operating modes.
Simulation mode creates 20 anonymous devices moving through classrooms, hallways, and common areas. It allows us to demonstrate the dashboard, test its controls, and reproduce different traffic situations without installing the complete physical sensor network.
Live mode is designed to receive real position estimates from the backend and display them as they change. A participant can use a QR code to open the correct tracker page and connect to the current Seuranta deployment.
Simulation is our demonstration and development environment. It does not replace the intended Raspberry Pi positioning system.
How the Raspberry Pi network works
Raspberry Pis are an important part of Seuranta’s planned physical deployment.
Four Raspberry Pi devices can be positioned around a monitored area as local Wi-Fi signal anchors. Each anchor observes approved signal measurements from participating devices and sends those observations to the positioning service.
The service compares measurements from multiple anchors to estimate where a device is located on the floor. That estimate is processed by the backend and delivered to the dashboard, where it appears as a black sphere.
The positioning pipeline follows this general flow:
Participating device → Raspberry Pi anchors → positioning service → backend → live dashboard
Adding properly configured anchors can extend the system across a larger environment. However, indoor Wi-Fi conditions are affected by walls, reflections, interference, device differences, and anchor placement. A real installation therefore requires measured anchor locations, calibration, and on-site testing. Seuranta displays confidence and uncertainty information so operators can understand that a location is an estimate rather than a perfect coordinate.
How we built it
The frontend is built with React, TypeScript, Vite, Three.js, React Three Fiber, and Zustand.
Three.js and React Three Fiber power the interactive building model, device markers, camera controls, floor views, and walkthrough experience. Zustand keeps shared state consistent across the Dashboard, Devices, Events, and Reports pages. We also included a 2D fallback for systems that cannot use the full 3D experience.
The backend uses Python, FastAPI, Pydantic, REST endpoints, WebSockets, and SQLite. It manages anonymous sessions, validates incoming telemetry, stores current records, and sends updates to the dashboard.
The Raspberry Pi edge software is designed to collect observations, buffer batches when a connection is interrupted, report anchor health, and safely forward measurements to the computer running the positioning service.
We designed the system as a pipeline:
Signal observations → Position estimates → Spatial events → Building state and analytics → User interface
This separation makes it easier to replace simulation data with physical observations without rebuilding the entire dashboard.
How we use Databricks
Databricks supports the historical and batch-analytics side of Seuranta.
The live API and WebSocket connection are responsible for immediate dashboard updates. Databricks is designed to process larger collections of anonymous observations and events over time.
Our data architecture follows a Medallion structure:
- Bronze: raw anonymous observations, position estimates, spatial events, anchor heartbeats, and session records
- Silver: validated, cleaned, normalized, and deduplicated records
- Gold: useful operational summaries such as zone occupancy, traffic patterns, dwell time, zone transitions, anchor health, and anomaly counts
This separation allows the live dashboard to stay responsive while historical processing produces more reliable reports and long-term patterns.
Challenges we ran into
One of our biggest challenges was making location information understandable. Raw coordinates are difficult to interpret without context, so we created a visual system that connects device estimates to rooms, floors, zones, and the full building.
The mobile connection flow also required debugging. Phone location features depend on HTTPS, browser permissions, and different mobile-browser behaviors. We added clearer connection states, a REST fallback, and session-recovery controls.
We discovered a bug where a phone could remember an anonymous session after that session had ended. The backend correctly rejected the old session, but the phone remained stuck. We fixed this by detecting the ended session, generating a new anonymous identifier, and providing a visible Start New Anonymous Session option.
Another challenge was representing accuracy honestly. Indoor positioning is affected by real-world radio conditions, and our current building model is a reference model rather than a professional survey. Instead of pretending every marker is exact, Seuranta communicates confidence and uncertainty.
Accomplishments that we’re proud of
- Built an interactive 3D command center for monitoring activity across a large building
- Displayed anonymous devices as selectable, live-updating black spheres
- Created full-building, floor, 2D, focus, and walkthrough views
- Built Devices, Events, and Reports pages around shared system state
- Created a simulation with 20 moving devices and four planned anchors
- Implemented anonymous tracker sessions and session recovery
- Designed a Raspberry Pi edge network with buffering and anchor-health reporting
- Separated immediate dashboard updates from historical Databricks analytics
- Made the project demonstrable without requiring the complete hardware installation
What we learned
We learned that spatial monitoring is not just about collecting signals. The information must be placed in context and presented in a way that helps an operator understand what is happening quickly.
We also learned that scalability involves more than adding sensors. Each deployment needs its own map, zones, anchor coordinates, calibration, testing, and operational rules.
Simulation became one of our most useful development tools because it follows the same general data structure as the live system. It allowed us to develop the building view, device panels, events, and reports before every physical component was available.
Most importantly, we learned that surveillance technology needs technical safeguards and responsible operating policies. Authorization, transparency, data minimization, access control, retention limits, and compliance review must be considered when deploying a system that processes location information.
What’s next for Seuranta
Our next step is to deploy the four Raspberry Pi anchors around Virginia Tech’s New Classroom Building, survey their exact locations, and calibrate the positioning model against real measurements.
We would then:
- Test accuracy across different rooms, floors, and signal conditions
- Compare live positions with known test locations
- Connect approved telemetry to the Databricks analytics pipeline
- Improve zone-level alerts and foot-traffic reporting
- Build measured room-and-door graphs for indoor routing
- Add configuration tools for deploying Seuranta in new environments
- Strengthen role-based access, auditing, and retention controls
After validating the first physical deployment, Seuranta could be adapted for malls, campuses, transportation facilities, event venues, warehouses, and other large monitored environments.
Our goal is to build a scalable spatial operations platform that helps authorized teams monitor activity, understand movement, recognize changing conditions, and respond with better information.
Built With
- css3
- databricks
- delta-lake
- fastapi
- github
- html5
- pydantic
- python
- raspberry-pi
- react
- rest-api
- sqlite
- three.js
- typescript
- uvicorn
- vite
- websockets
- wi-fi
- zustand


Log in or sign up for Devpost to join the conversation.