
311 Genie
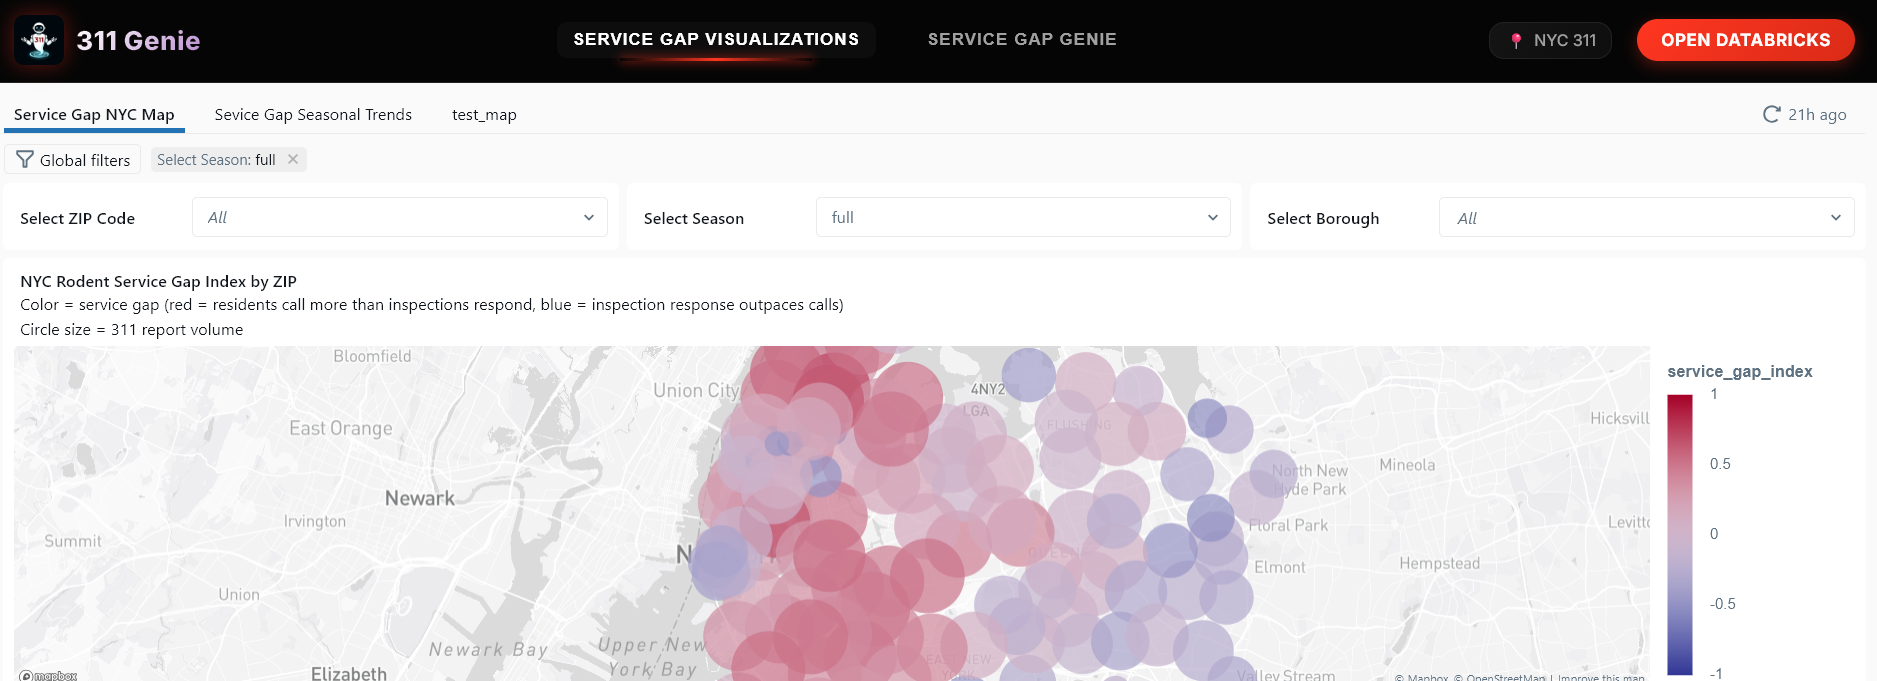
What our team found was the correlation between rodent complaints, city response, and rodent findings by zip code, which we did by creating our own metric called the "Service Gap Index". During our dataset analysis, we excluded the rows that had conditions attracting rodents; that data was in the Descriptor column. We also excluded all squirrel data. We wanted to confirm rodent presence in the actual dataset we used. Another big limitation in our discoveries was when searching the restaurant inspection data, where we found out that each restaurant that would have 1 or more violations would not be grouped. This made it harder to analyze the data, so we decided to group them by restaurant and violation. After these data operations, we were able to identify a set of load-bearing inputs, and generate an output (Service Gap Index) that cleanly visualized 311 service by ZIP code.
What the app features
- Per-ZIP score combining complaint volume, inspection follow-up rate, and recurrence — so you can see if reports in your ZIP turn into action or just pile up
- Borough-level rollups showing where response consistently lags demand
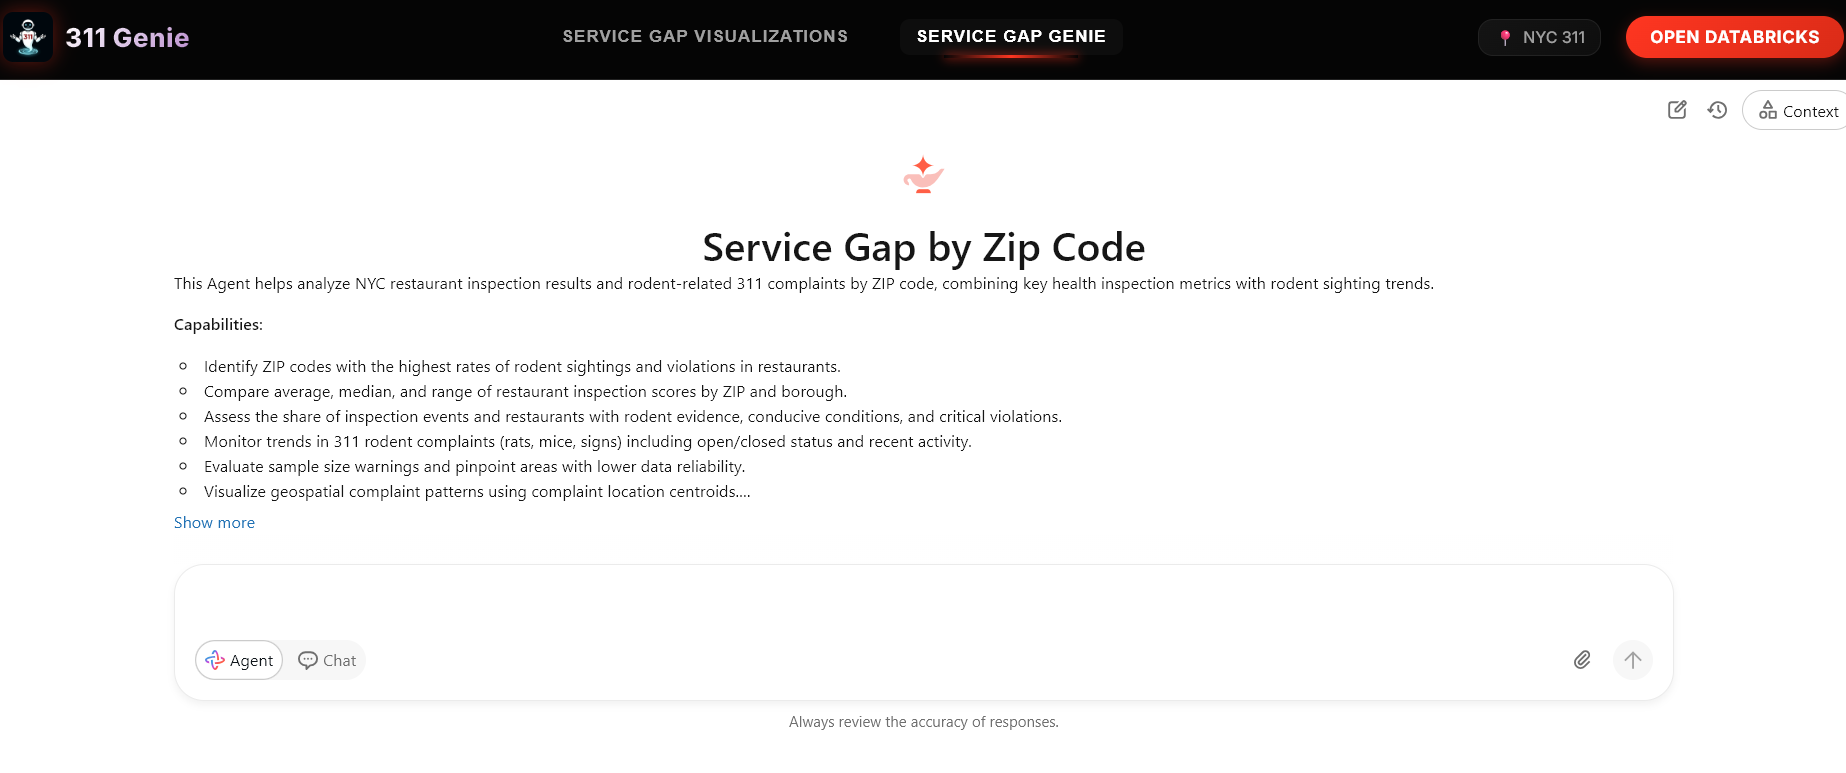
- Lookup dashboard — type in your ZIP, see your number and how it compares
Policy takeaway
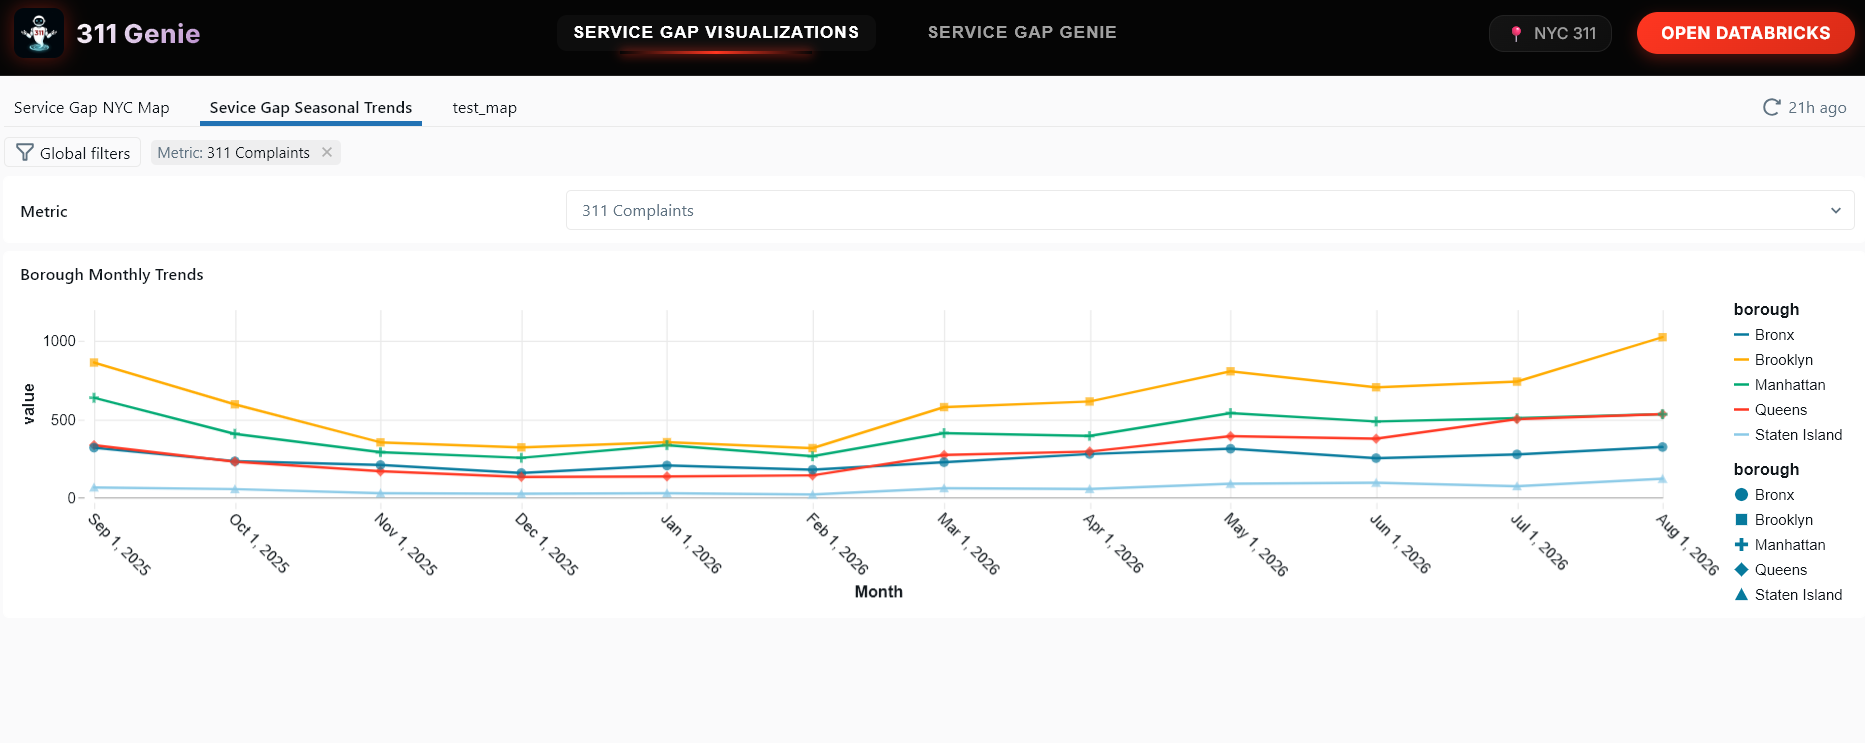
If we worked for the city, we would prioritize increased 311 service in the summer, because our data shows a visible 311 sighting fall-off in the winter.
Links
| Resource | Link |
|---|---|
| SQL Query Documentation | Google Doc |
| SQL Presentation | Artifact |
Built With
- databricks
- databricks-genie
- databricks-visualizer
- sql

Log in or sign up for Devpost to join the conversation.