Inspiration
Every tennis broadcast shows serve-direction splits: "she wins 71% of points going T on the deuce court." Coaches build game plans on numbers like these. But a split from a handful of matches is mostly luck, and nobody tells you how much.
Game theory says something sharper. Serving is a guessing game, so if one target paid better, returners would cheat toward it until it stopped paying. At the pro level every target should pay about the same (minimax play; Walker & Wooders tested this on 10 Wimbledon finals in 2001). We wanted to know which serve patterns are actually real, and to give coaches a tool that separates signal from noise.
What it does
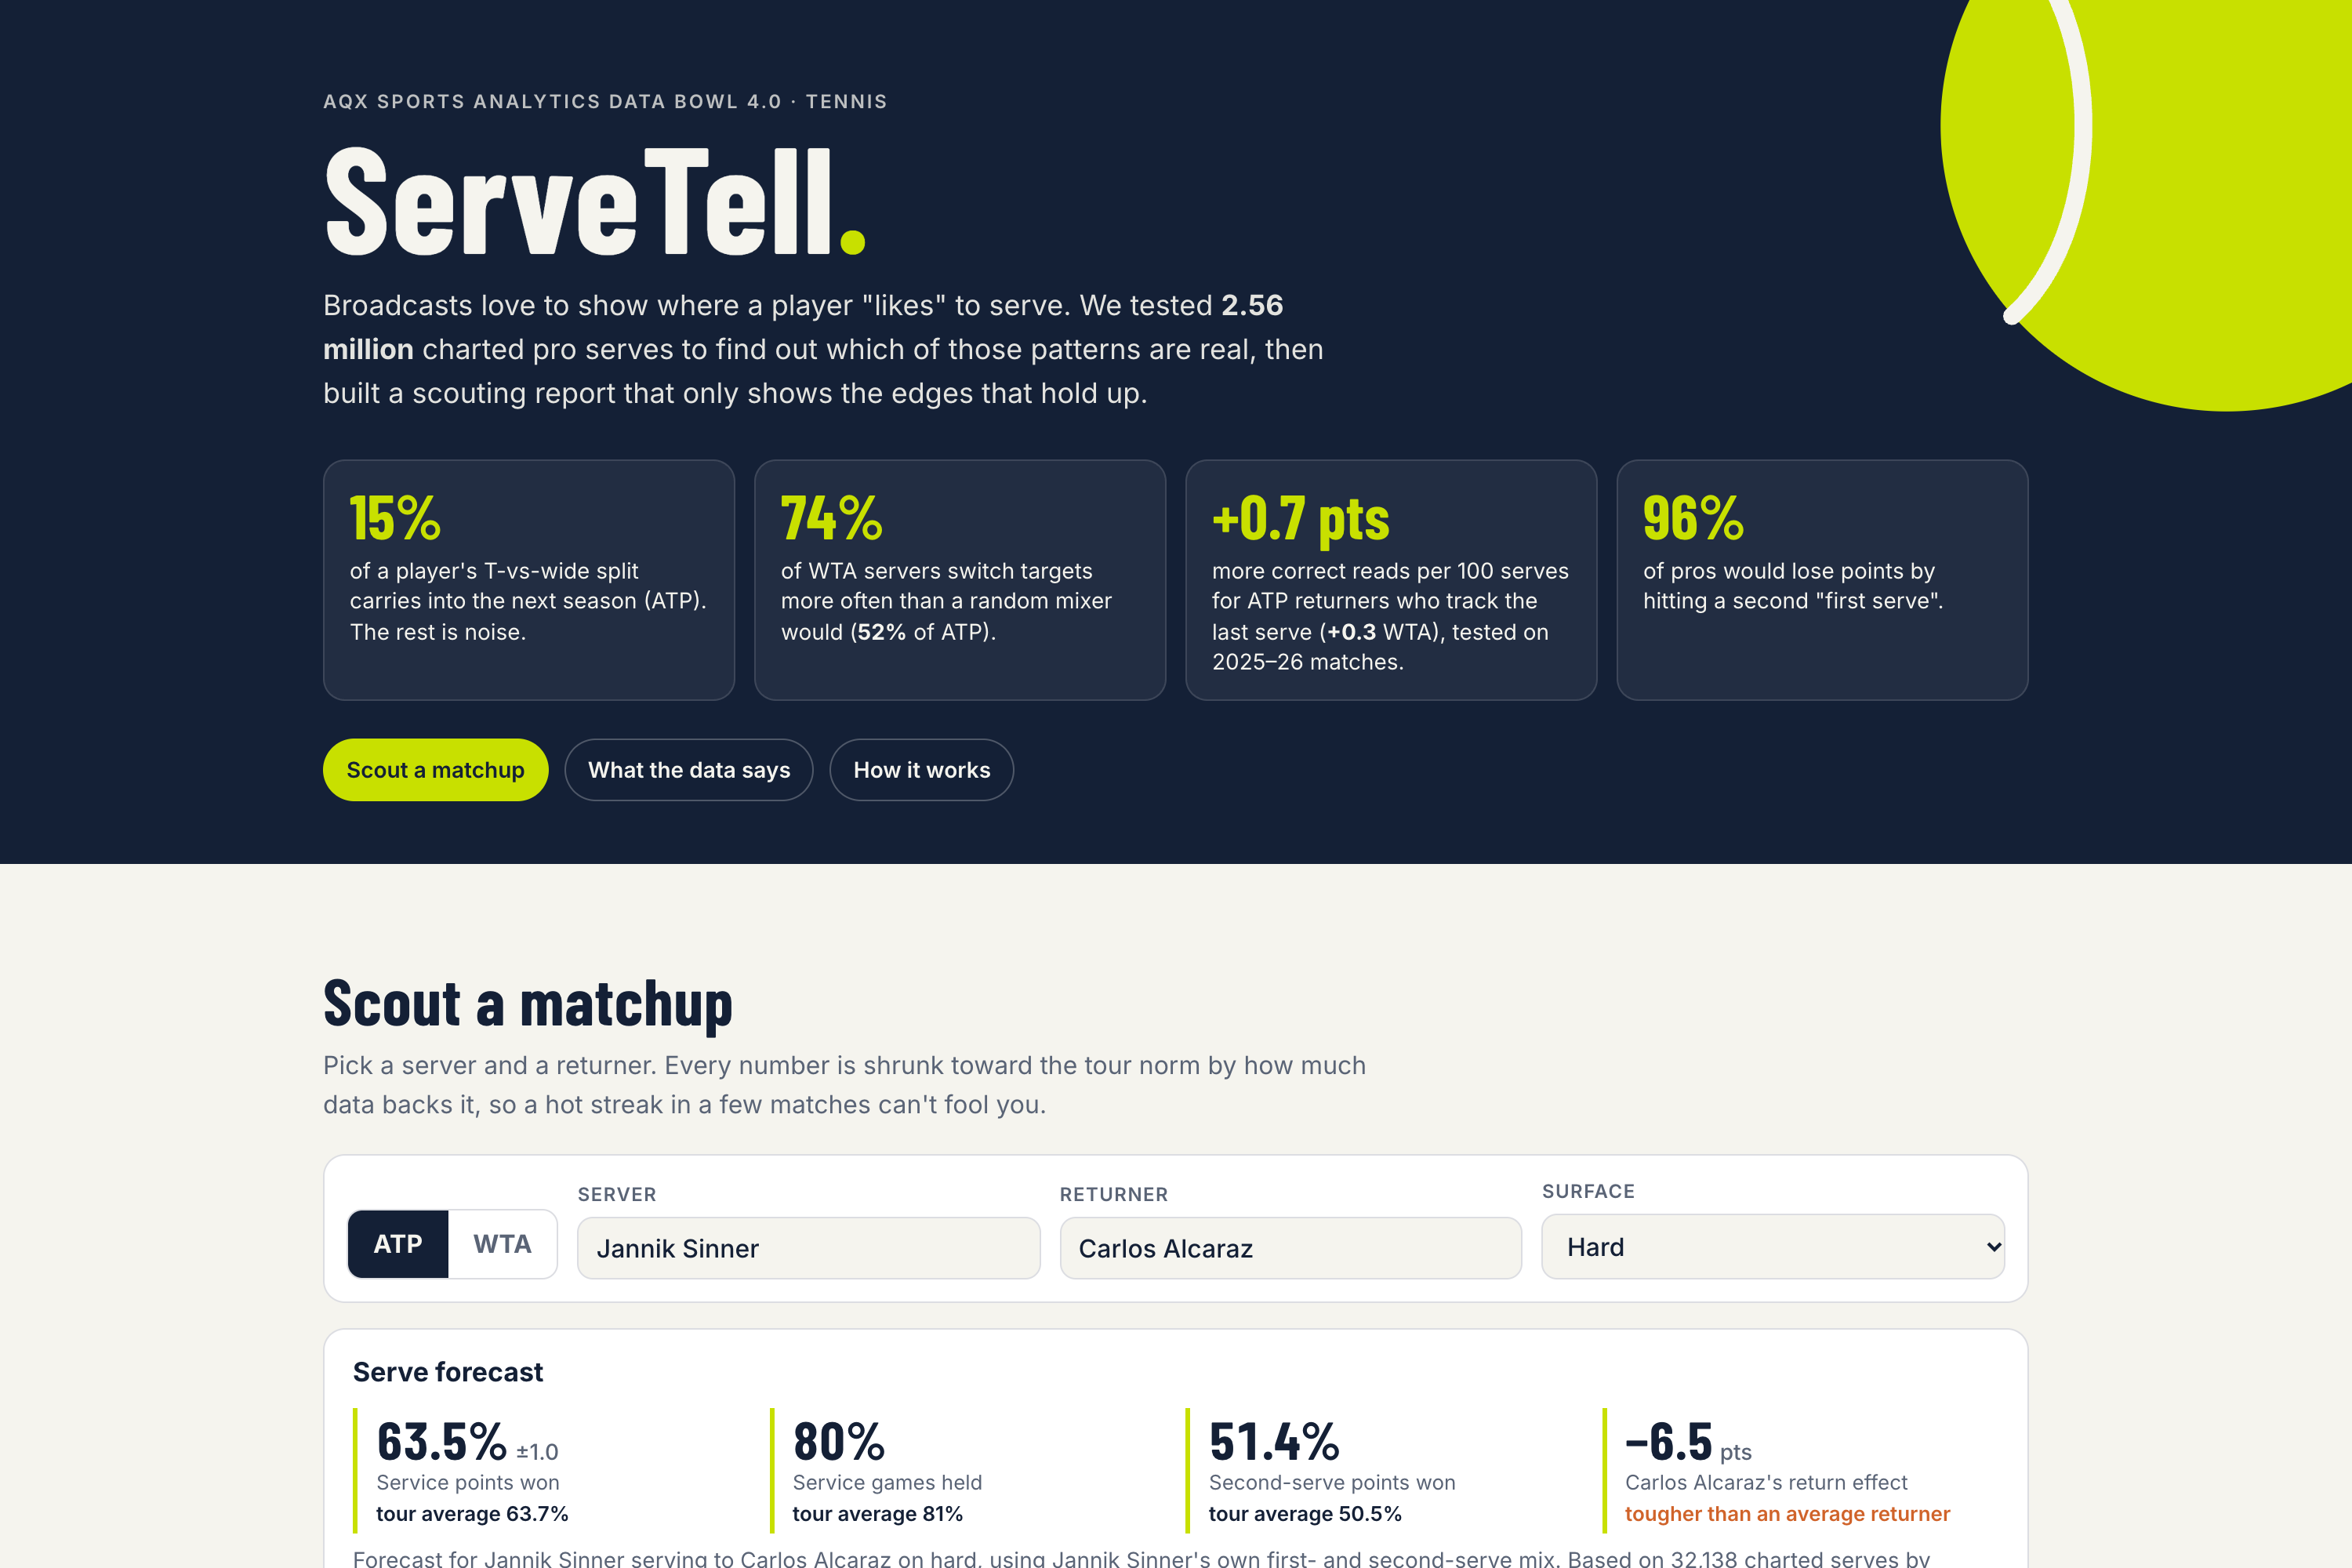
ServeTell has two parts: five findings from 11,785 shot-by-shot charted pro matches (2.56 million serves), and an interactive matchup scouting report.
The findings
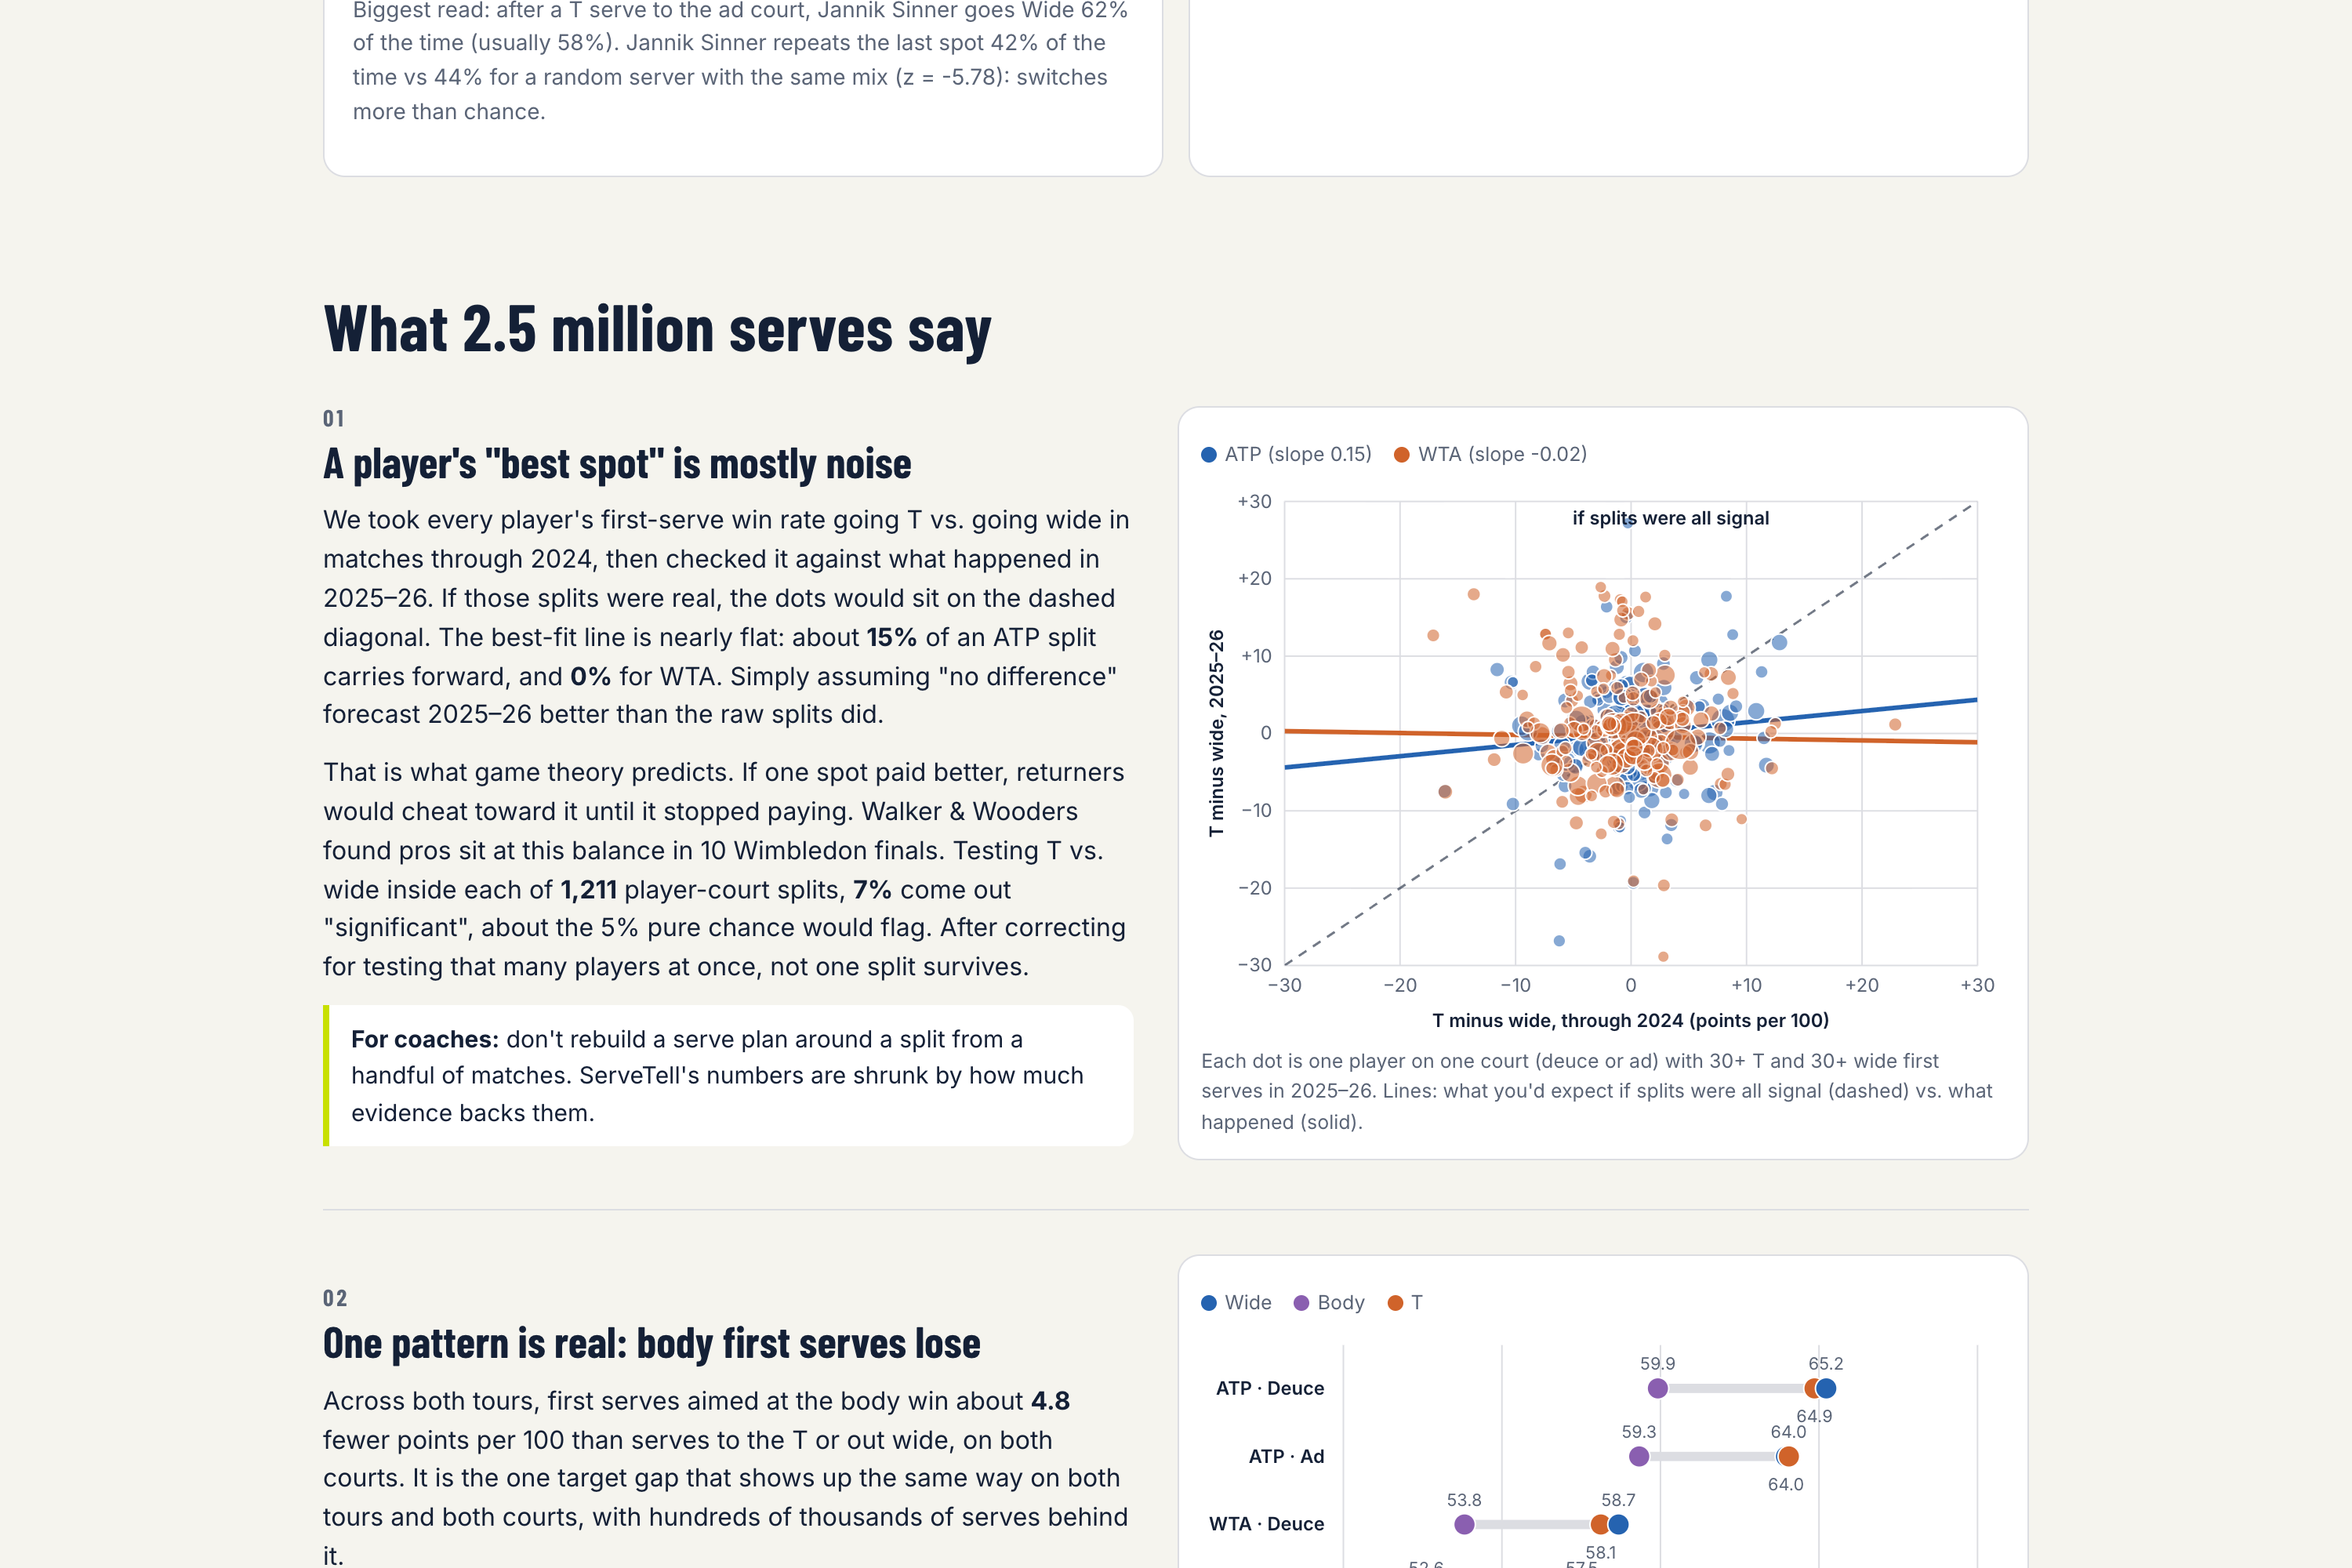
- A player's "best spot" is mostly noise. We learned every player's T-vs-wide split from matches through 2024 and checked it against 2025–26. Only ~15% of an ATP split carries forward, and ~0% for WTA. Simply assuming "no difference" forecast the future better than the raw splits did. Within players, T-vs-wide tests come out "significant" in 7.4% (ATP) and 5.7% (WTA) of 1,211 splits, which is about what chance alone produces. None survive Benjamini–Hochberg correction. Pros really do sit at the minimax balance.
- Body first serves really do lose: about 4.8 fewer points per 100 than T or wide, on both tours and both courts.
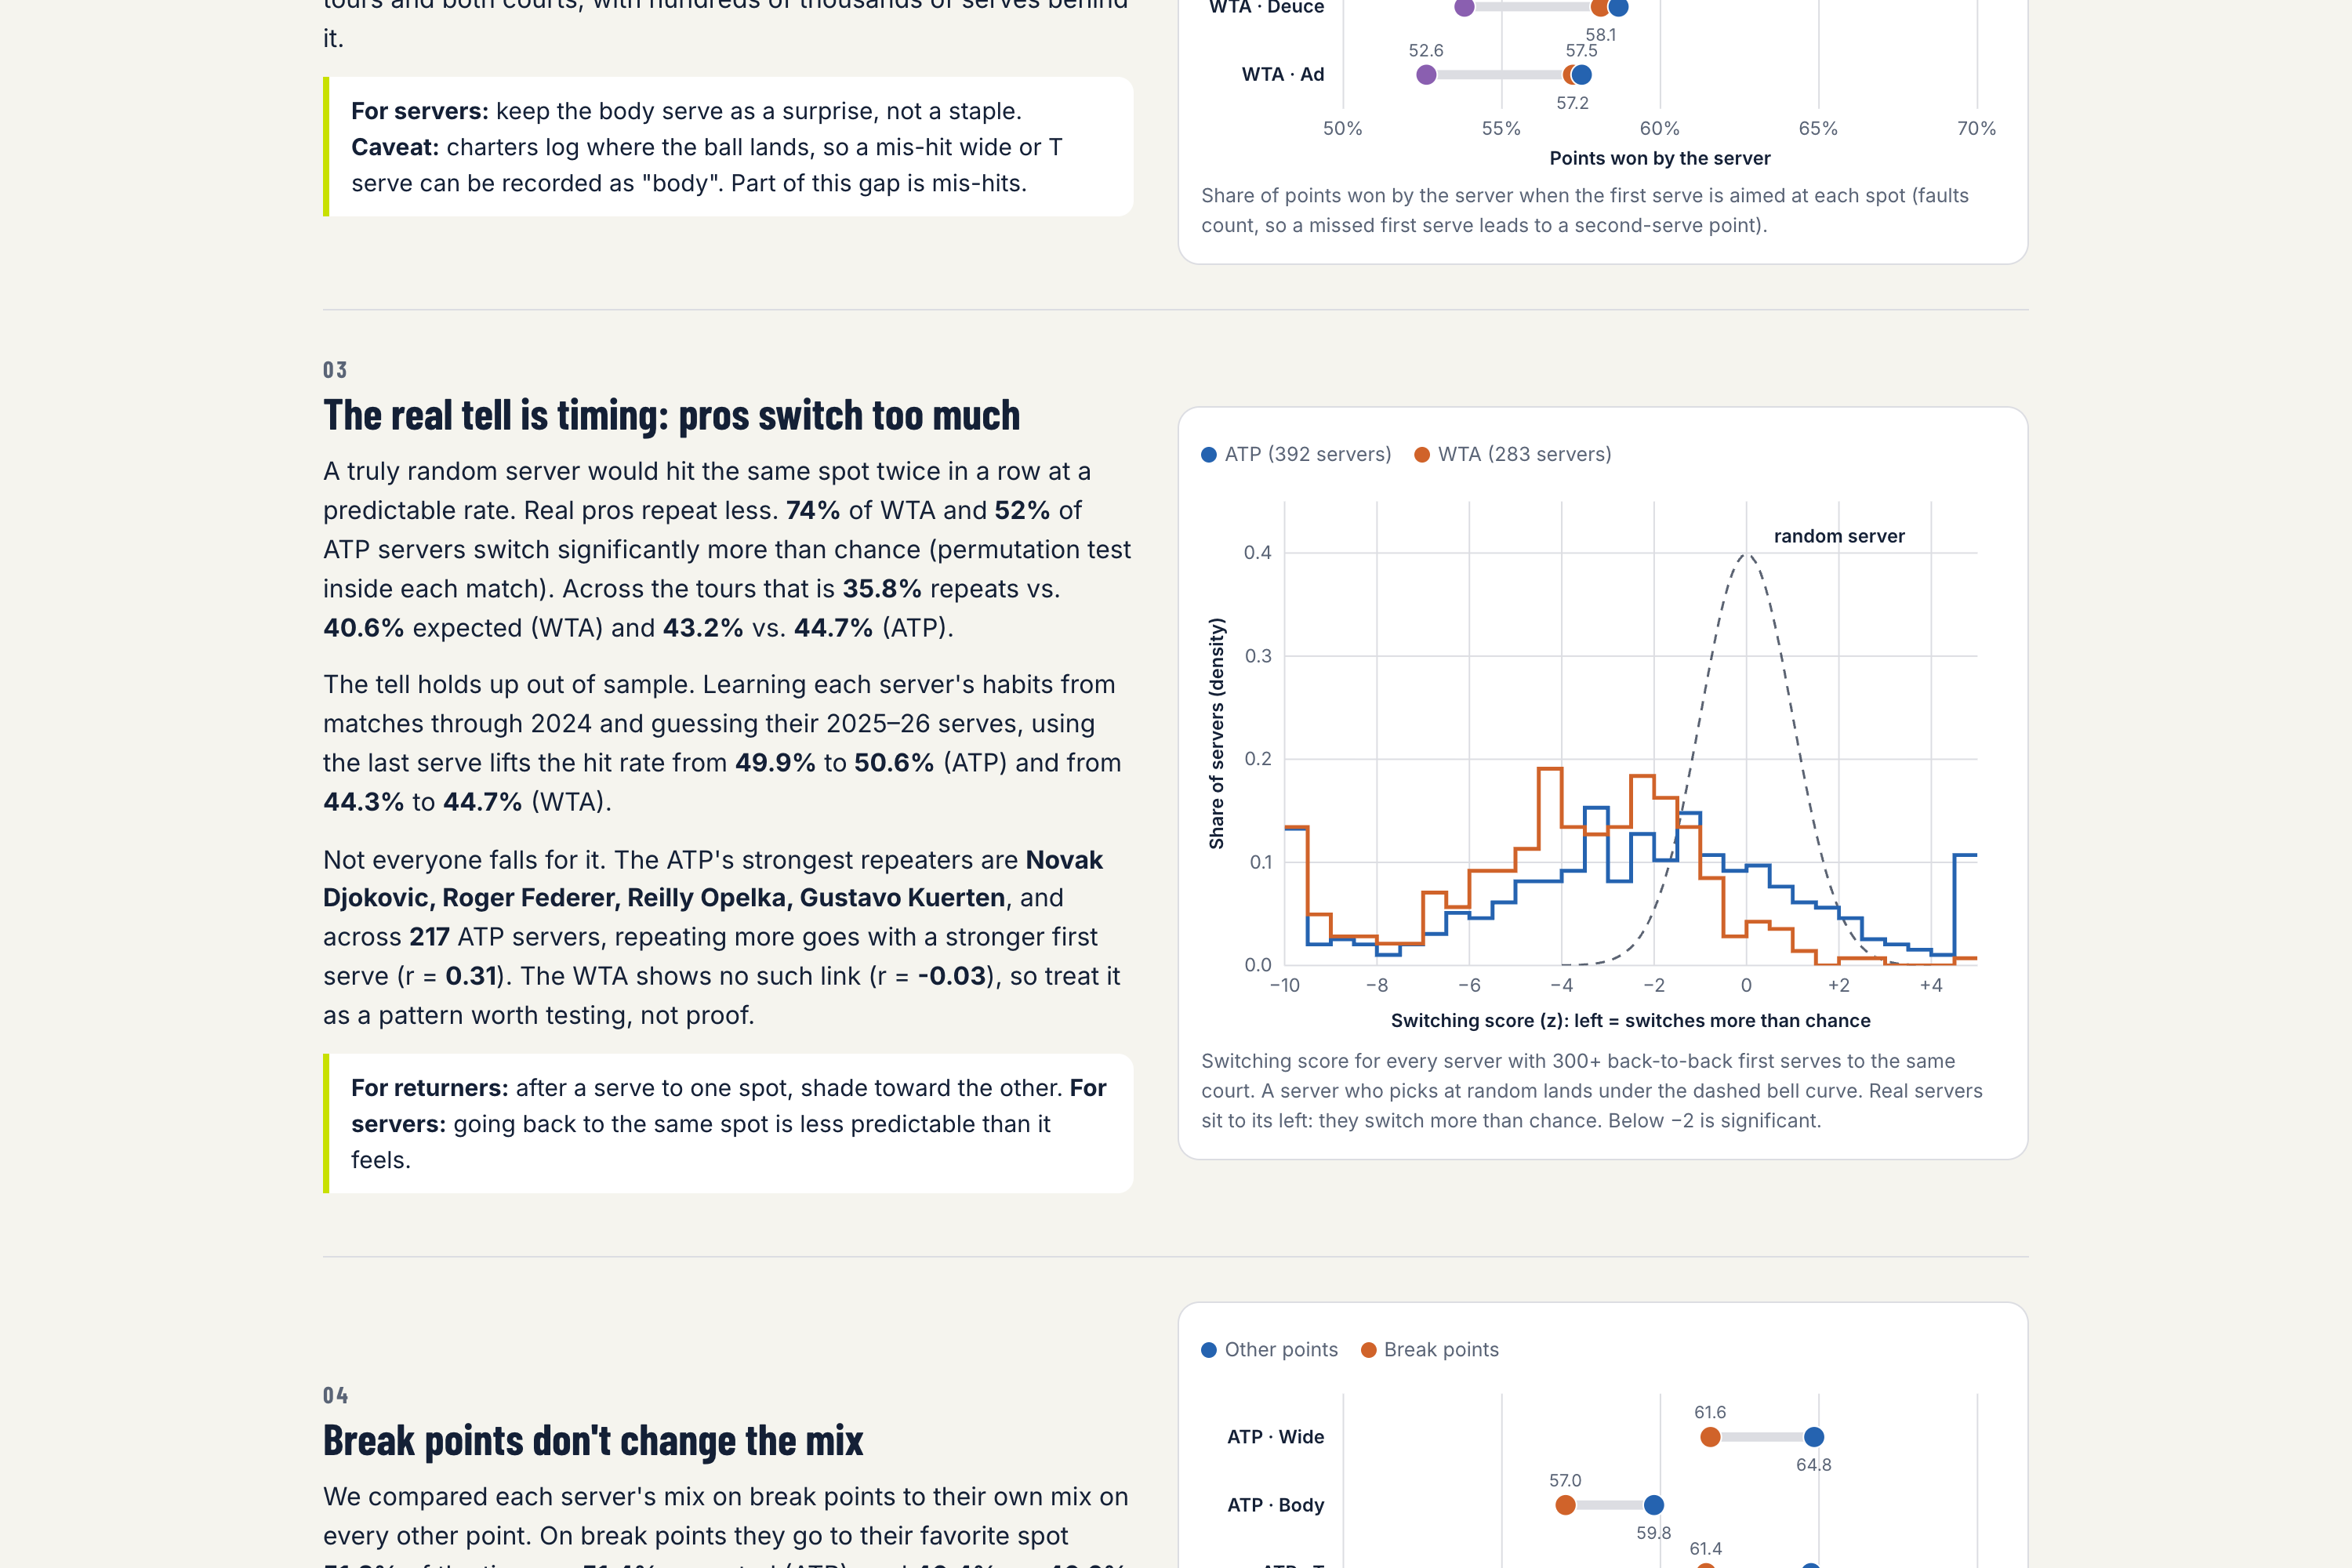
- The real tell is timing. 74% of WTA and 52% of ATP servers switch targets significantly more often than a random server would (within-match permutation test). Out of sample, tracking the last serve improves a returner's guess. Interestingly, the ATP's biggest repeaters are Djokovic, Federer, Opelka and Kuerten.
- Break points don't change the mix. Servers go to their favorite spot 51.2% of the time vs. 51.4% expected. There's no tour-wide pressure tell, but servers win ~3 fewer points per 100 on break points, whichever way they aim.
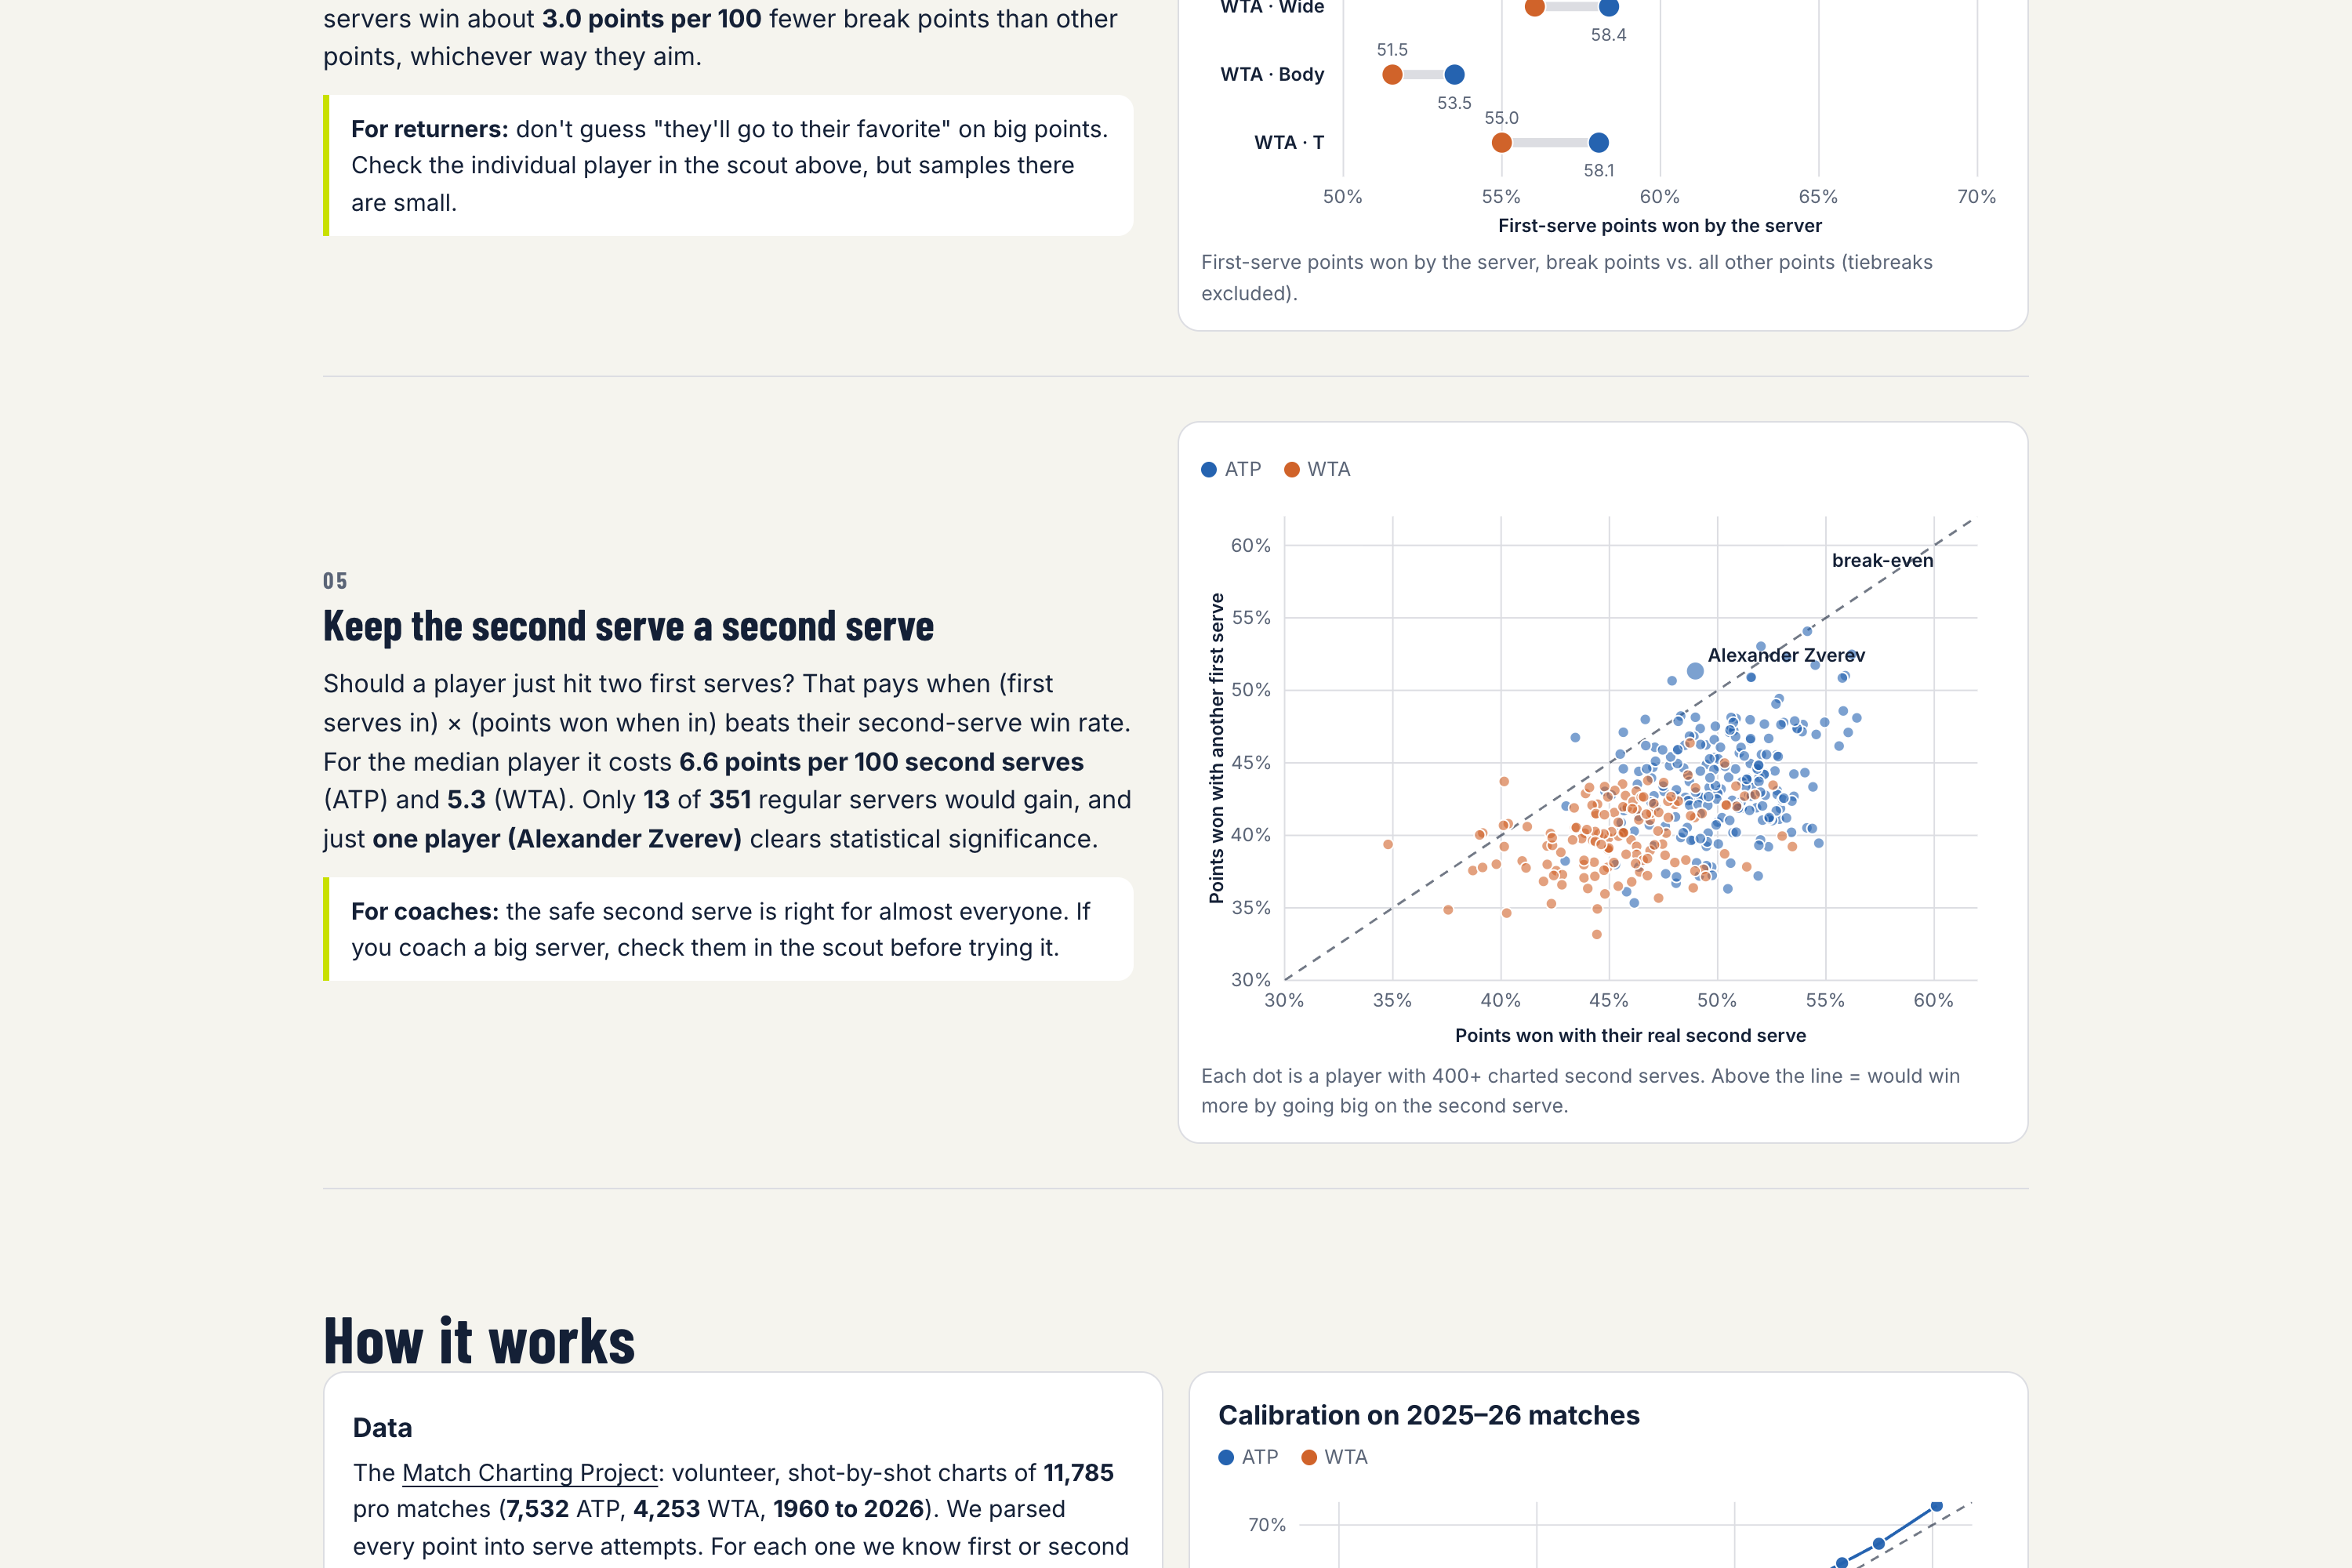
- Keep the second serve a second serve. Going big pays only when \( p_{\text{1st in}} \times w_{\text{won when in}} > w_{\text{2nd serve}} \). That holds for just 13 of 351 regular servers, and only Alexander Zverev clears statistical significance.
The scouting report
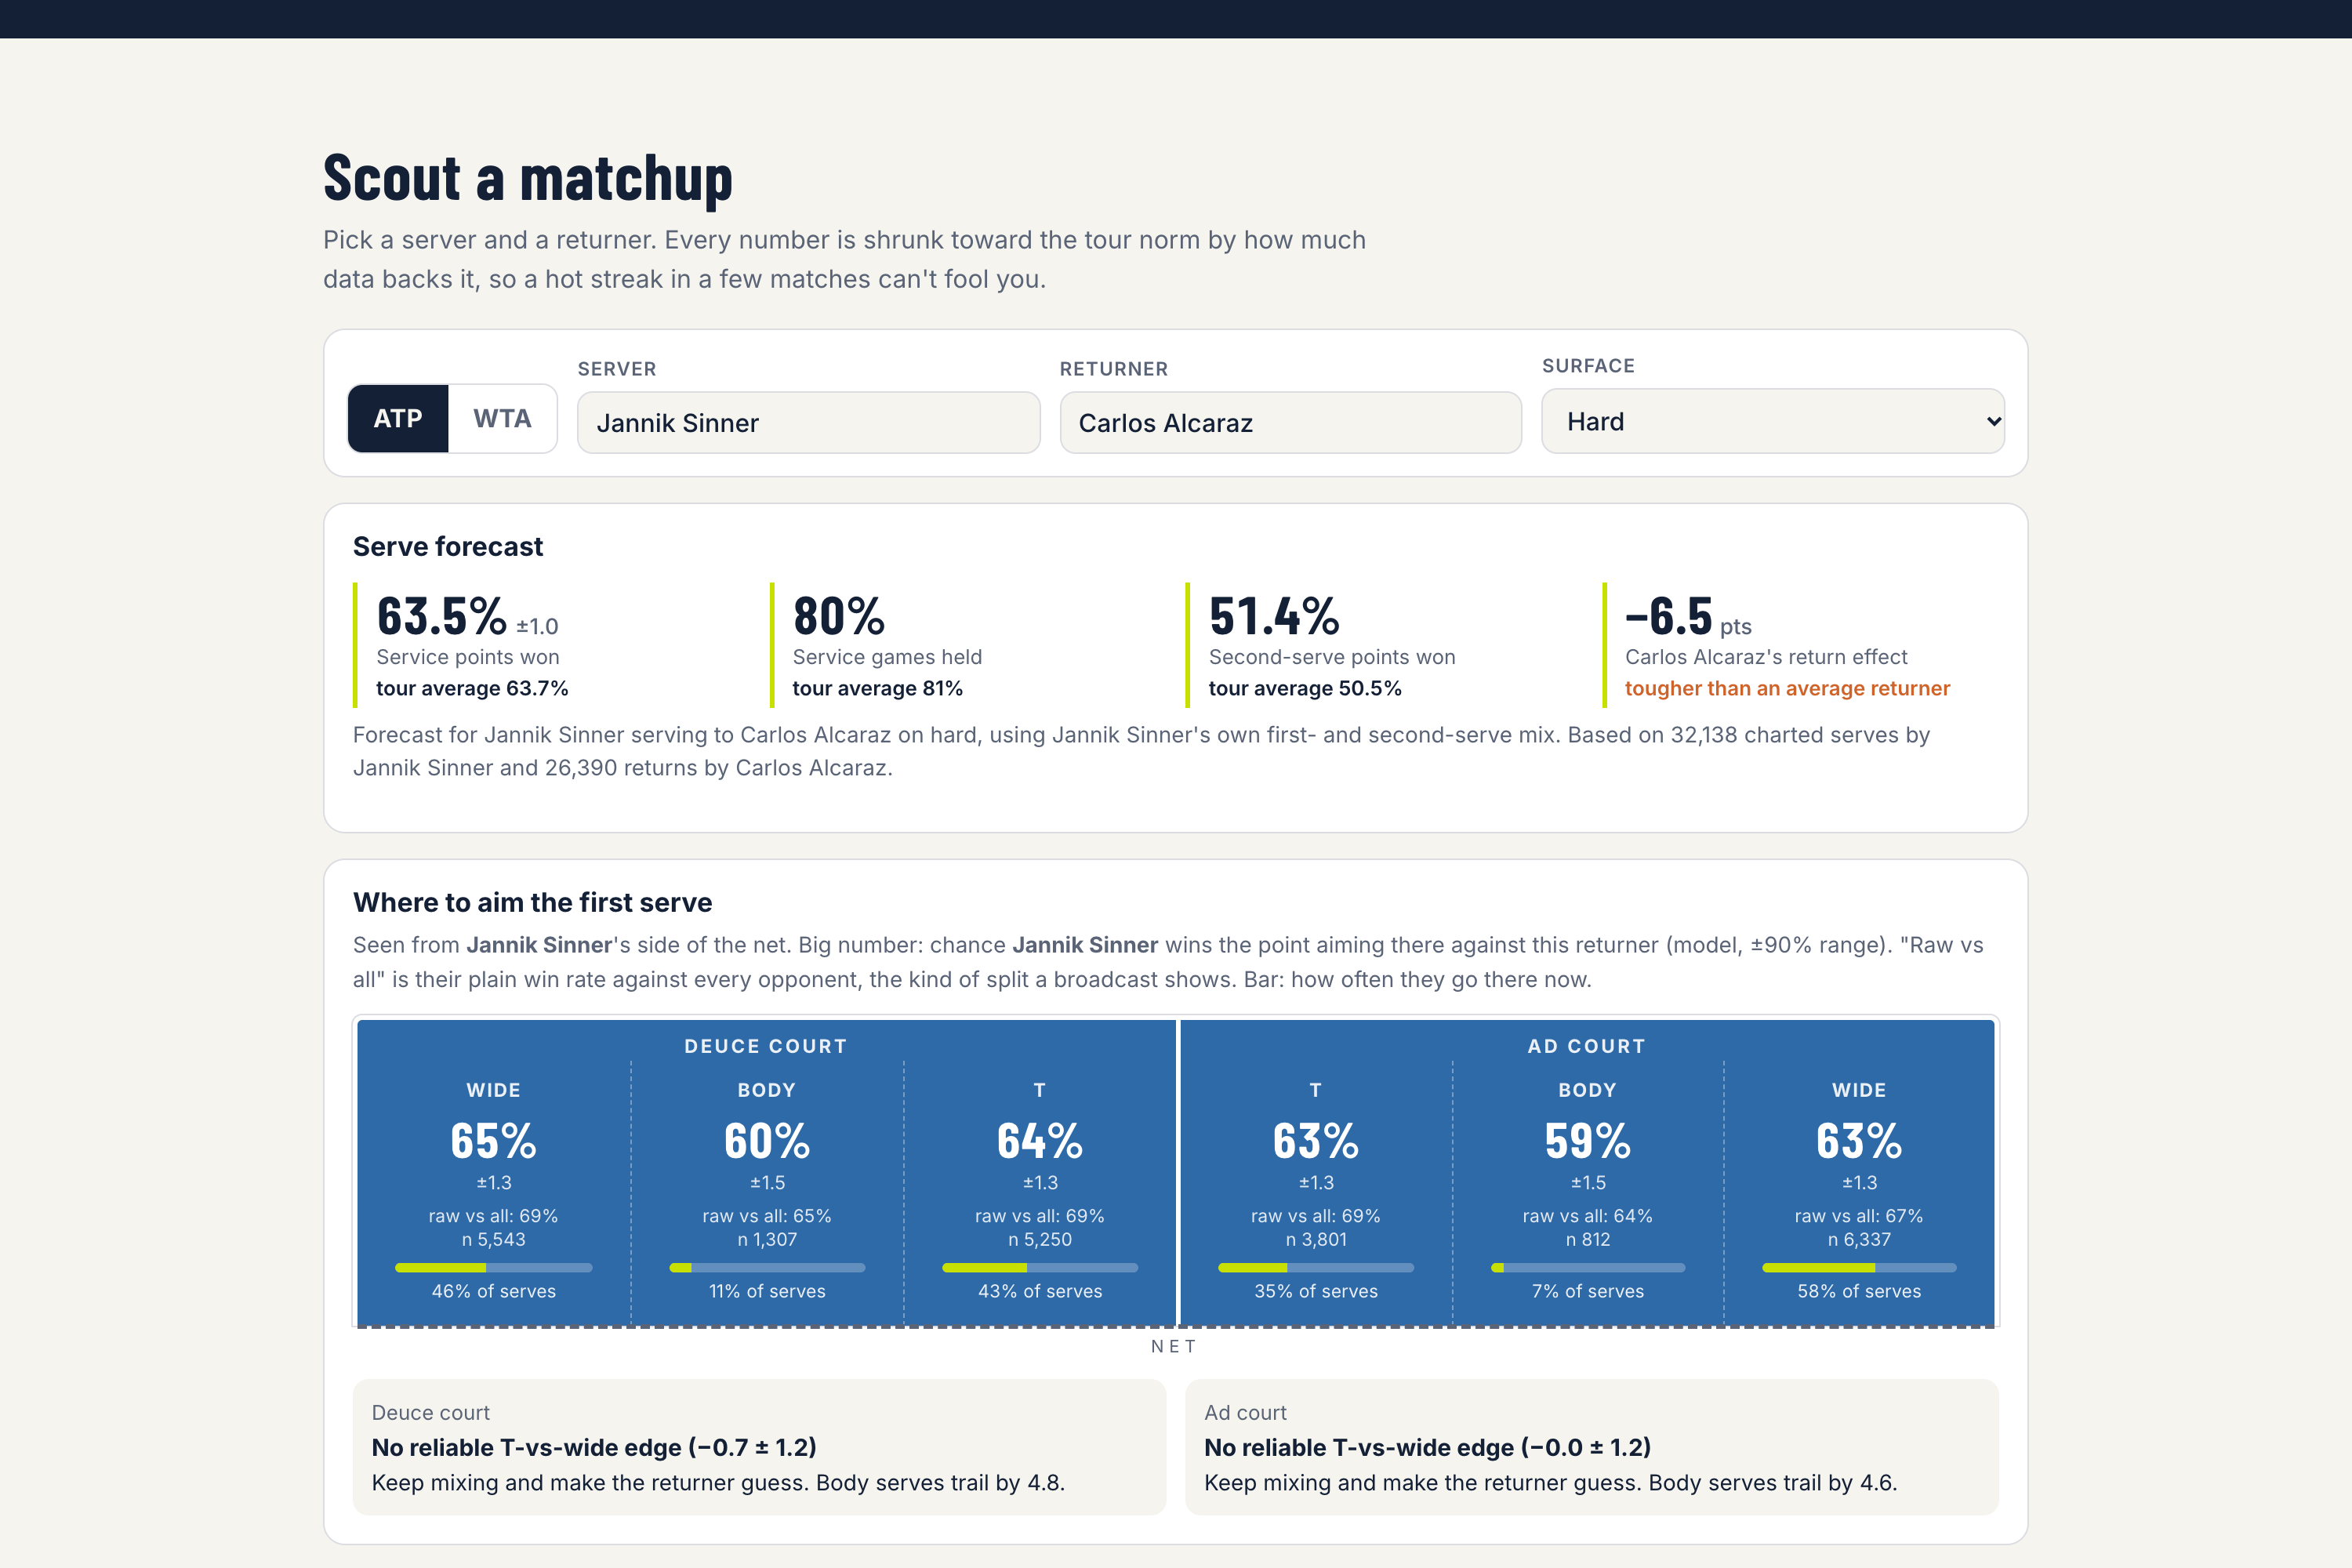
Pick a tour, a server, a returner and a surface:
- Serve forecast: service points won, hold %, second-serve points won, and how many points this returner costs the server compared with an average returner.
- Where to aim: a court diagram from the server's side of the net. It shows the model's win chance for each target (with a 90% range) next to the raw split a broadcast would show. A verdict says either "Lean T, worth X points a match" or "No reliable edge, keep mixing", and flags when the raw split is mostly noise.
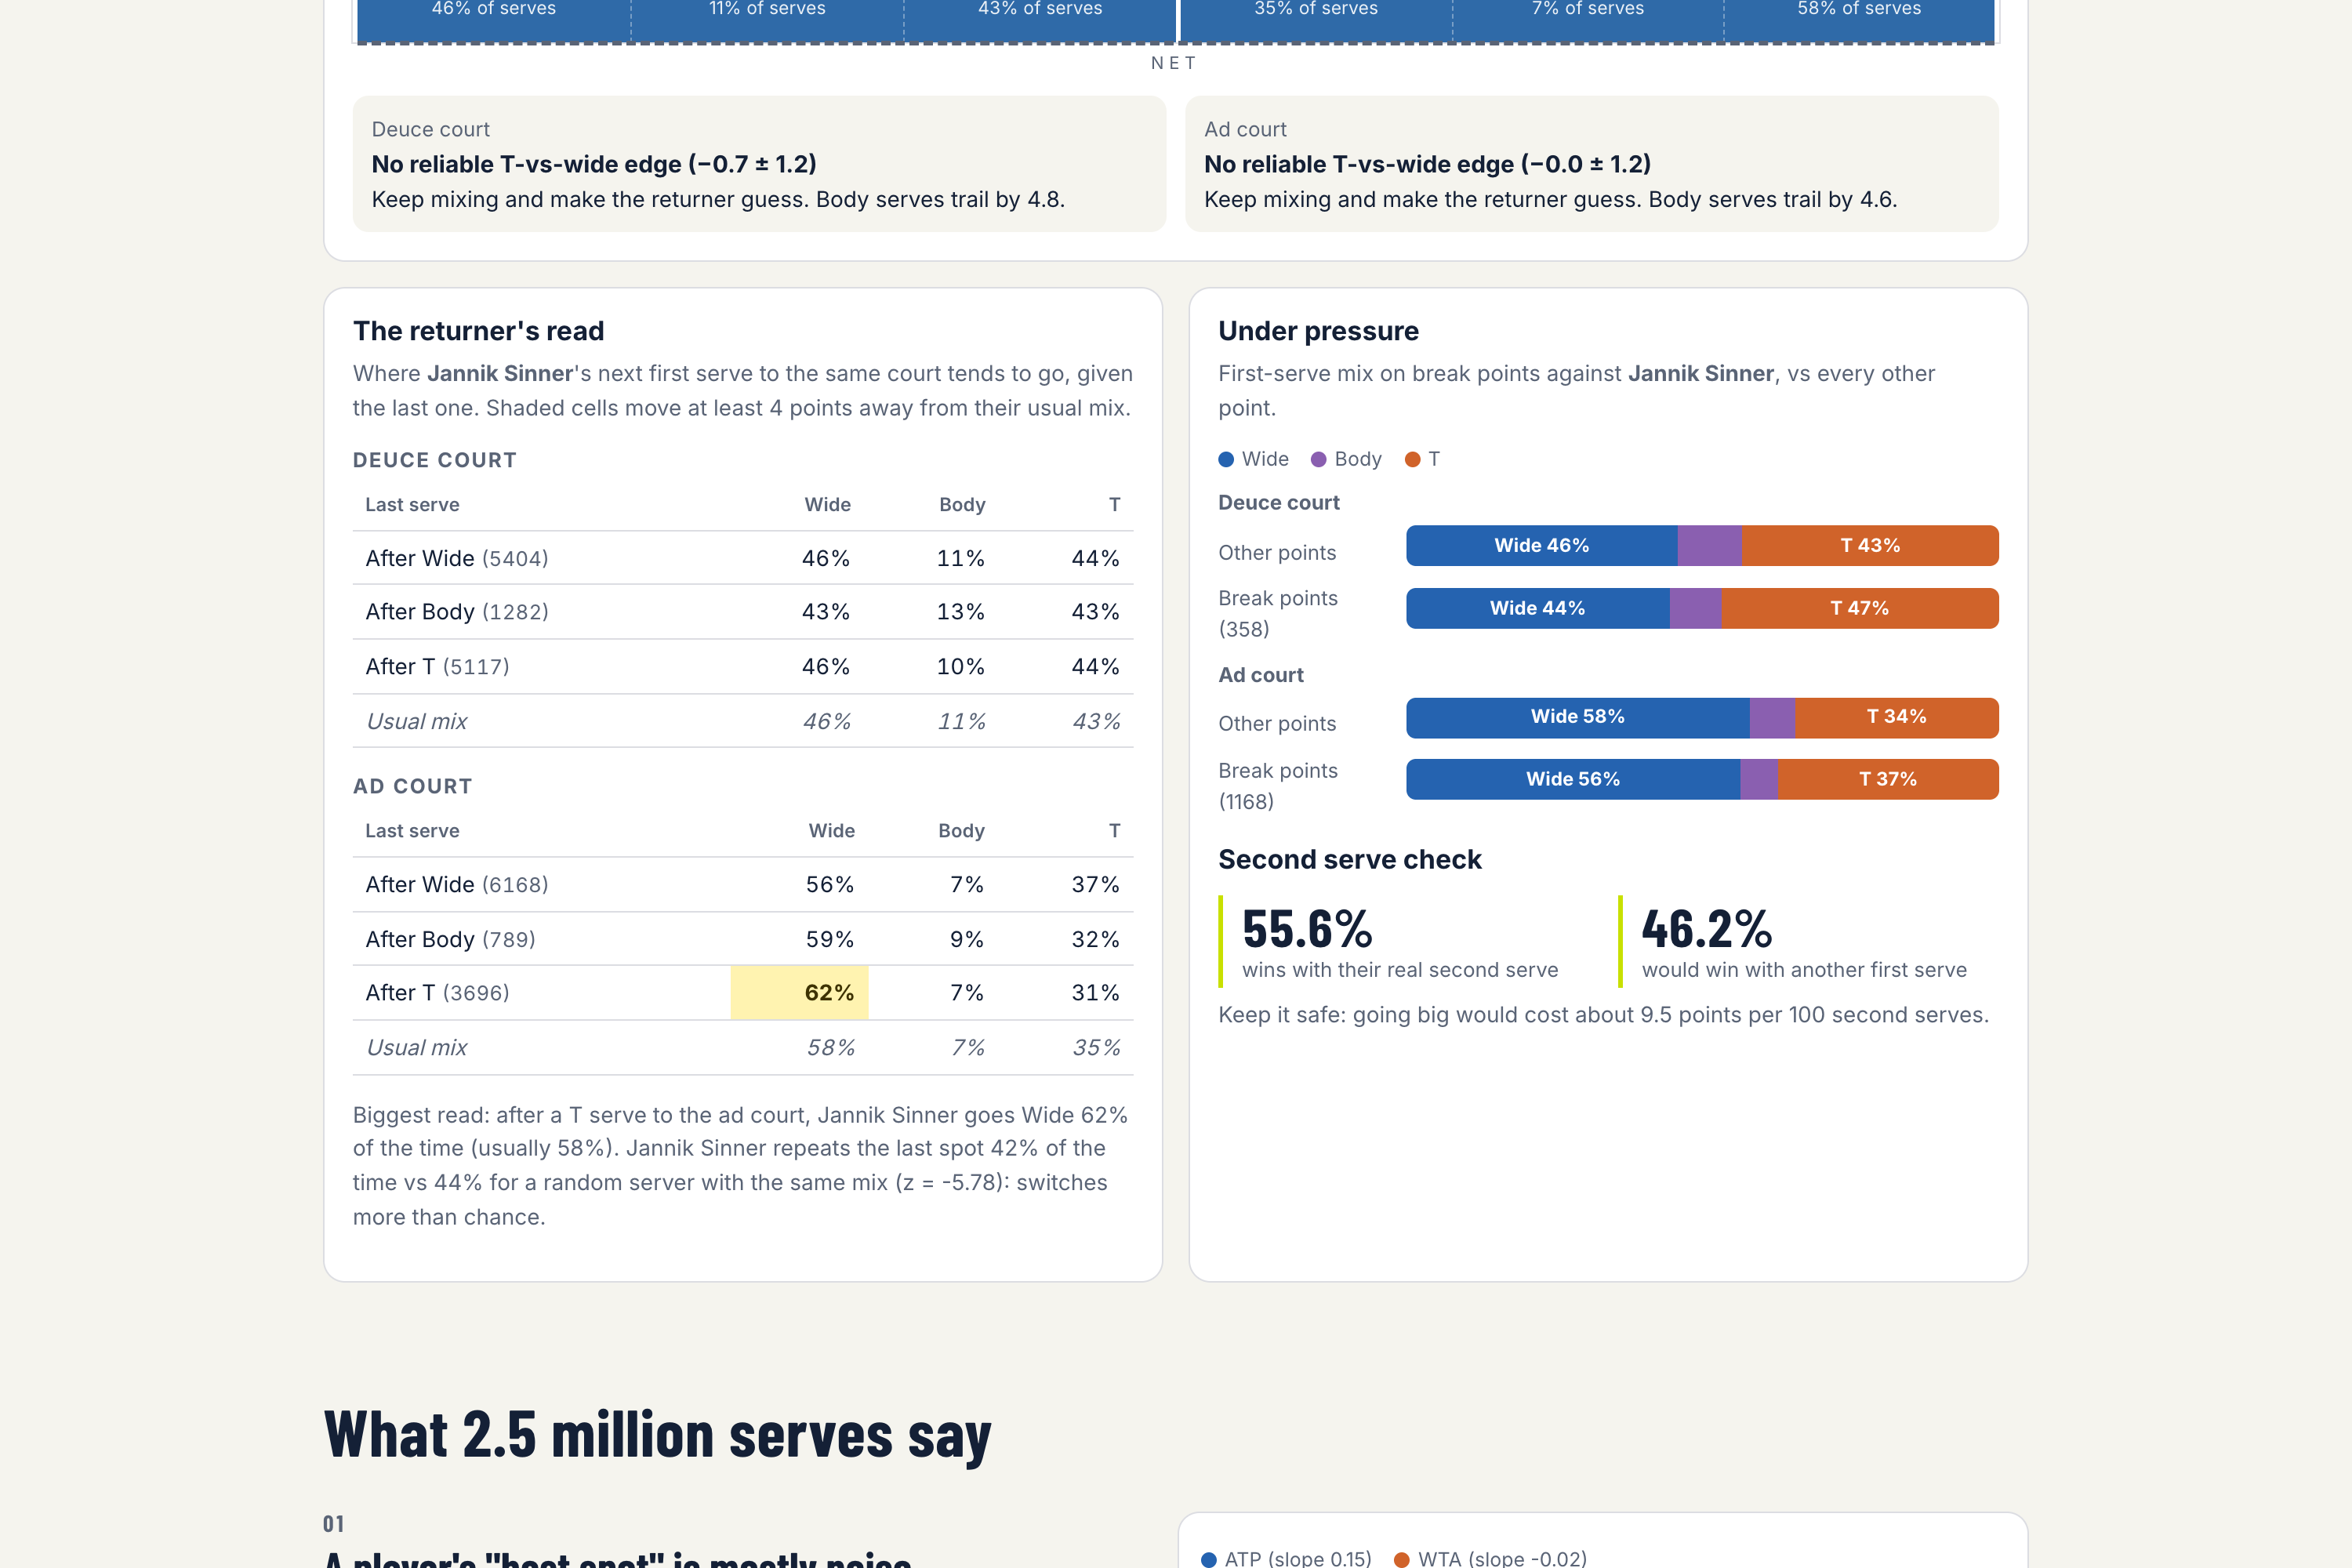
- The returner's read: where this server's next serve to the same court goes after each previous target, plus their personal switching score.
- Under pressure: break-point mix vs. every other point.
- Second serve check: their real second serve vs. hitting another first serve.
Every report has a shareable URL.
Actionable impact
- Coaches: stop rebuilding serve plans around small-sample splits. ServeTell shows which edges survive and how many points per match they're worth. After shrinkage, only 11 of 896 player-court combinations show a reliable T-vs-wide edge, each about 1 point per 100.
- Returners: after a serve to one spot, shade toward the other. Most pros switch more than chance, and the pattern holds on unseen matches.
- Servers: cut first serves to the body. Repeating a target is less predictable than it feels. Keep the safe second serve unless the check says otherwise.
How we built it
Data. The Tennis Abstract Match Charting Project: volunteer shot-by-shot charts of 7,532 ATP and 4,253 WTA matches (1.88M points). We parsed every point into serve attempts. Each attempt has its target (wide/body/T from the serve code), fault status, court (deuce/ad, worked out from the score), break-point flag, surface, server, returner and outcome.
Statistics (Python, pandas, SciPy).
- Minimax chi-square screen with Benjamini–Hochberg control and a KS test on the p-value distribution.
- Within-match permutation test (200 shuffles) for serial dependence.
- Within-player break-point comparison.
- Out-of-sample anticipation test.
Matchup model. A penalized logistic regression, the MAP estimate of a random-effects model:
$$ \operatorname{logit} P(\text{server wins}) = \alpha_{\text{serve, court, target, surface}} + \underbrace{u_s + u_{s,\text{serve}} + v_{s,\text{serve, court, target}}}{\text{server}} + \underbrace{u_r + u{r,\text{serve}} + v_{r,\text{serve, court, target}}}_{\text{returner}} $$
Each level gets its own Gaussian penalty \( \lambda \). We tuned the penalties on 2024 matches (trained through 2023) over a 12-point grid. The target-specific terms \( v \) wanted the heaviest penalty (\( \lambda = 3000 \)), which is finding 1 seen from the model's side. The 90% ranges come from the diagonal of the Laplace (inverse-Hessian) covariance.
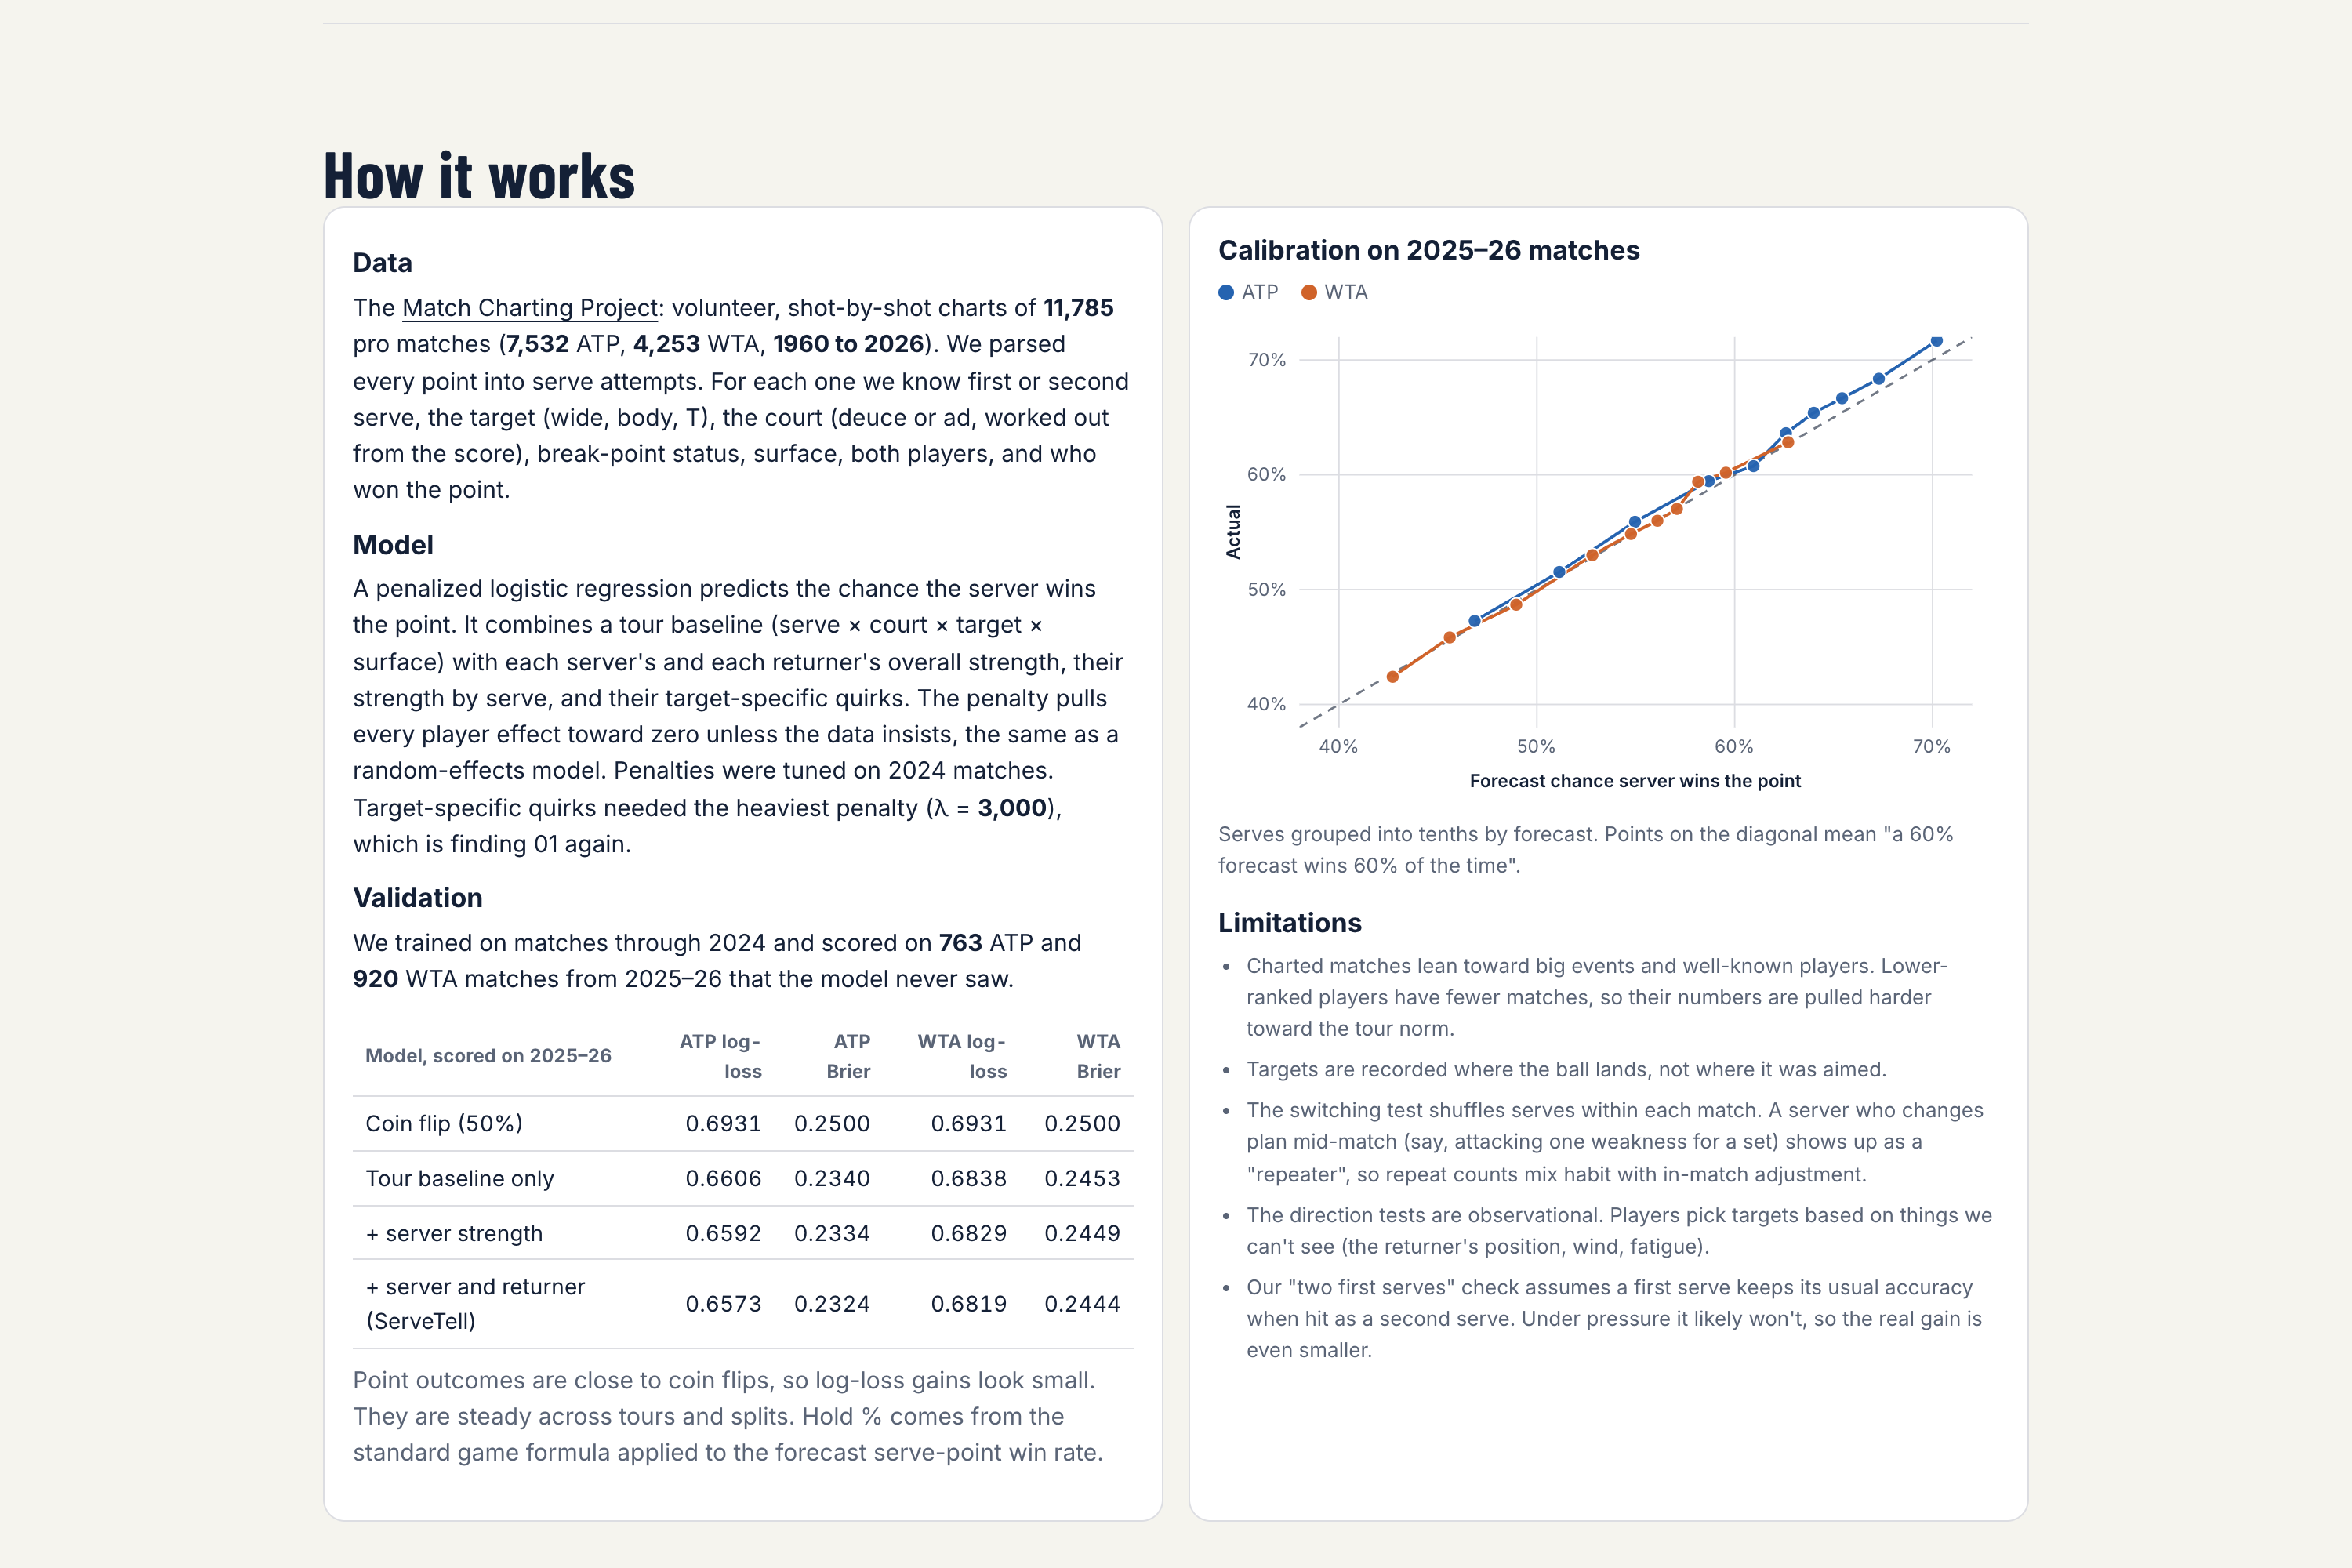
Validation. Trained through 2024 and scored on 1,683 matches from 2025–26 (335k serves) the model never saw:
| Model | ATP log-loss | WTA log-loss |
|---|---|---|
| Coin flip | 0.6931 | 0.6931 |
| Tour baseline | 0.6606 | 0.6838 |
| + server strength | 0.6592 | 0.6829 |
| + server & returner (ServeTell) | 0.6573 | 0.6819 |
Forecasts are well calibrated across the full range.
Front end. A static site in plain HTML, CSS and JavaScript with hand-drawn SVG charts, hosted on GitHub Pages. The model runs in the browser from ~430 KB of JSON. Every number in the text is computed from the data at page load, so the copy can't drift from the analysis.
Challenges we ran into
Our first idea was a tool that tells servers where to aim. The out-of-sample check killed it: raw directional splits had almost no predictive power. Instead of hiding that, we made it the headline and rebuilt the tool around separating signal from noise.
The second challenge was choosing the null for the switching test. Comparing against a player's career mix would wrongly flag mix changes between matches, so we shuffled within each match and court.
Accomplishments that we're proud of
- Reproducing a classic economics result (Walker & Wooders' minimax test) on 1.3M first serves.
- A model that is honest about uncertainty and calibrated on unseen matches.
- Reporting small effects and limitations plainly instead of overselling.
What we learned
At the pro level the serve game is close to equilibrium. The edges that remain are small, and they live in timing and habits, not in where. Shrinkage and out-of-sample checks matter most exactly where the data looks most exciting.
What's next
- Add return position and serve speed from tracking data, to explain why targets balance out.
- A live mode that updates a server's read point by point during a match.
- Score-state effects: does the mix change at 30–30 or in tiebreaks?
Limitations
- Charted matches skew toward big events and well-known players.
- Targets are recorded where the ball lands, not where it was aimed.
- The direction tests are observational.
- The switching test counts in-match plan changes as repeats.
- The two-first-serves check assumes first-serve accuracy holds under second-serve pressure.
Data and credits
Data: Tennis Abstract Match Charting Project by Jeff Sackmann and contributors, licensed CC BY-NC-SA 4.0. Derived data is shared under the same license. Method reference: Walker, M. & Wooders, J. (2001), Minimax Play at Wimbledon, American Economic Review. Built with help from Claude Code (AI coding assistant).

Log in or sign up for Devpost to join the conversation.