
Inspiration
Pretty graphs, social media
What it does
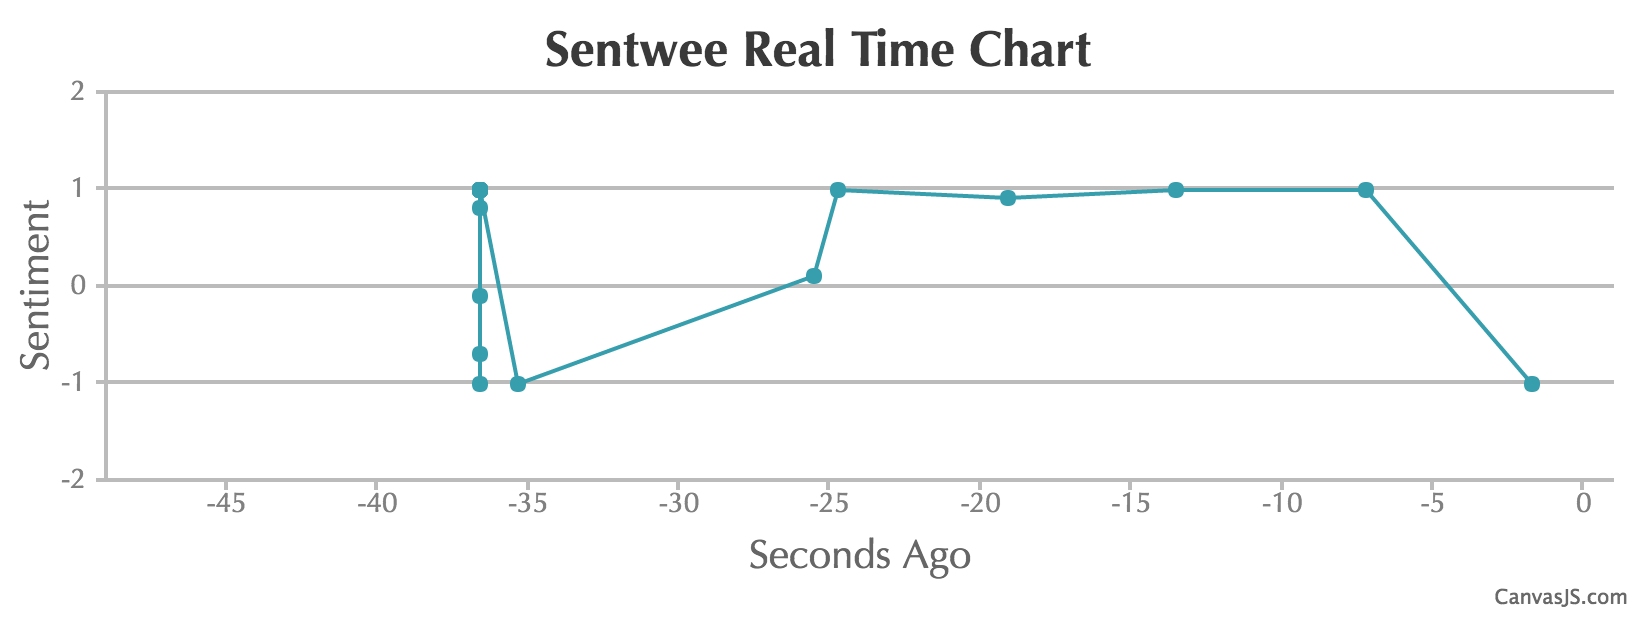
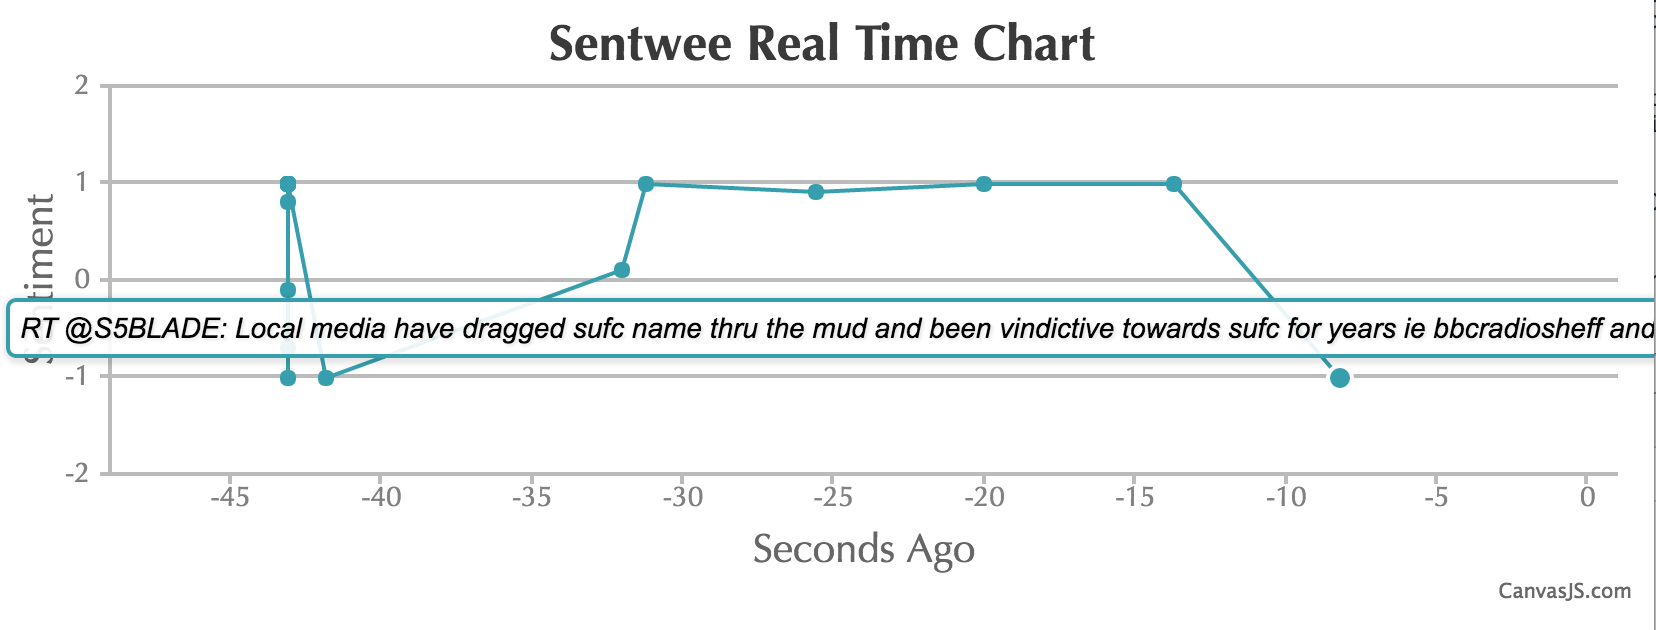
Takes a realtime feed of a certain searchterm from twitter, puts it through the google cloud api to find the sentiment (happiness) and then displays it in a web app
How we built it
In Python, Tweepy collects the tweets, which are passed to Google Cloud to find the sentiment. These are sent over a socket to the Flask webserver, which sends them over a continuous event stream to the front end, where CanvasJS plots them. As such, everything is entirely real time
Challenges we ran into
- Forgetting/not knowing python
- Getting the twitter and server process to talk to each other - streams going all over the place
- API rate limits
Accomplishments that we're proud of
- IT WORKS
- Everything being in real time
What we learned
- Python
- JSON
- Using APIs
- Realtime streams
- Who Panda is
What's next for Sentwee
- Better UI
- Selectable search term on website
Built With
- canvas-js
- flask
- google-cloud
- python
- tweepy


Log in or sign up for Devpost to join the conversation.