-
-
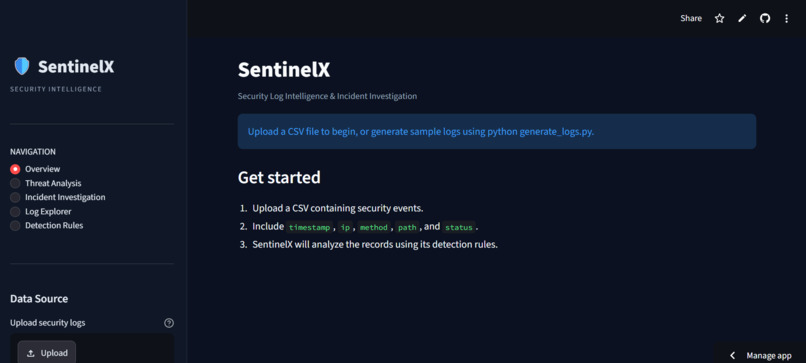
SentinelX dashboard
-
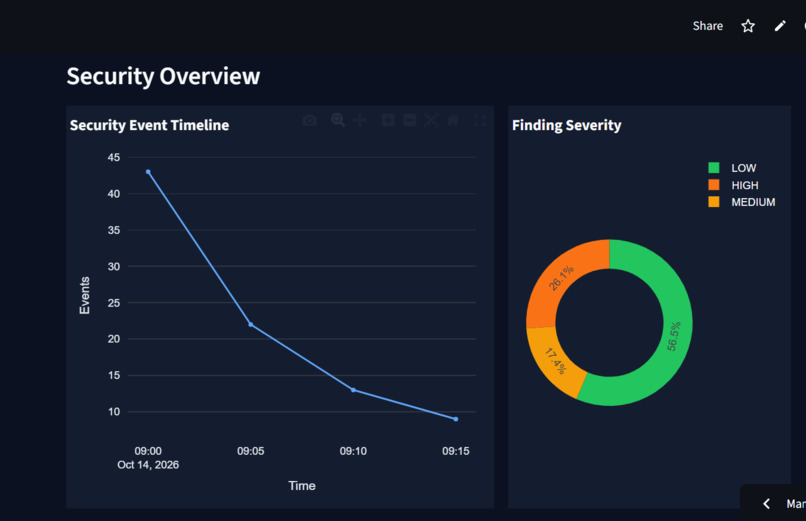
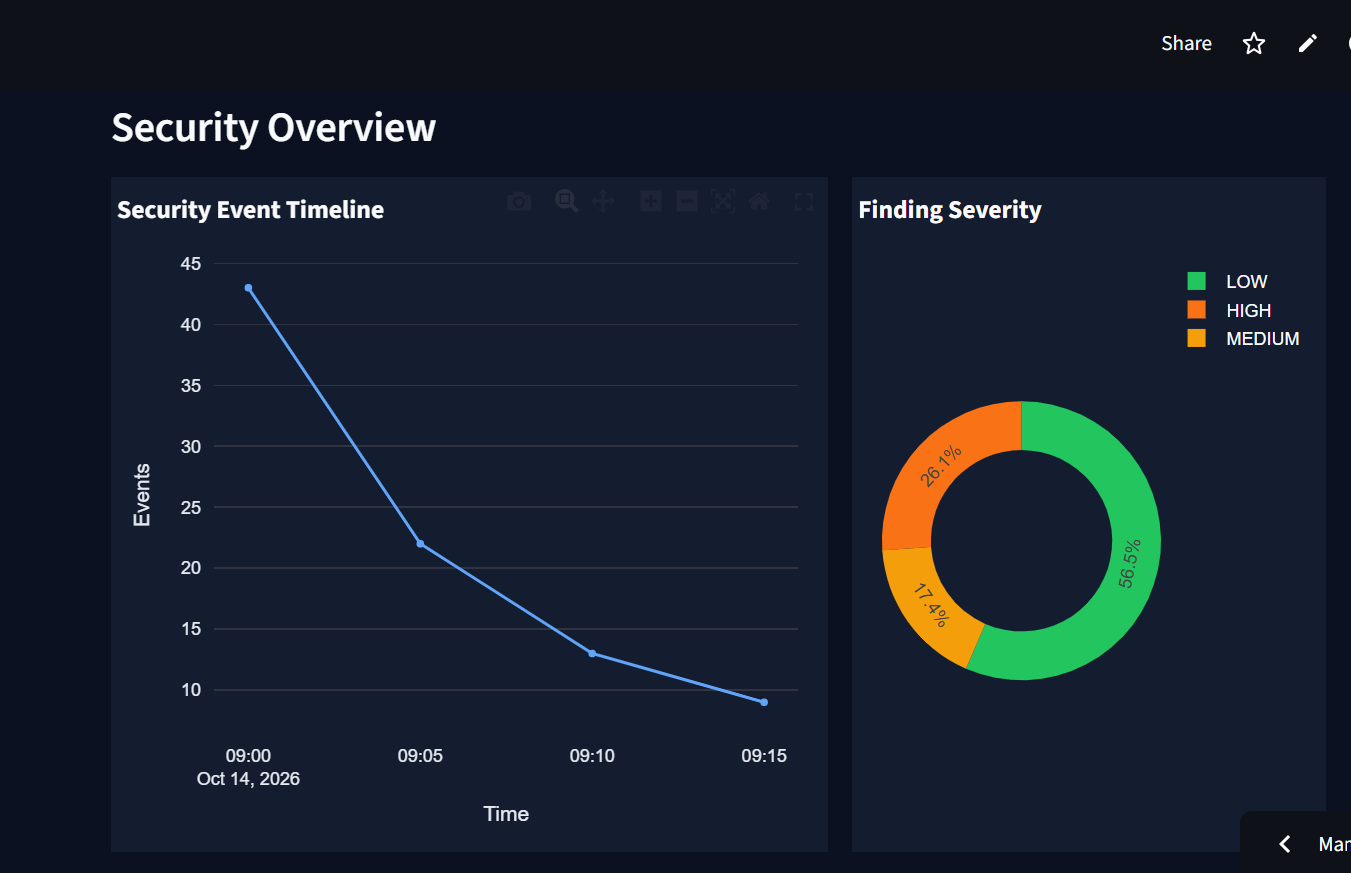
graphs and charts to show security overview, threat analysis, etc.
-
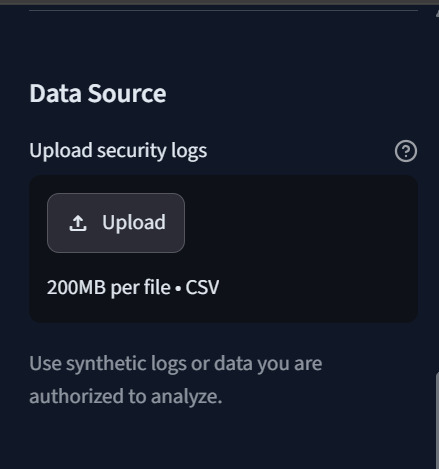
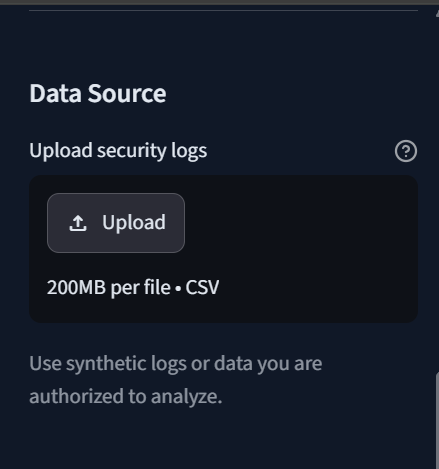
Upload csv file to detect signals and uncover threat.
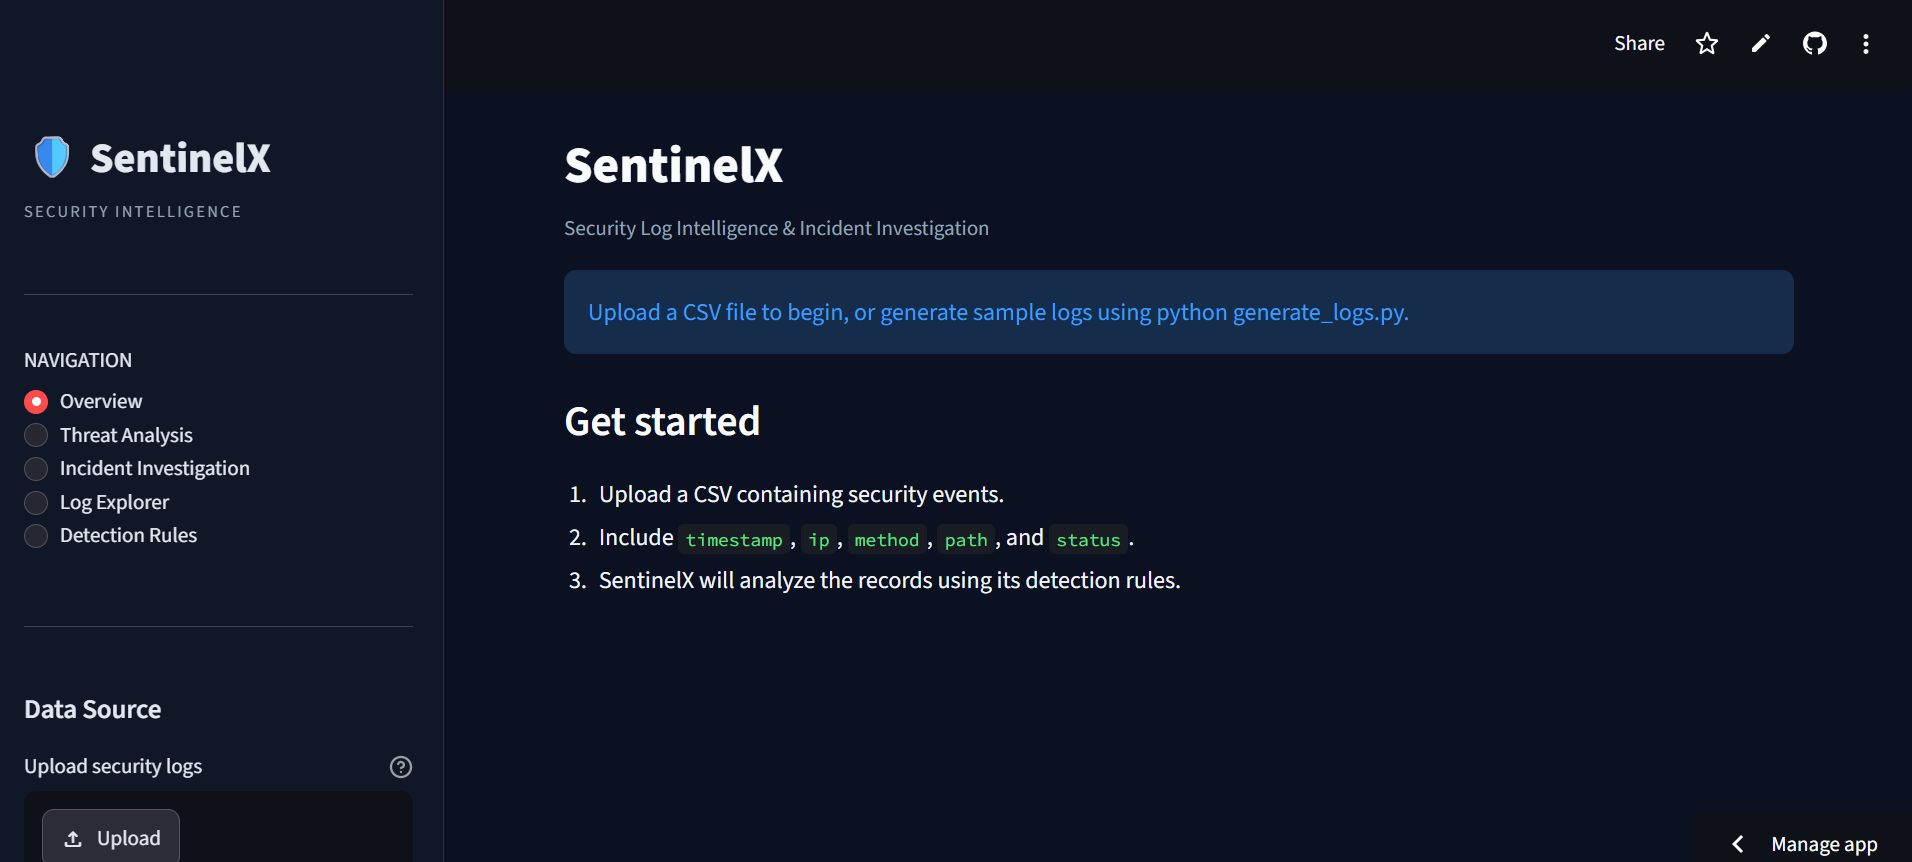
SentinelX — Detect the Signals. Uncover the Threats.
💡 Inspiration
Cybersecurity systems generate large volumes of logs, making it challenging to identify suspicious activity quickly. Hidden among ordinary requests, certain patterns may indicate potential security threats.
This inspired us to build SentinelX, a cybersecurity log analysis dashboard that transforms raw security logs into organized findings. We wanted to explore how automation, data analysis, and visualization could help users identify suspicious patterns, prioritize potential threats, and investigate incidents through a single interface.
Our goal was to make security log analysis more accessible, understandable, and efficient.
🛡️ What It Does
SentinelX analyzes structured security logs and flags patterns associated with potentially suspicious activity.
- SQL Injection Detection: Identifies request patterns that may indicate attempts to manipulate database queries.
- Path Traversal Detection: Flags suspicious paths that may attempt to access files outside their intended directories.
- Sensitive-Path Probing: Identifies requests targeting potentially sensitive locations, including configuration files and administrative endpoints.
- Brute-Force Indicators: Detects repeated failed login attempts from the same IP address within a defined time window.
- Risk Scoring: Assigns heuristic risk scores and severity levels to help prioritize findings.
- Incident Investigation: Displays details about selected findings and generates downloadable JSON incident reports.
- Interactive Dashboard: Presents metrics, charts, searchable logs, and filtering options in one place.
SentinelX highlights potential threats for further investigation. A detection indicates suspicious activity, not necessarily a successful attack.
⚙️ How We Built It
We built SentinelX using Python, combining rule-based detection, data processing, heuristic risk scoring, and interactive visualization.
Technologies Used
- Python: Core application logic, threat detection, risk scoring, and incident reporting.
- Streamlit: Interactive web dashboard.
- Pandas: Security log processing, cleaning, and analysis.
- Plotly: Interactive charts and visualizations.
- CSV: Structured security event input.
- JSON: Downloadable incident reports

Log in or sign up for Devpost to join the conversation.