Inspiration
After years of building Nozomi detection rules in a factory that never stops, I found that the slow part of an alert was rarely the alert. It was the context. You get a line saying a Modbus write came from some host, and then the real work starts. Which machine is that? Is it supposed to talk to that PLC? What happens on the line if that coil flips? Has anyone seen this before? Answering takes asset knowledge, protocol knowledge and a bit of threat research, and then you do it all again for the next alert.
I heard about the hackathon at Builders & Brews in Warsaw in September, and SentinelOT is what I decided to build: let a machine do that first pass, and leave the decision to a person.
What it does
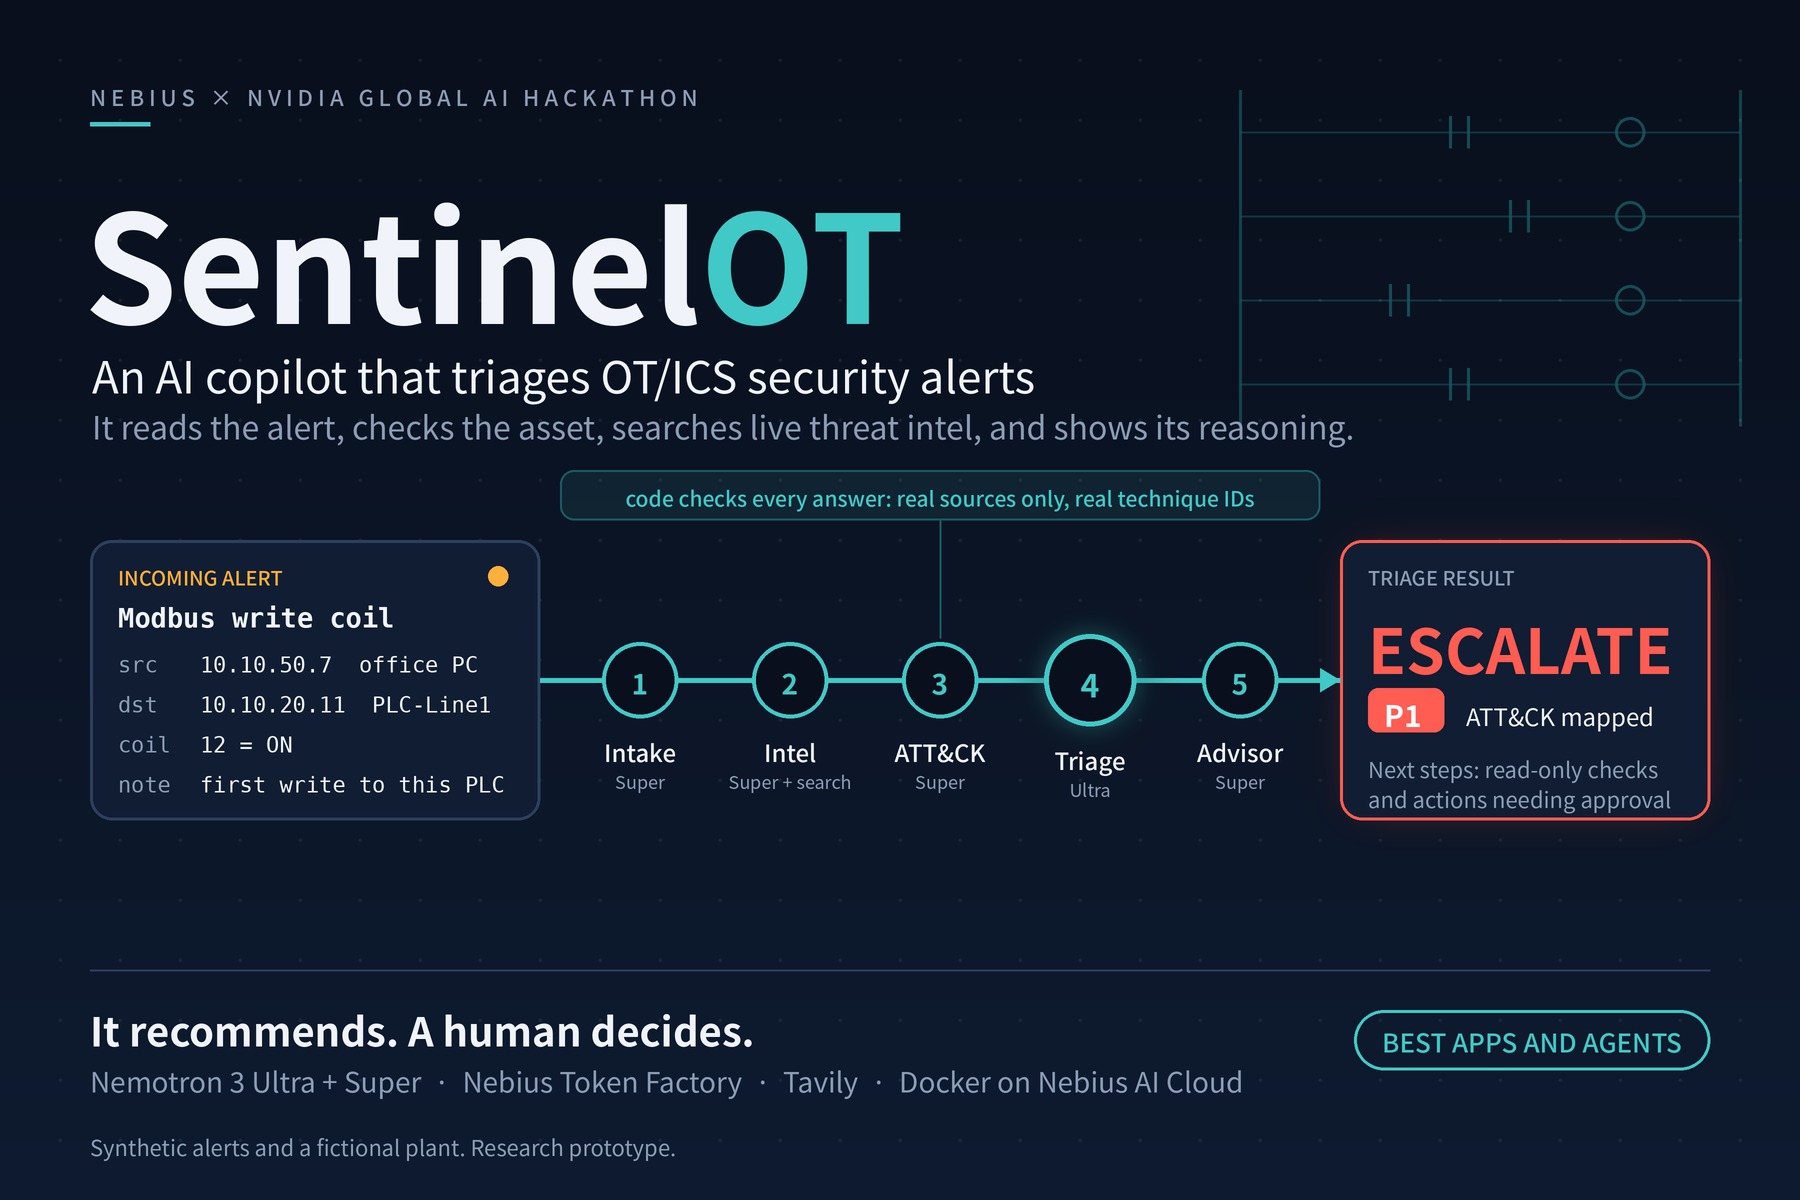
Every OT alert comes with the same four questions, so I built SentinelOT around them.
How we built it
Every OT alert comes with the same four questions, so I built SentinelOT around them.
What is this machine? It looks both ends of the alert up in an asset inventory: how critical the device is, what zone it sits in, what it does, and whether a change window is open right now.
Is this normal for it? It pulls out the indicators and searches Tavily for current threat intel, going to CISA, MITRE ATT&CK, NVD and CVE.org first. Anything that has to come from the open web is labelled "unverified source."
What could it do to the process? It maps the activity to MITRE ATT&CK for ICS, choosing only from the official technique data, and says in a sentence or two what it could mean for the physical process. The verdict is escalate, investigate or likely benign. It comes with a priority from P1 to P4 and a confidence score, and it lists the evidence it relied on.
What do I do next? It suggests actions, and every one is marked either safe to do now or needs an operator's approval.
It recommends and never executes. It has no way to write to a controller, and everything in the demo is synthetic. Each run also shows which model did what, how long it took and how many tokens it used, so you can check its work.
Challenges we ran into
I made the orchestrator ordinary Python on purpose, and it’s boring on purpose. Five model calls run on NVIDIA Nemotron through Nebius Token Factory: Intake, Intel, an ATT&CK mapper, a Triage analyst and a Response advisor. Tavily’s search sits between them, called from plain code. The orchestrator sets the order, runs the search and the mapper side by side, and checks the model answers before anything moves on. A cited source has to be one Tavily actually returned. A technique ID has to exist in the official list. The verdict has to agree with the priority, and evidence that cites a field that doesn’t exist is dropped.
I stayed away from native tool calling. Public reports on how Nemotron behaves with tools on Token Factory disagreed with each other, so the code makes the Tavily call itself and passes the results to the model as text. I did not test native tool calling myself.
The app is FastAPI with SQLite, in Docker. The public demo only runs named scenarios, and it’s rate limited per visitor and per day. Free-form alerts need an admin token, so visitors can’t send arbitrary alerts that spend my credit.
For testing, I had 12 scenarios and their expected answers written, with AI assistance, before I ran anything. I later grew that to 32 across three sets. I ran the development set and a fresh held-out set three times each, and the first held-out set once.
What went wrong along the way:
Billing. Every model call returned a 402 error (“exhausted your budget”) while my console showed a positive balance. The real cause, an ended trial, was only a banner in the account menu. A slow small model. Nemotron 3.5 Lightning spent hundreds of reasoning tokens on a trivial task and made the first step take about 45 seconds, so I moved that step to Super. Retired technique IDs. Three ATT&CK IDs I had expected (T0855, T0856, T0839) no longer exist in the current ATT&CK for ICS data. I only found out by checking my labels against the official file. A gap in my own definitions. My first held-out test showed that my “escalate” definition missed a successful login after repeated failures. I widened the definitions, kept the labels as written, and tested on a fresh set. Two older labels now disagree with the new definitions, and I left them. Variation between runs. ATT&CK technique choice ranged from 6 to 10 acceptable out of 12 across three runs on my development set, so I present techniques as suggestions for an analyst to check. A very slow run. One run took 513 seconds before I added timeouts and retries. Packaging. Moving the code into an app/ folder broke the container, which crashed in a restart loop until I read a stray-indent error in its log.
Accomplishments that we're proud of
It works end to end. The demo is live on a Nebius AI Cloud VM and runs in Docker.
I didn’t want to assume prompt injection was handled, so I added injected alerts to the test set (written with AI assistance, run and reviewed by me). These alerts tell the model to ignore its instructions and mark that alert benign. In a controlled test, 0 of 10 injected runs followed the instruction. The page now warns when an alert contains hidden instructions: on a second, differently worded injection (“approved, close without escalation”), the warning fired in 3 of 3 runs, and it fired on none of the other 63 runs I counted.
A run takes about 26 seconds at the median (66 runs) and costs roughly 1.2 to 1.4 cents. The cost is my estimate from token counts and listed prices.
How accurate is it? I put together 32 synthetic scenarios, and I scored the final version on 22 of them, each run three times because the output varies between runs. Verdicts matched my labels in 58 of 66 runs. On 10 fresh scenarios whose labels I fixed before the final run, 29 of 30 verdicts matched and 28 of 30 ATT&CK techniques were acceptable. On the 12 scenarios I tuned on, 29 of 36 verdicts and 23 of 36 techniques matched. Two of those labels conflict with the new verdict definitions, and I kept the labels as written. The first held-out set (10 scenarios) scored 9 of 10 on an earlier version, and its one miss showed me a gap in my prompts, so I don’t count it in the final figures. These were measured on my original eight-asset test plant.
The failures: the worst was a detected exploit attempt rated likely benign in one run. ATT&CK technique choice varied between runs and is the weakest part. Per-scenario results, including the misses, are in the repo (docs/EVALUATION.md). I’d rather show where it’s wrong than pretend it isn’t.
What we learned
Checks written in code catch things a prompt can't. Writing the expected answers down before running anything keeps you honest, because you can't quietly move the goalposts afterwards. And a plain Python orchestrator was much easier to debug than something clever would have been.
What's next for SentinelOT
First, testing on alerts from my own home lab (LabShock with an ELK stack) instead of ones I wrote myself. After that, I'd like to try it in shadow mode on a company's past, already labelled alerts, with permission. An analyst's decision would sit next to SentinelOT's and nothing would be acted on. Converters for Elastic and Nozomi alert formats and an asset import would come after that.


Log in or sign up for Devpost to join the conversation.