Inspiration
Understanding how people feel is critical in today’s data-driven world. From businesses analyzing customer reviews to researchers studying public opinion, sentiment analysis provides actionable insights into emotions hidden within text data.
What it does
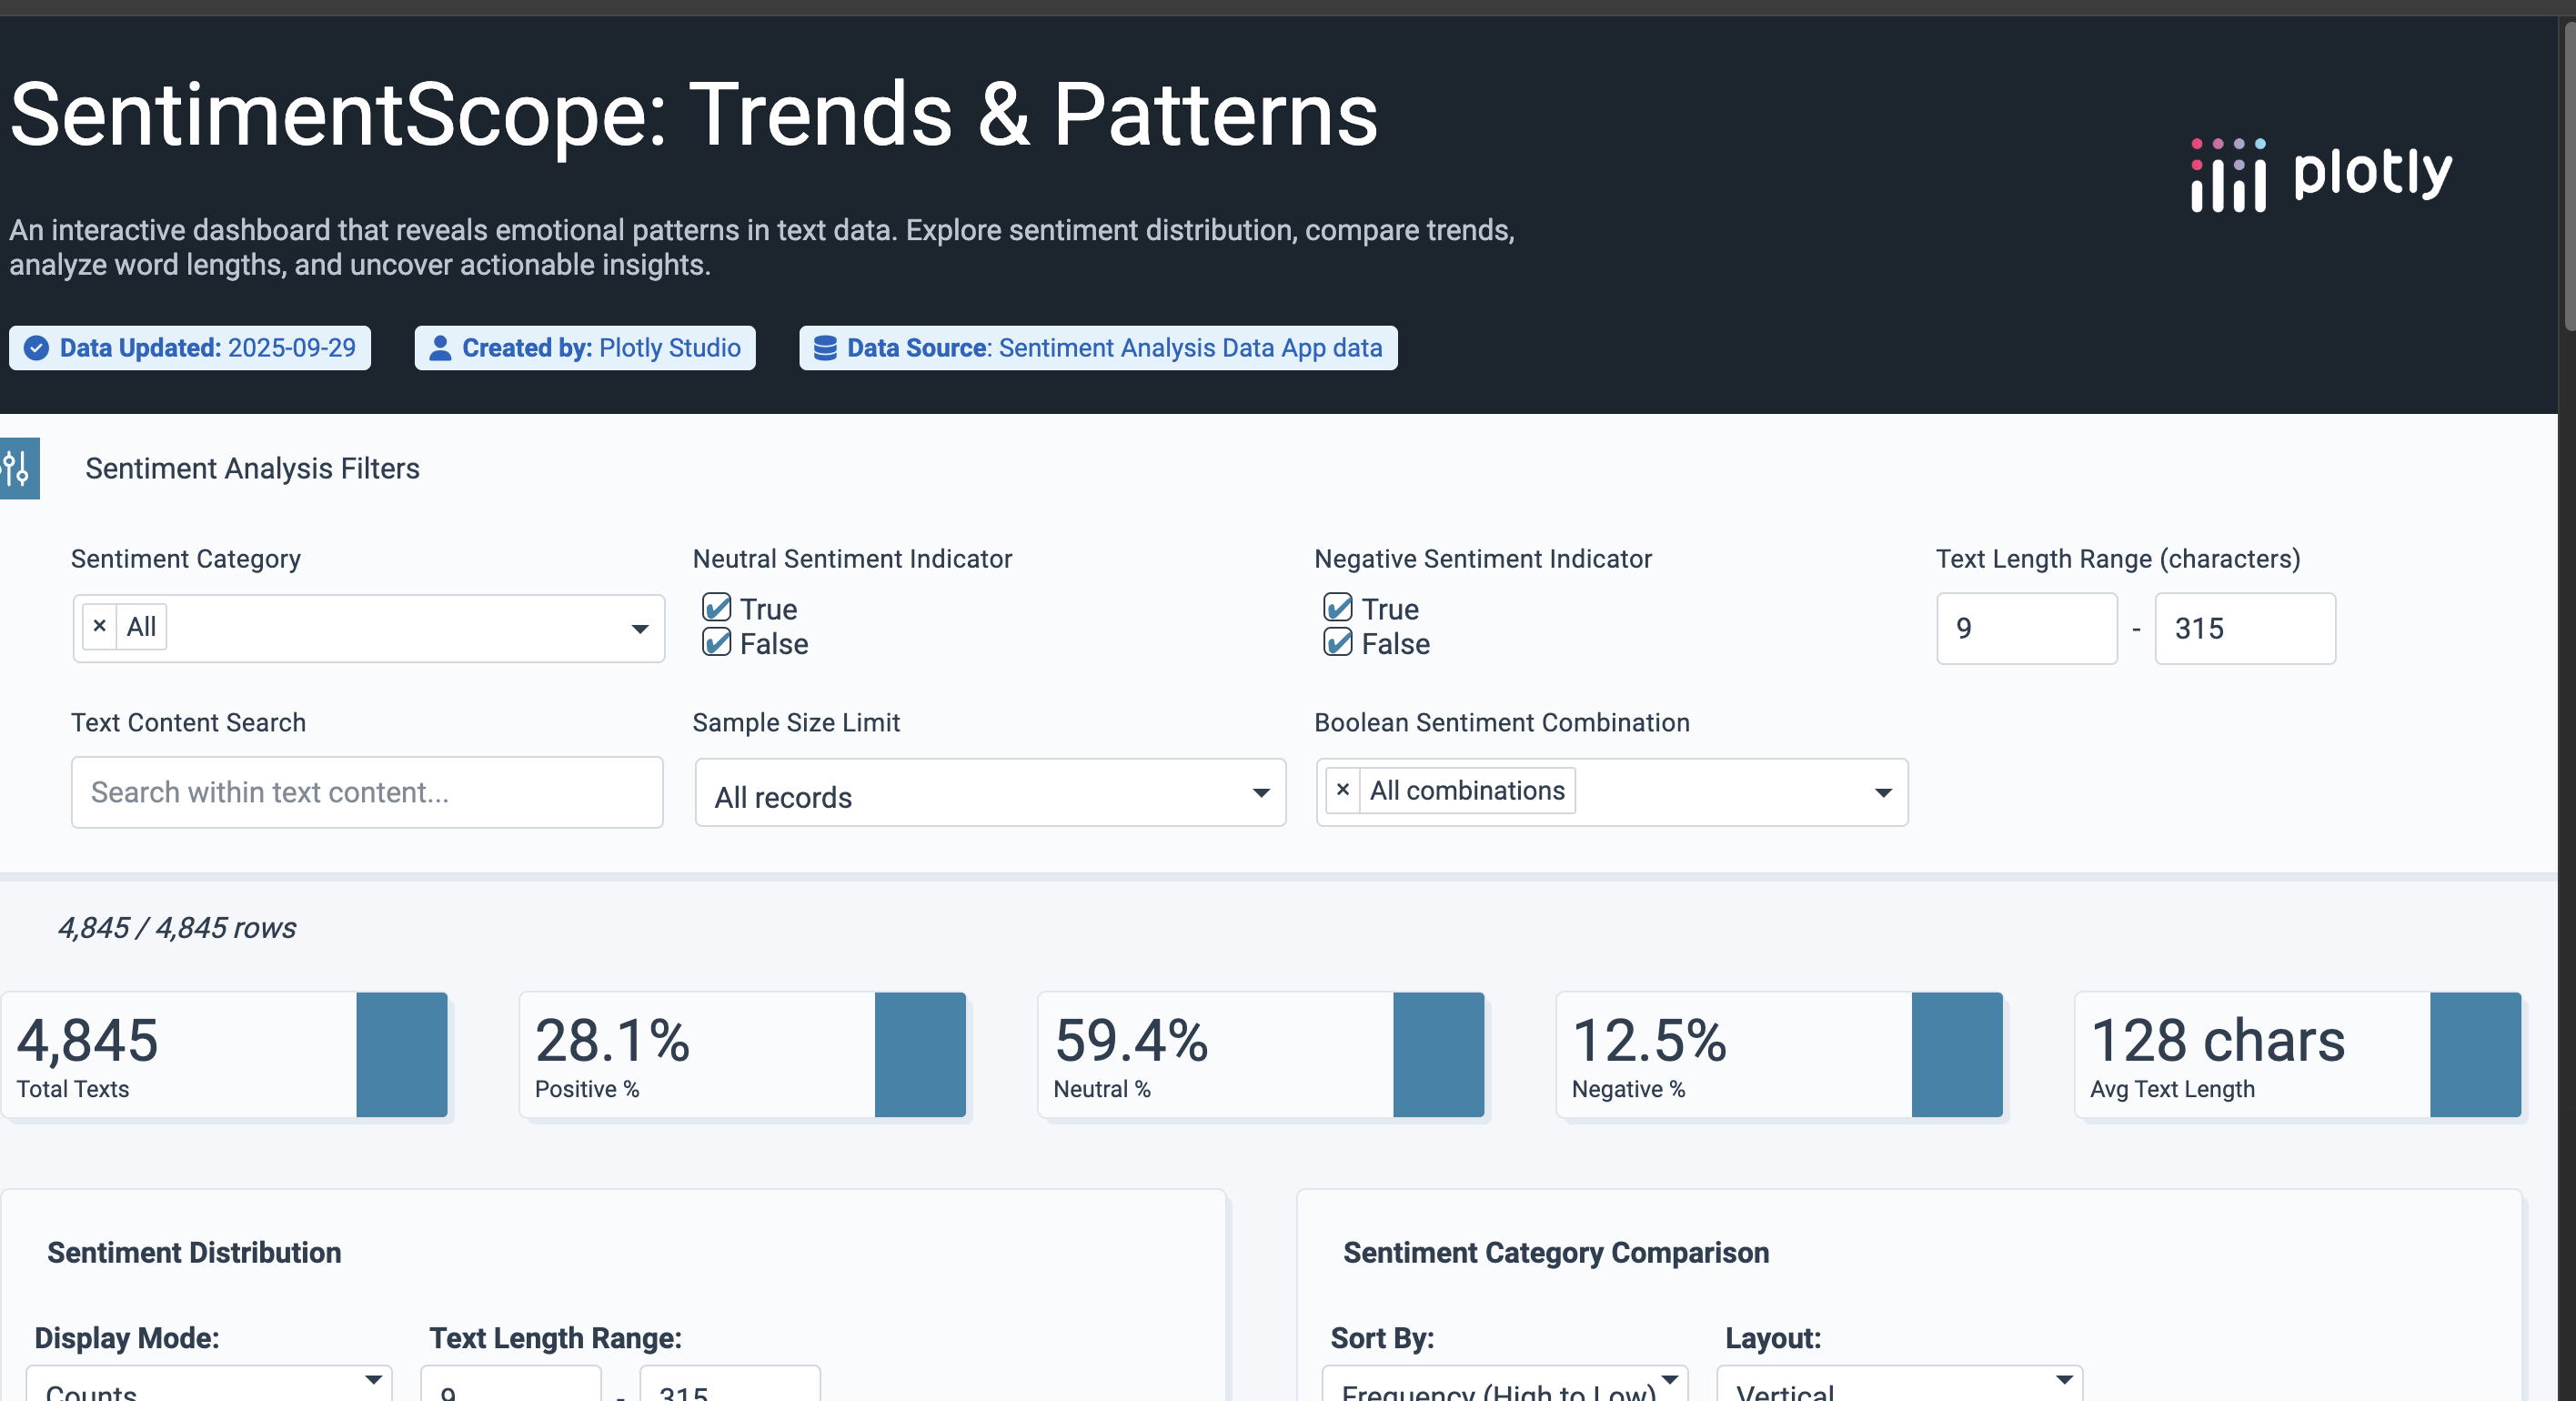
SentimentScope is an interactive web app that analyzes text data to reveal sentiment distributions, compare patterns across categories, explore text length relationships, and uncover hidden trends. Users can filter data globally, view sentiment breakdowns, and dive into detailed analysis through interactive visualizations and tables.
How we built it
I built the app using plotly, Python, Plotly Dash, and Pandas. Dash powered the front-end interactivity and layout, while Pandas handled the data manipulation. The app includes custom visualizations for sentiment distribution, comparisons, patterns, boolean sentiment matrices, and a searchable data table.
Challenges we ran into
Integrating multiple visualizations without cluttering the interface.
Optimizing performance for larger datasets.
Designing an intuitive user experience that balances detail with clarity.
Accomplishments that we're proud of
Building a fully functional interactive sentiment analysis app in a short timeframe.
Creating clean and insightful dashboards that make complex data understandable.
Designing a reusable framework that can easily adapt to new datasets.
What we learned
How to structure Dash layouts effectively for data apps.
The importance of clear, user-friendly data visualization design.
Practical challenges in scaling text analytics for real-world use.
What's next for SentimentScope: Trends & Patterns
We plan to:
Add real-time data streaming for live sentiment tracking (e.g., social media feeds).
Integrate machine learning models for deeper sentiment classification.
Expand to support multilingual sentiment analysis.
Enable export options (CSV, PDF) for sharing insights.
Built With
- data
- plotly

Log in or sign up for Devpost to join the conversation.