-
-
Stock Market AI
-
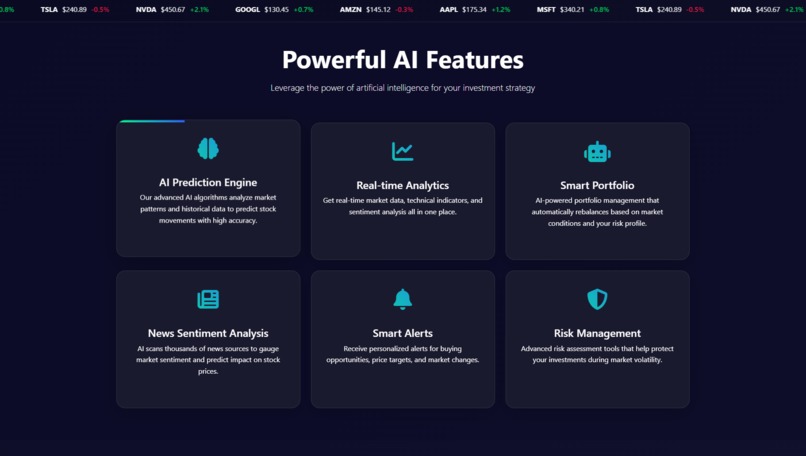
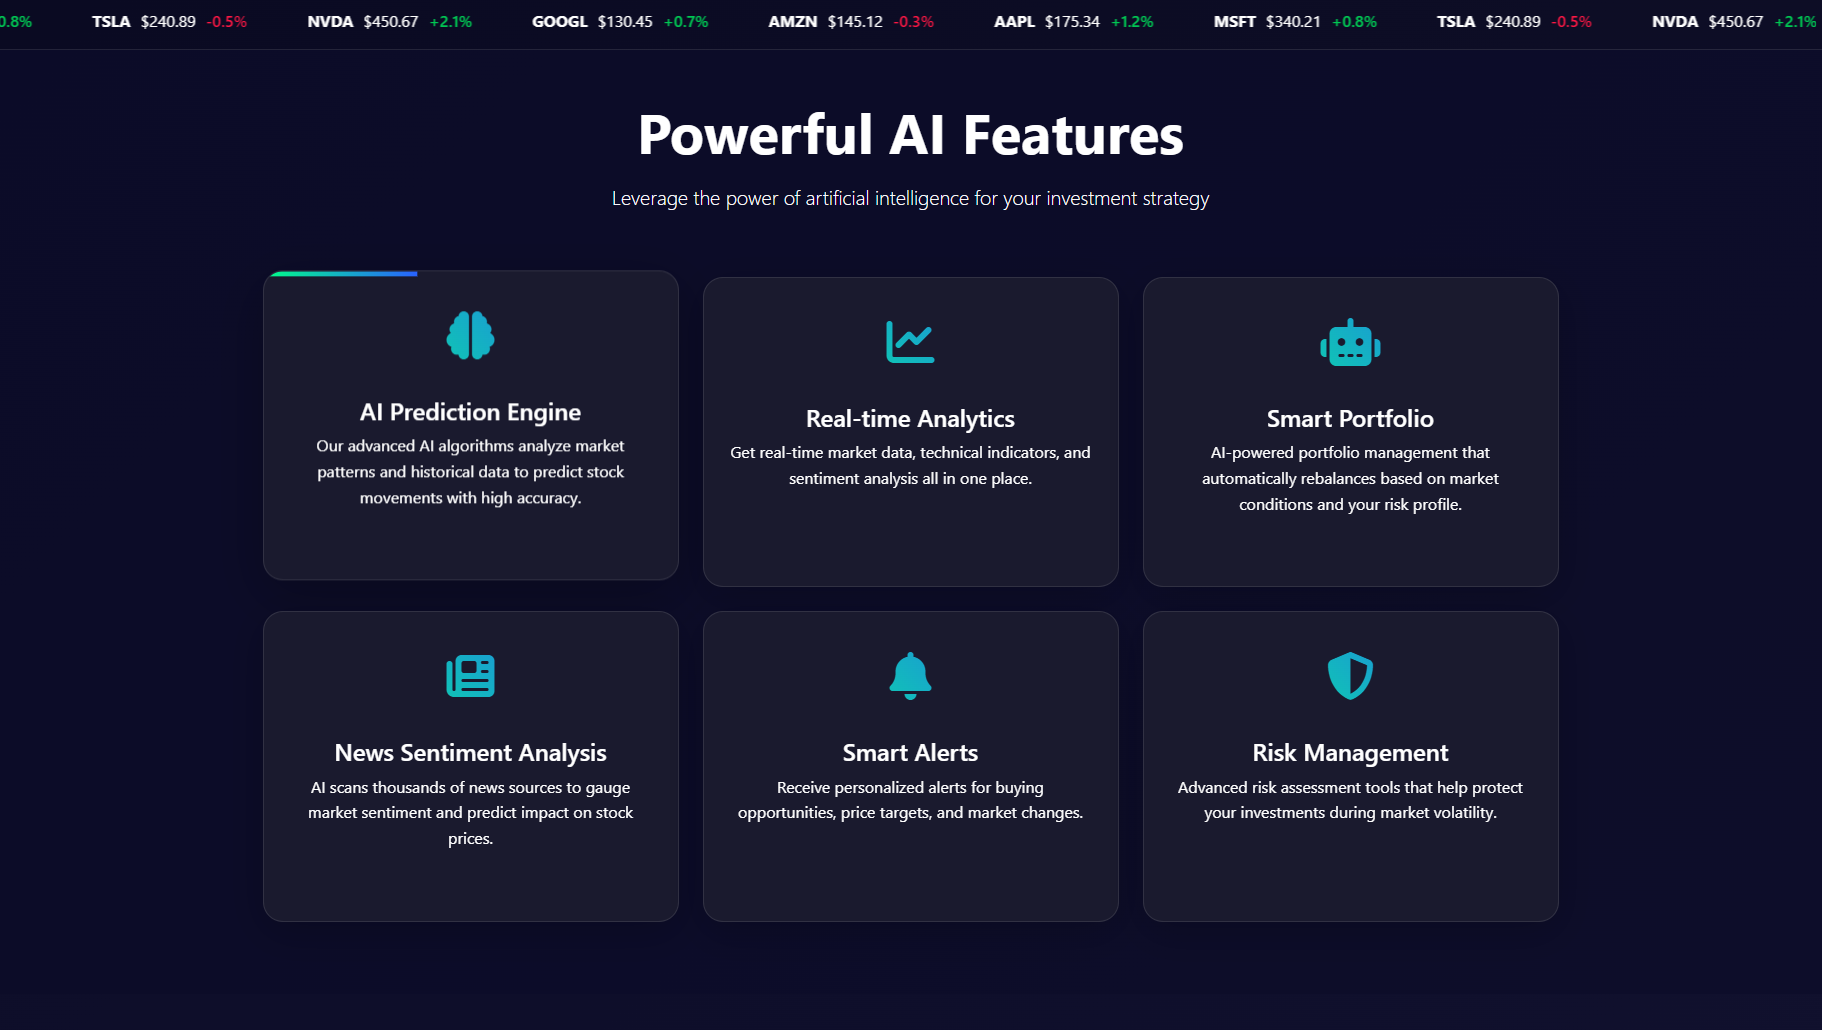
AI features
-

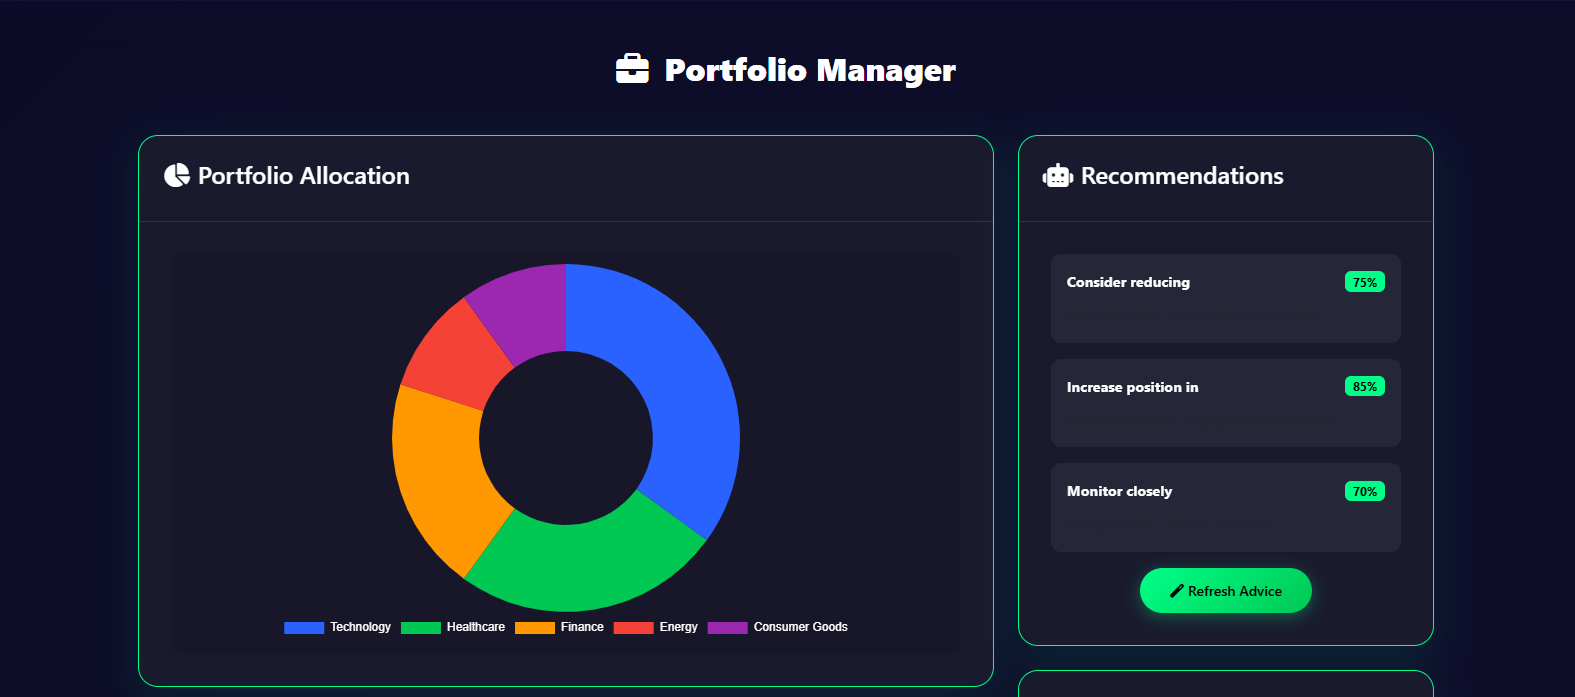
Portfolio Manager
-
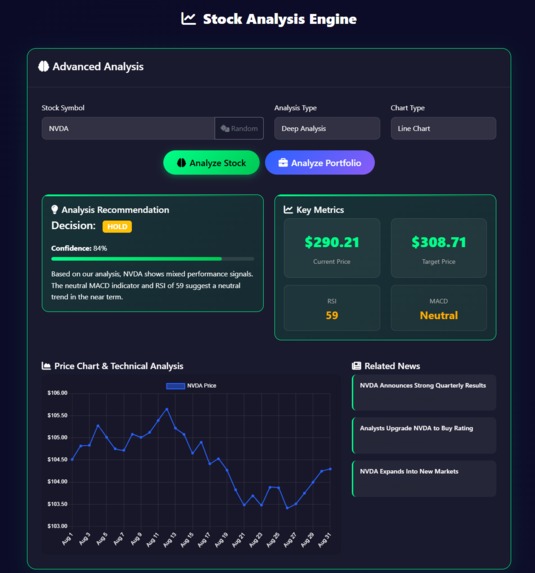
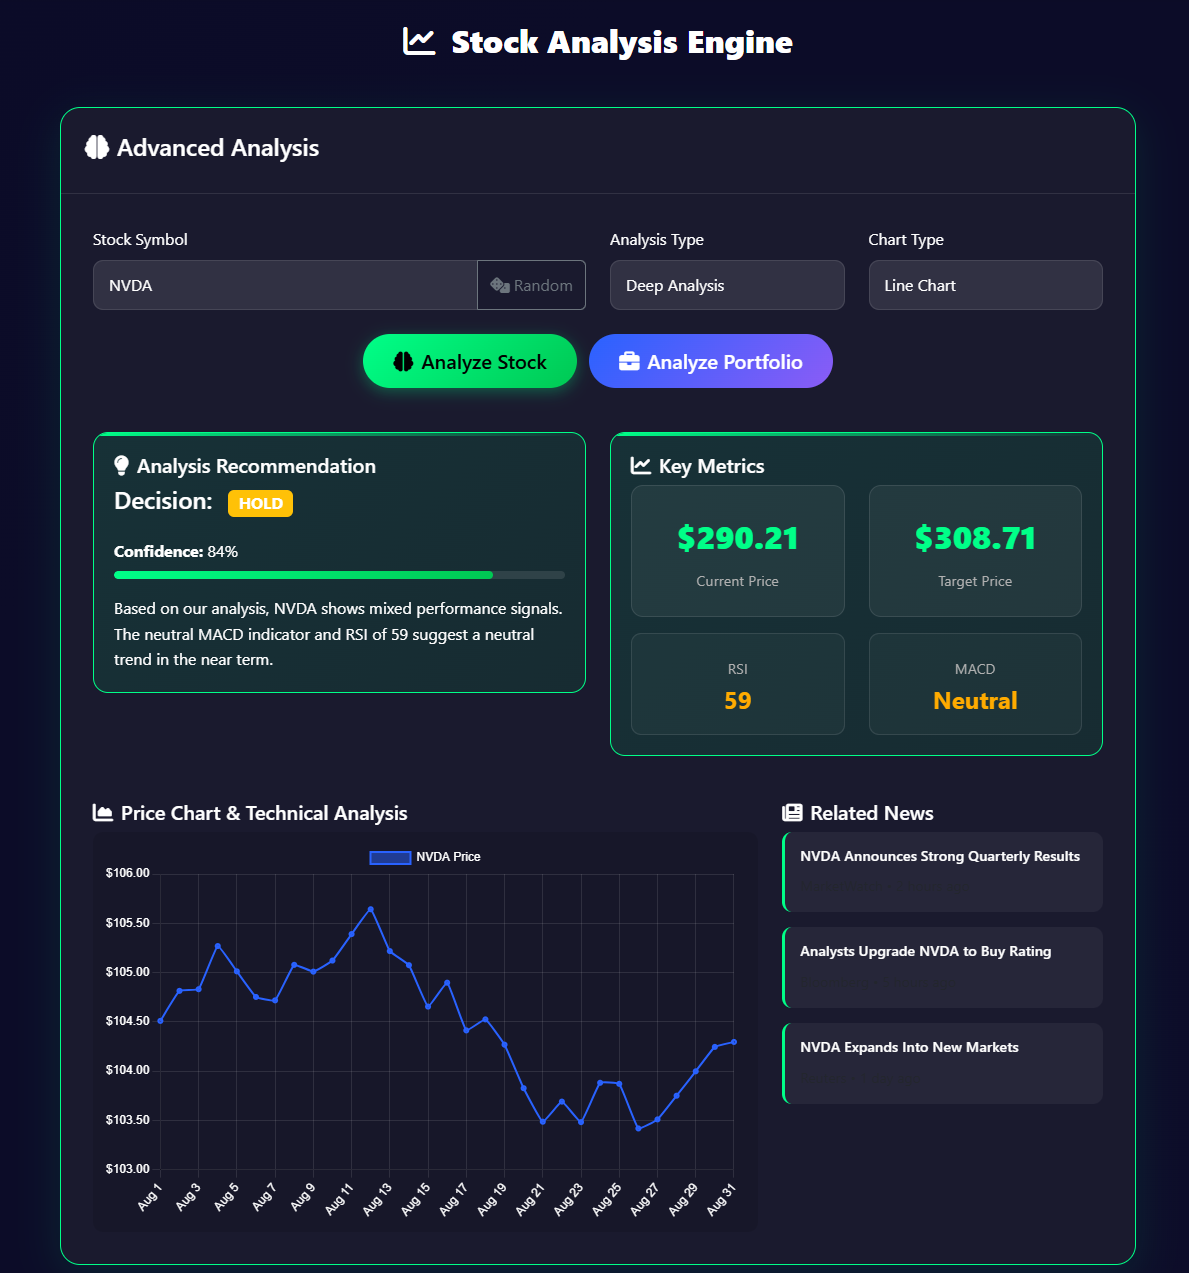
Stock Annalyzer
-

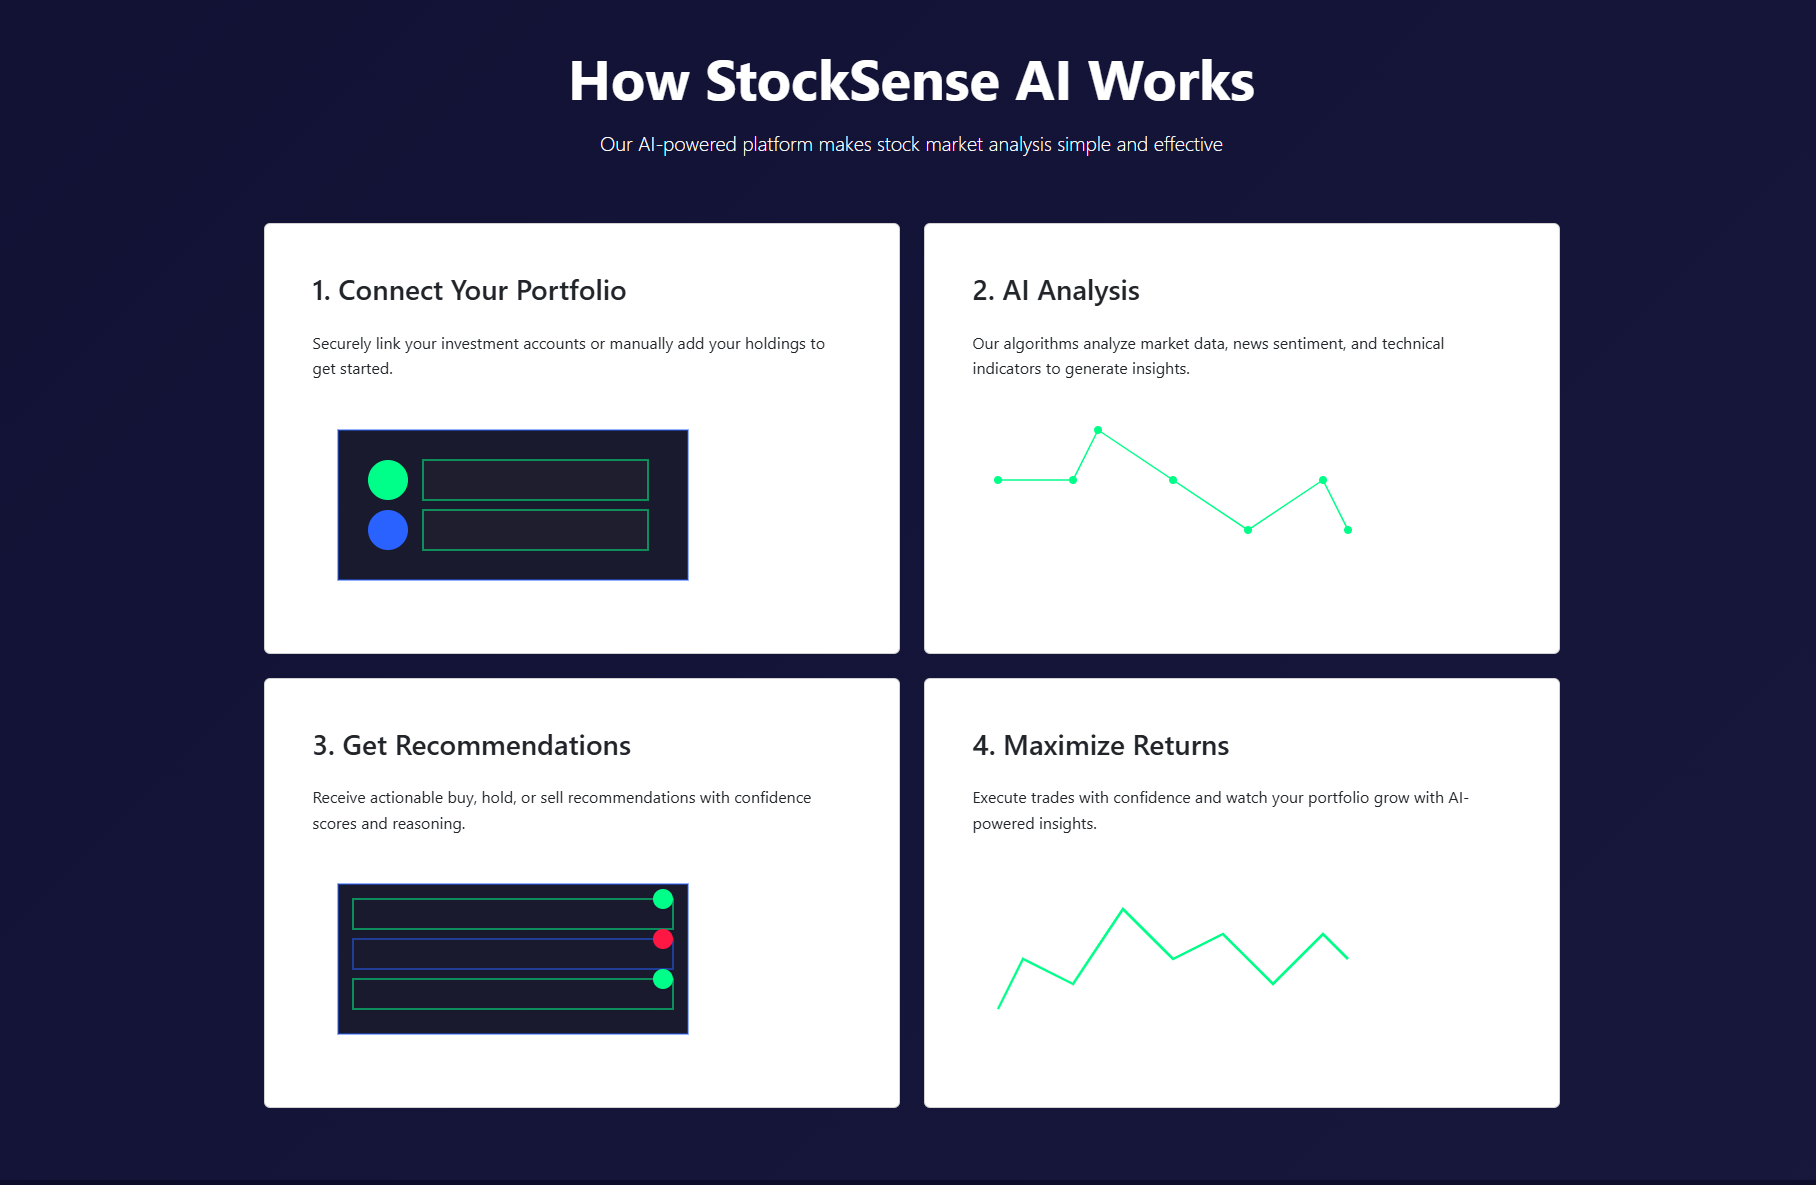
How StockSense Works
My journey with StockSense began with a simple observation: the world of investing has become increasingly complex, yet the tools available to most individual investors remain either overly simplistic or prohibitively expensive. As someone passionate about both technology and finance, I noticed a significant gap between professional trading platforms and what's available to everyday investors.
The inspiration struck during the 2021 meme stock phenomenon, when I saw countless retail investors making decisions based on social media sentiment rather than data-driven analysis. I realized that what was missing wasn't information—there's plenty of that—but rather accessible, intuitive tools to transform raw data into actionable insights.
I asked myself: What if we could democratize sophisticated investment analysis? What if every investor, regardless of their account size, could access the kind of analytical power previously reserved for Wall Street professionals? The Learning Journey
Building StockSense became one of the most challenging and rewarding experiences of my development career. The project pushed me to grow in multiple dimensions: Technical Skills Acquired
Advanced Data Visualization: Mastering Chart.js to create responsive, interactive financial charts
Modern CSS Techniques: Implementing complex gradients, animations, and responsive designs with pure CSS

JavaScript Architecture: Designing a maintainable frontend architecture without frameworks

UI/UX Principles: Creating an interface that balances information density with usability
Financial Knowledge Gained
Through research and consultation with finance professionals, I developed a deeper understanding of:
Technical indicators (RSI, MACD, moving averages)

Portfolio theory and risk metrics

Market sentiment analysis

Behavioral finance principles
The most valuable lesson was learning to translate complex financial concepts into intuitive visual representations that everyday investors can understand and act upon. How I Built StockSense Phase 1: Foundation & Architecture
I began with a component-based approach, designing the dashboard as a series of interconnected modules:
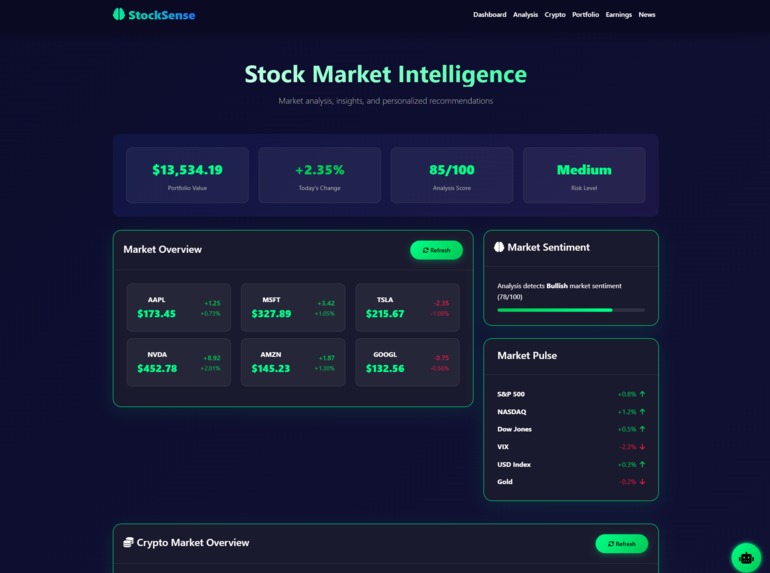
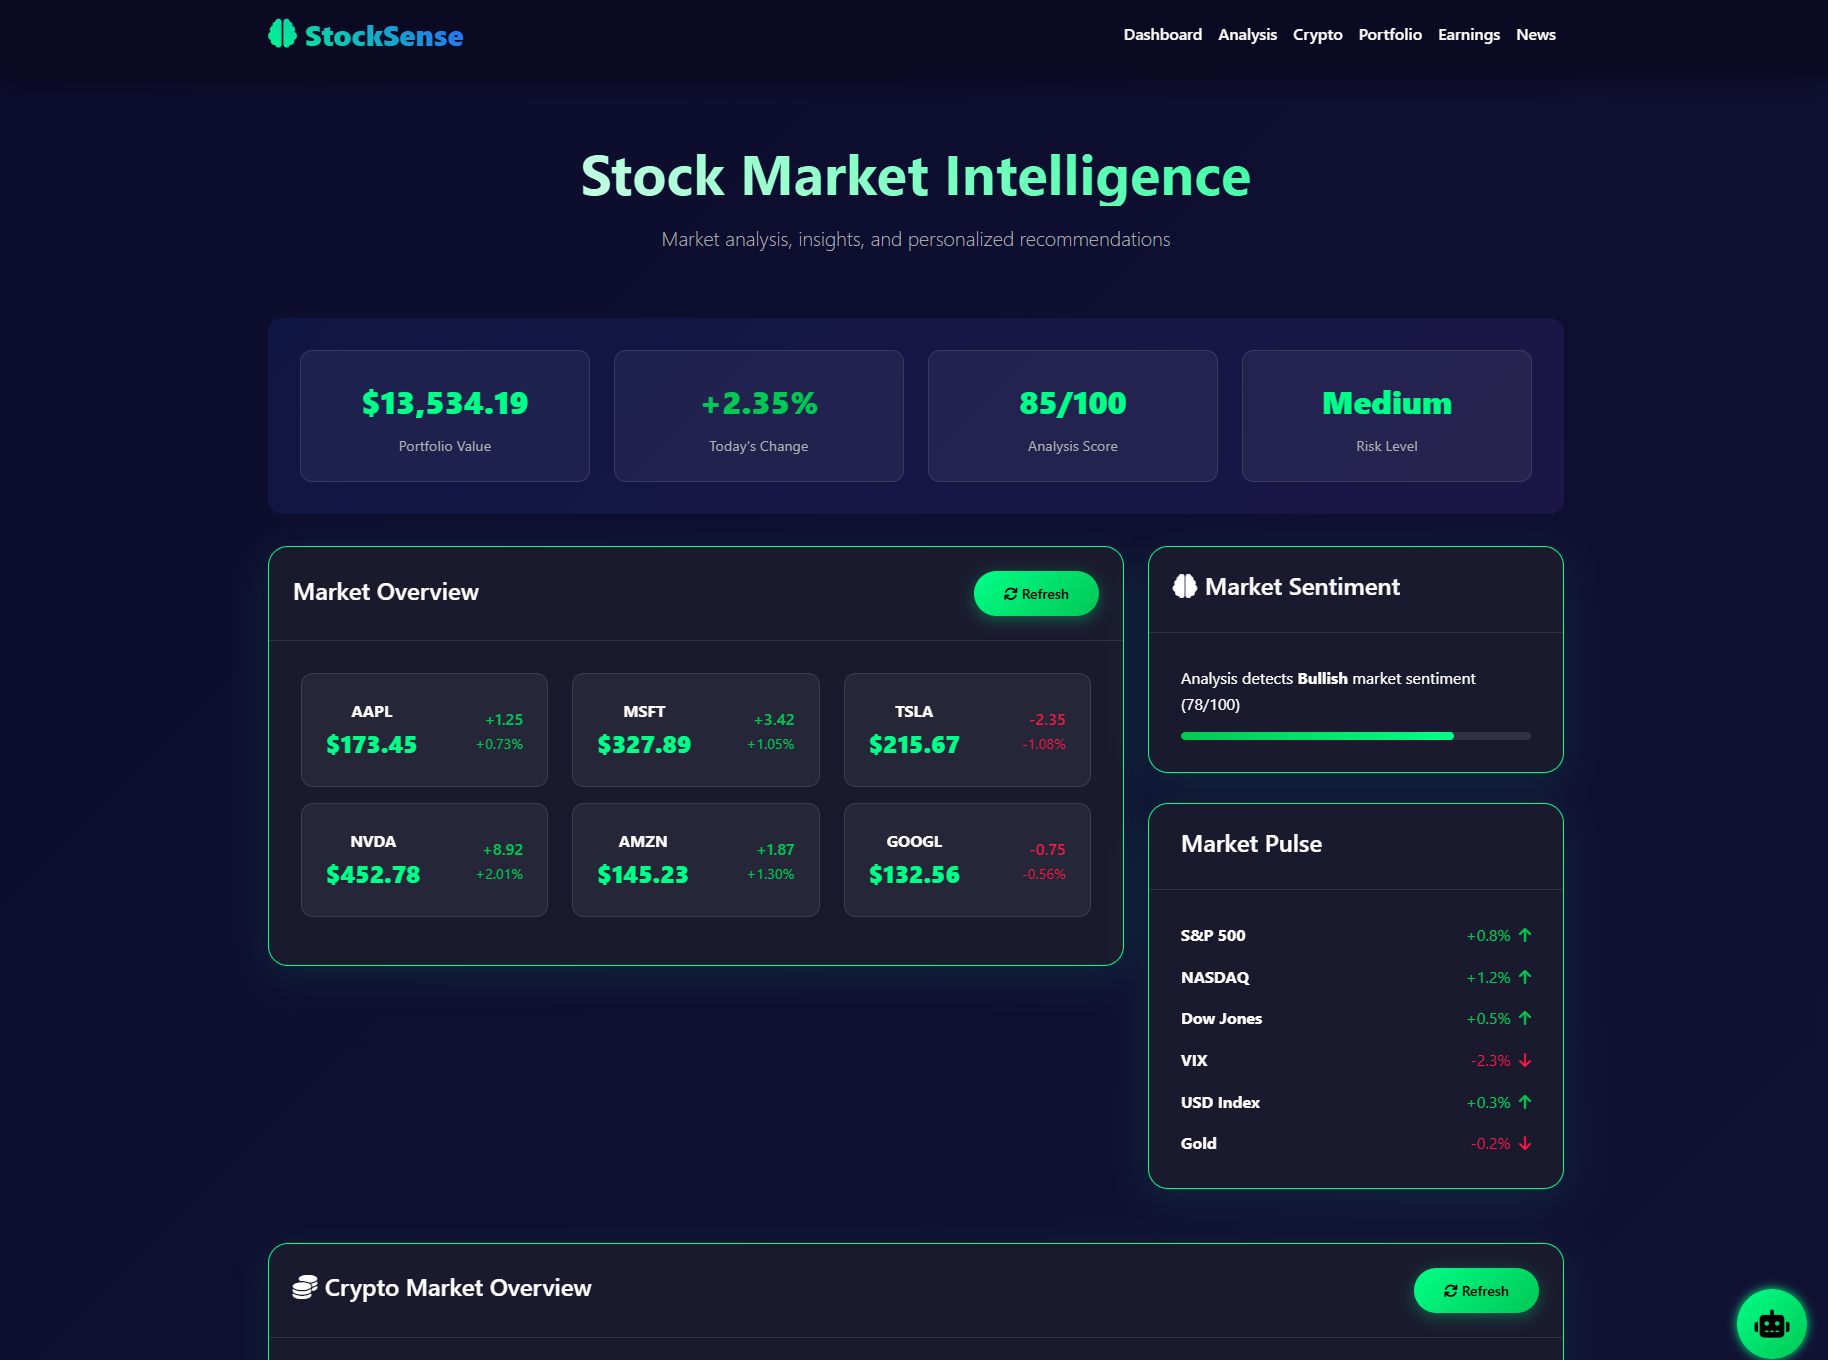
Market Overview Module: Real-time (simulated) price data and trends

Analysis Engine: Technical indicator calculations and visualization

Portfolio Manager: Tracking performance and allocation

News & Sentiment Aggregator: Market context and insights
Phase 2: Data Design
Since I wanted to avoid external API dependencies, I created a robust simulation system:
Price data generators that mimic real market behavior using geometric Brownian motion:
dSt=μStdt+σStdWtdSt=μStdt+σStdWt
Where $S_t$ is the stock price, $\mu$ is the drift, $\sigma$ is the volatility, and $W_t$ is a Wiener process.
Sentiment analysis simulation using natural language processing techniques on news headlines
Phase 3: UI/UX Implementation
I focused on creating an immersive experience with:
Dark theme optimized for long viewing sessions

Strategic color coding (green for gains, red for losses) for quick comprehension

Progressive disclosure of information to avoid overwhelming users

Smooth animations to guide attention without distraction
Phase 4: Testing & Refinement
I conducted usability testing with both experienced traders and complete beginners, iterating based on feedback to create an interface that works for diverse skill levels. Challenges Overcome Technical Hurdles
Performance Optimization: Initially, the chart animations caused jankiness. I implemented canvas recycling and optimized data structures to maintain smooth performance even with large datasets.

Responsive Design Complexity: Creating a consistent experience across devices required innovative CSS solutions, particularly for the trading charts.

State Management: Without a framework, I developed a custom state management system that efficiently tracked user interactions and data changes.
Design Challenges
Information Hierarchy: Balancing the need for comprehensive data with clean design required multiple iterations and user testing.

Educational Value: Making complex financial concepts accessible without oversimplifying was perhaps the greatest design challenge.

Emotional Design: Investing can be stressful, so I worked to create an interface that provides information without inducing panic during market downturns.
Building StockSense taught me that the most powerful technology isn't necessarily the most complex—it's what most effectively solves real problems for real people. The project reinforced my belief that elegant solutions emerge at the intersection of technical excellence and deep empathy for user needs.
Looking forward, I envision StockSense evolving to include:
Machine learning-powered predictive analytics

Social sentiment integration

Personalized investment coaching

Blockchain-based verification of analysis models
This project represents not just a technical accomplishment, but a step toward my vision of democratizing financial intelligence. If I can help even one person make better-informed investment decisions, then every hour spent on StockSense was time well invested.
StockSense represents the culmination of passion for technology, design, and financial empowerment. It stands as proof that with enough determination, we can build tools that make complex domains accessible to everyone.


Log in or sign up for Devpost to join the conversation.