Inspiration
Women and other marginalized groups are often the target of toxic comments online. We wanted to make data regarding online harassment more accessible and visualize it in an interactive way.
What it does
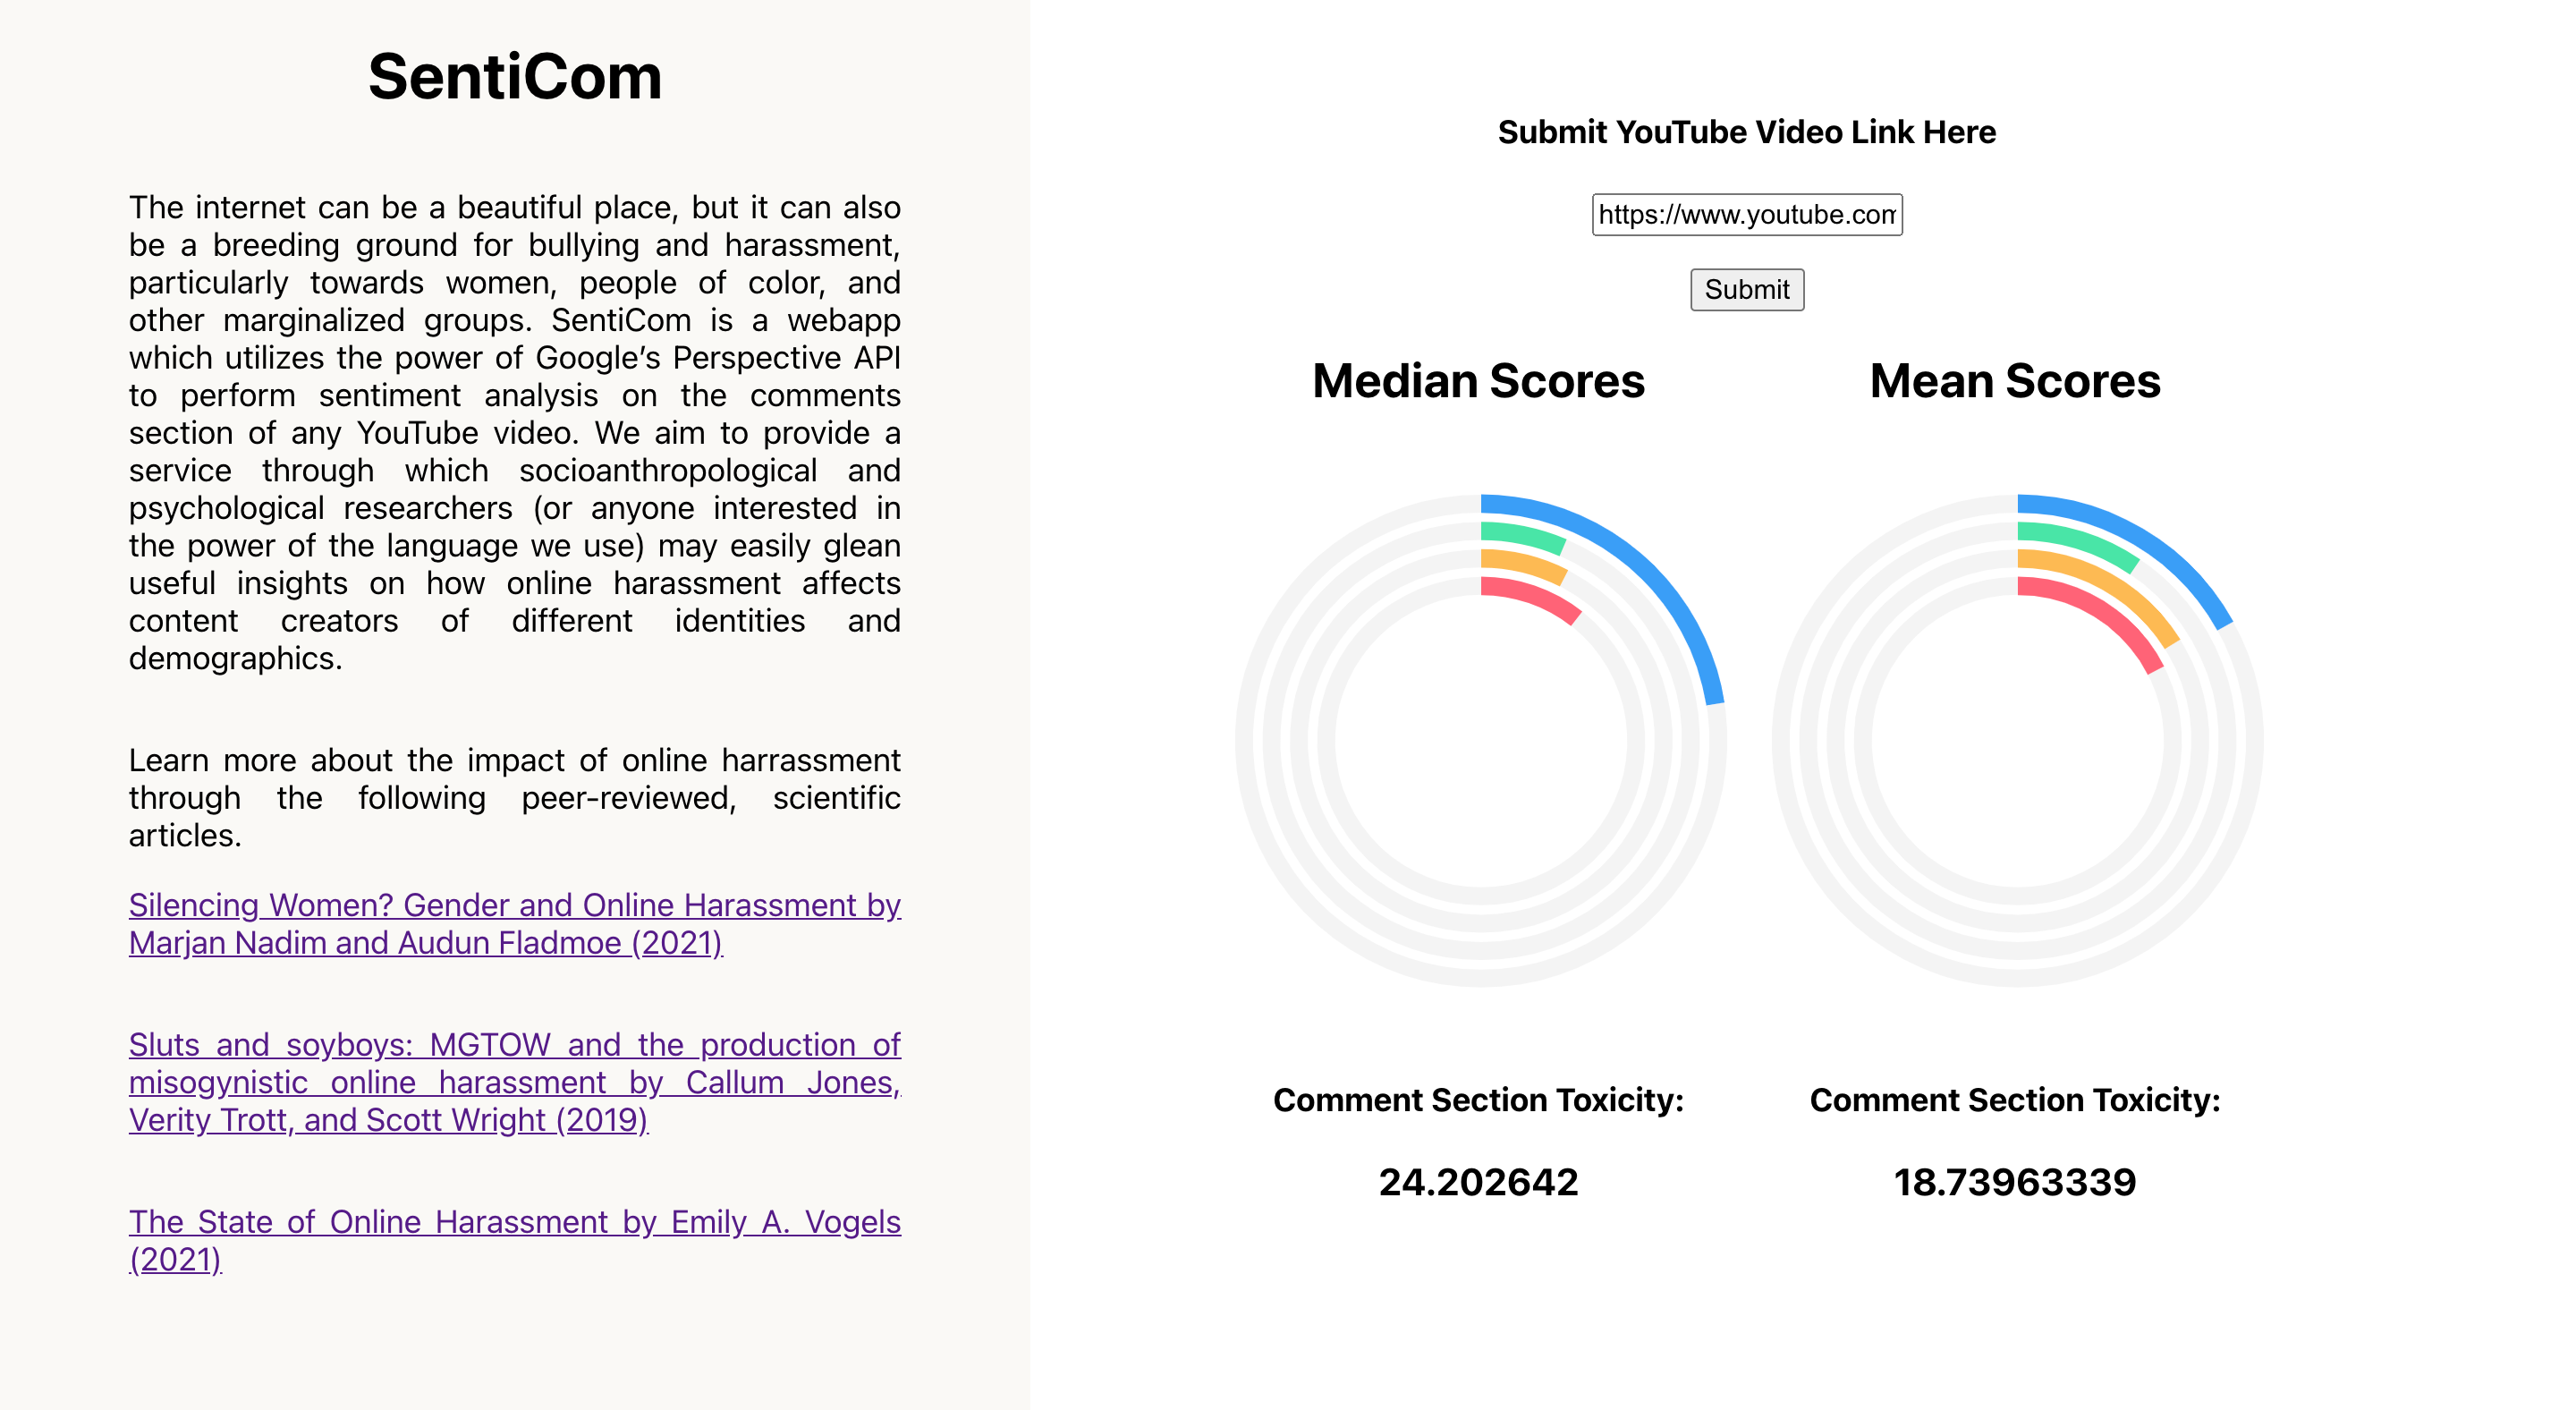
The user submits a YouTube URL or Video ID. Perspective API identifies abusive comments and scores them on several attributes, including toxicity, sexually explicit and identity attack. Graphs representing these scores and the toxicity rating are displayed for the user.
How we built it
We used React and Node.js, along with Google's YouTube API to fetch comments, Google's Perspective API to perform analyses on these comments, and ApexCharts to graph the data.
Challenges we ran into
Our project was originally intended for TikTok and Instagram, but due to web-scaping policies in the aforementioned social media services' TOS, we have to make a pivot to an entirely different platform! Some team members were also new to GitHub and learned how to manage multiple branches over the course of the hackathon.
Accomplishments that we're proud of
I'm proud that we were able to make a fairly drastic pivot and still create a fully functioning product, complete with three APIs that neither of us had ever worked with in the past. (Kira) I'm proud that I learned so many new skills over the course of 24 hours, including how to parse strings with Regular Expressions! (Kimberly)
What we learned
- RegEx
- Proxy Servers
- React
- GitHub Branches
- Working with Google APIs
- Time Management ## What's next for SentiCom Fleshing out the data visualizations and including options where users can directly compare two or more videos.


Log in or sign up for Devpost to join the conversation.