-
-
1
-
2
-
3
-
4
-
5
-
6
-
7
-
8
-
9
-
10
-
11
-
12
Inspiration
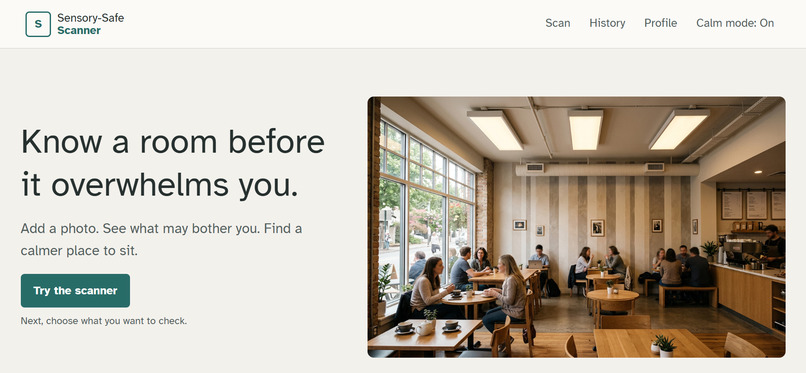
Reviews tell you about the food. Maps tell you the opening hours. Nothing tells you whether a room will overwhelm you.
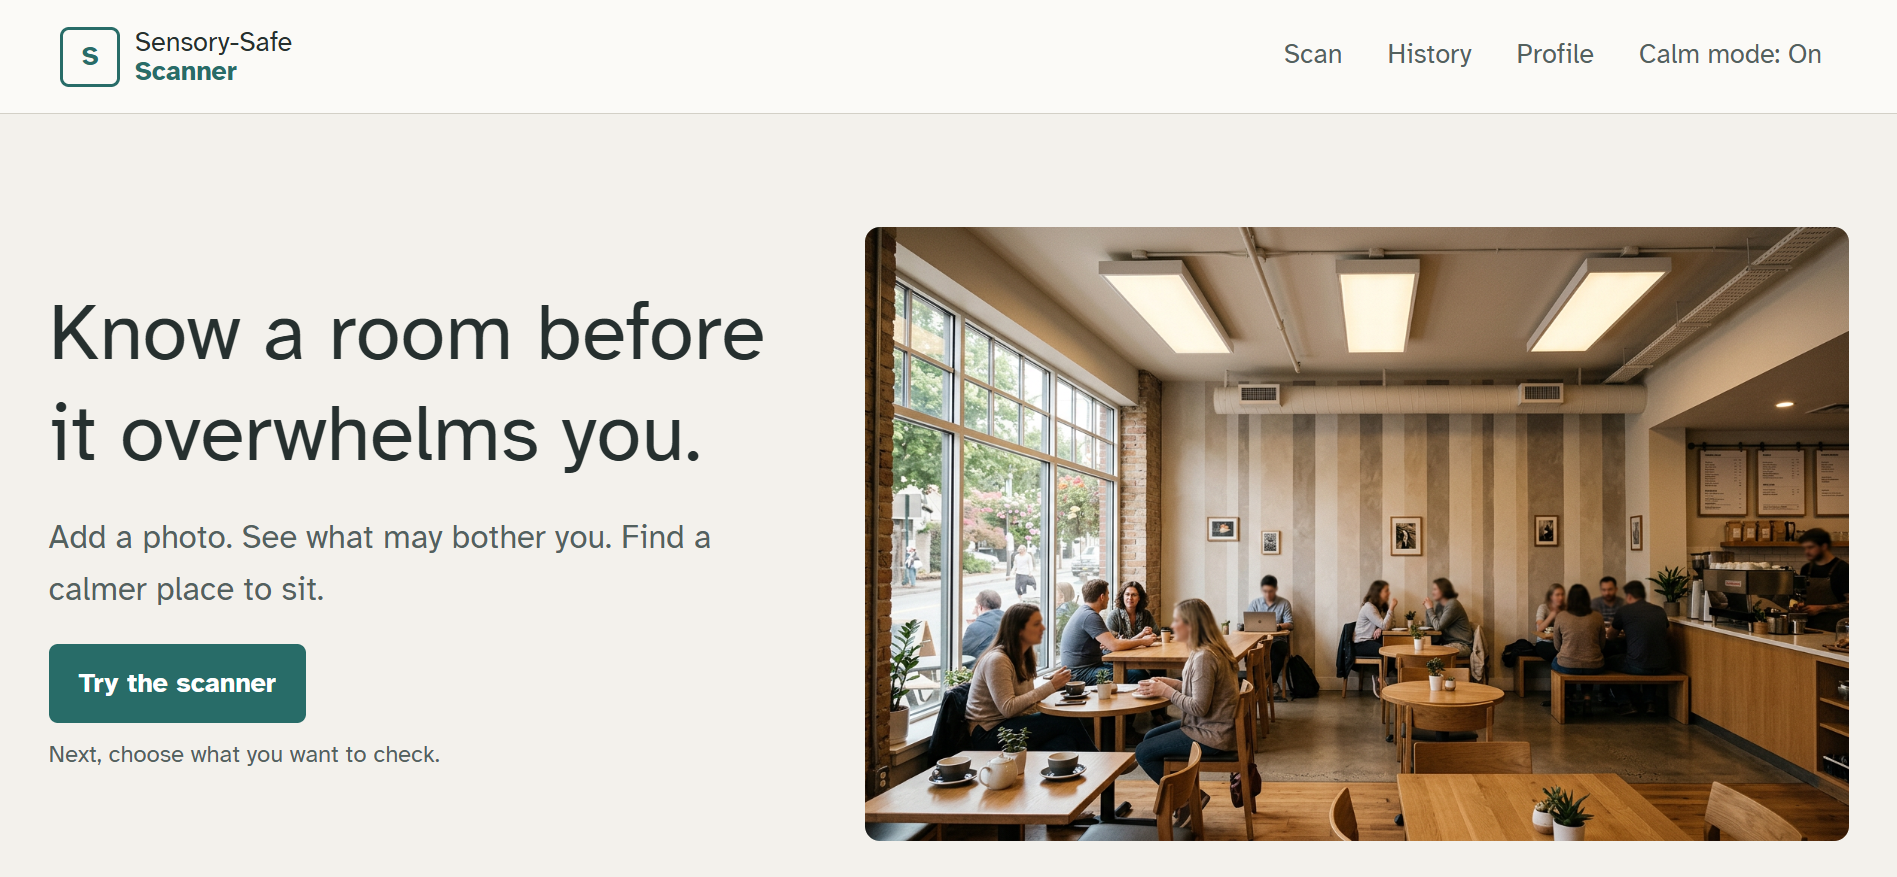
For many autistic and migraine-prone people, harsh ceiling lights, striped walls, clutter, and crowds can turn an ordinary cafe or waiting room into something painful. Most people only find out after they walk in, and then they leave, get sick, or stop going out. We wanted a way to check a room before stepping inside.
Brainstorming
We didn’t start here. Our first idea was a sign language translator, which is a hard problem, since reliably reading real sign language is still unsolved. We then explored a crowdsourced sensory map and a study-spot finder, but both fail on day one because an empty map is useless until people fill it.
Image AI solved that problem. A single photo can be analyzed on the spot, so the app is useful from the first scan with no community and no database. That’s how we landed on Sensory-Safe.
What it does
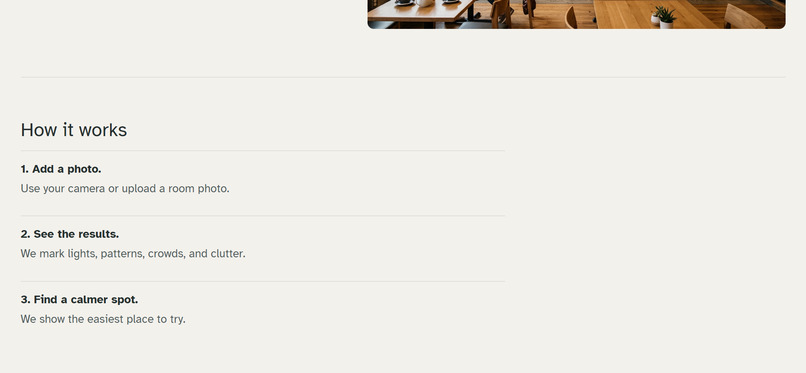
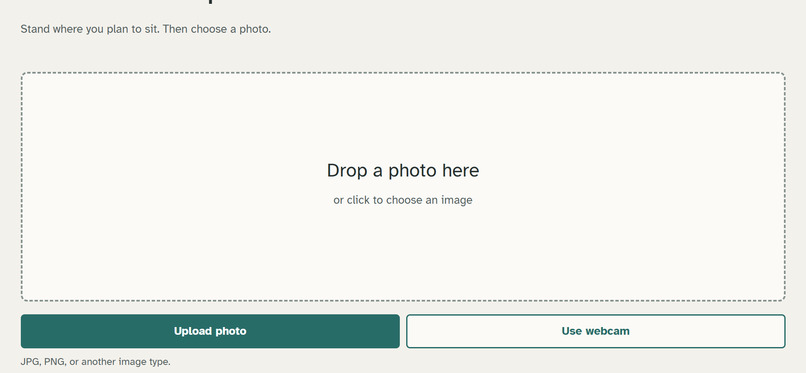
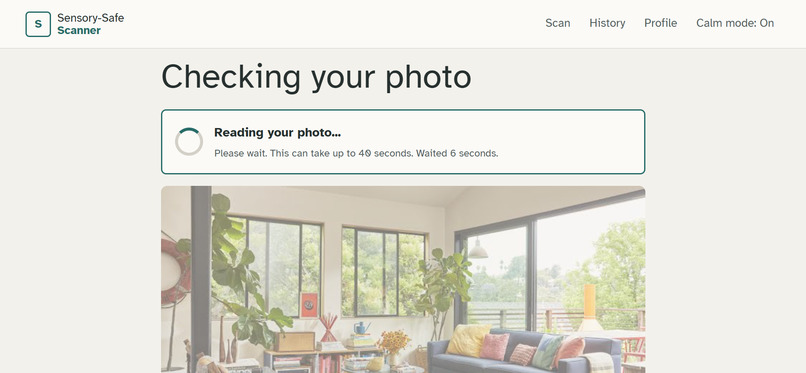
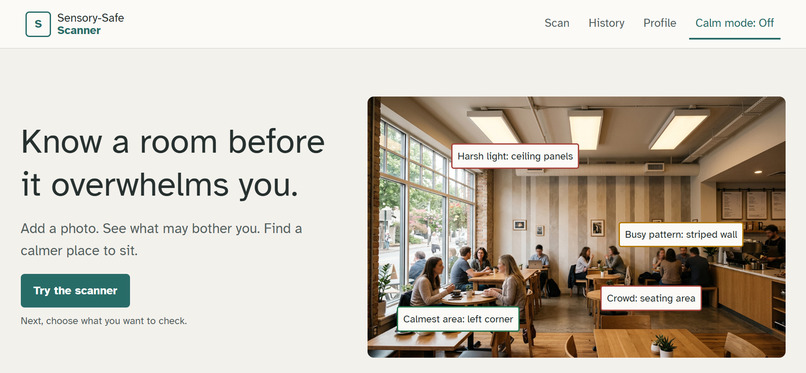
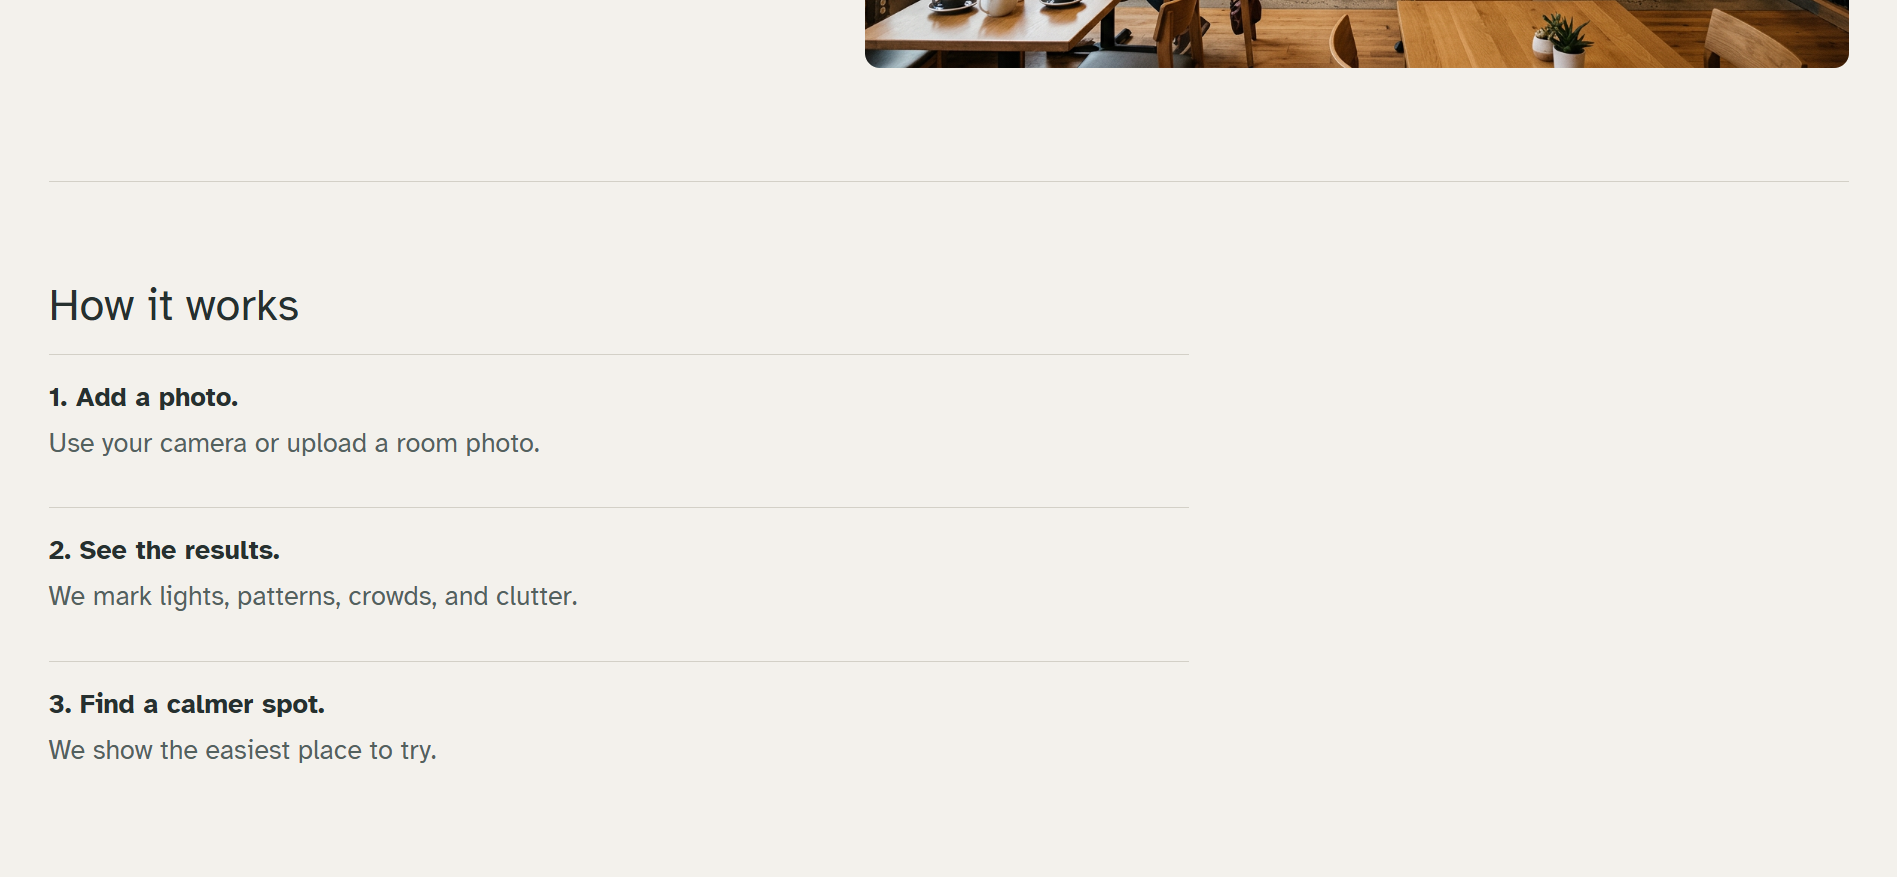
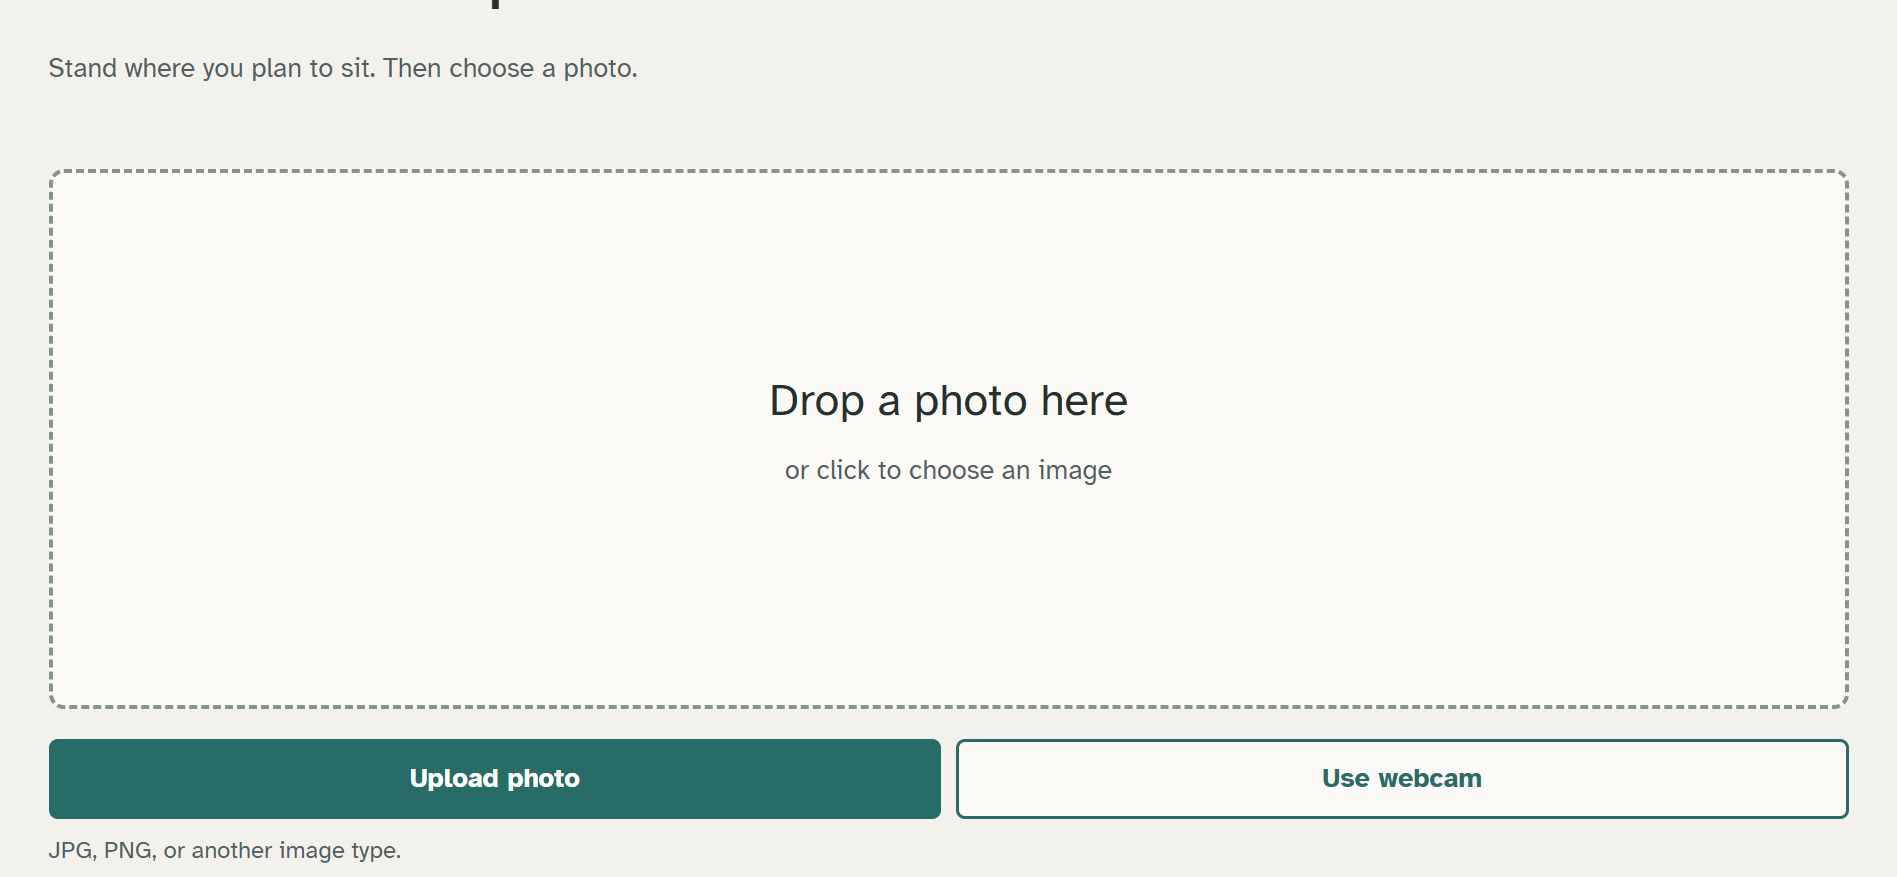
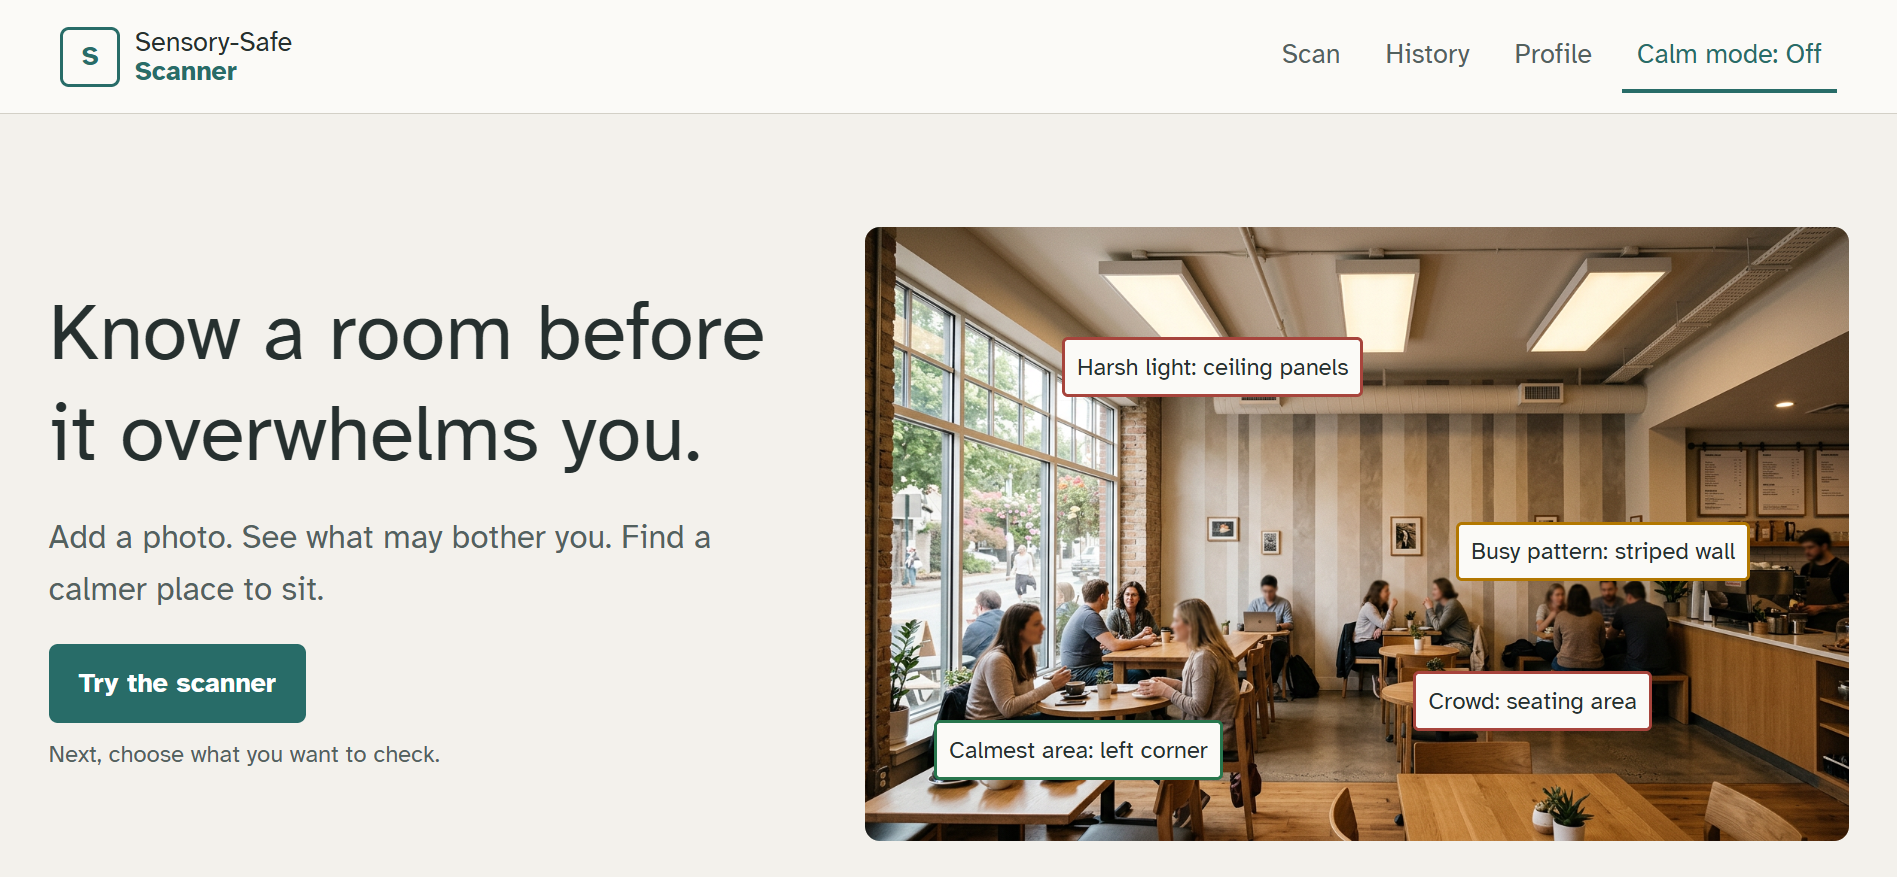
You upload a photo or capture one with your webcam, and Sensory-Safe checks it for sensory triggers:
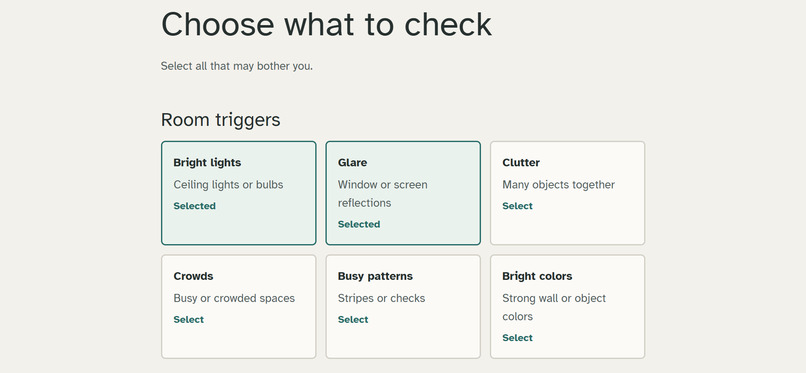
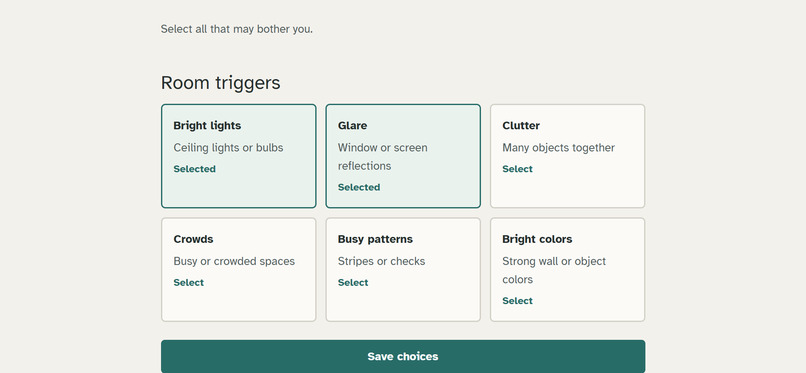
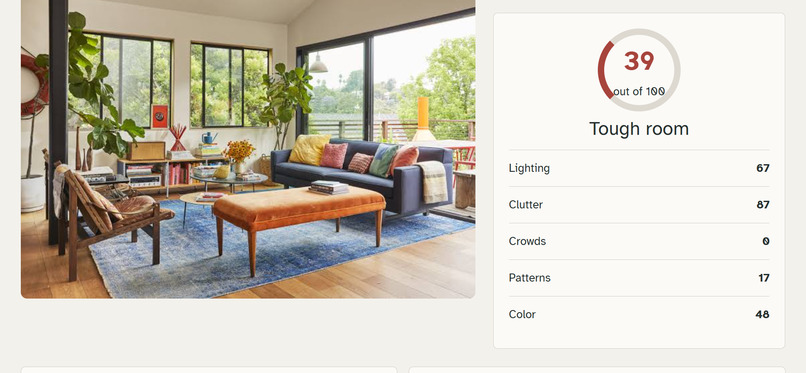
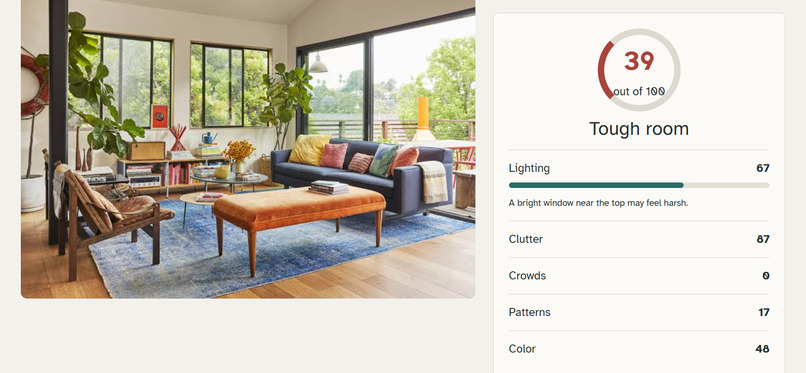
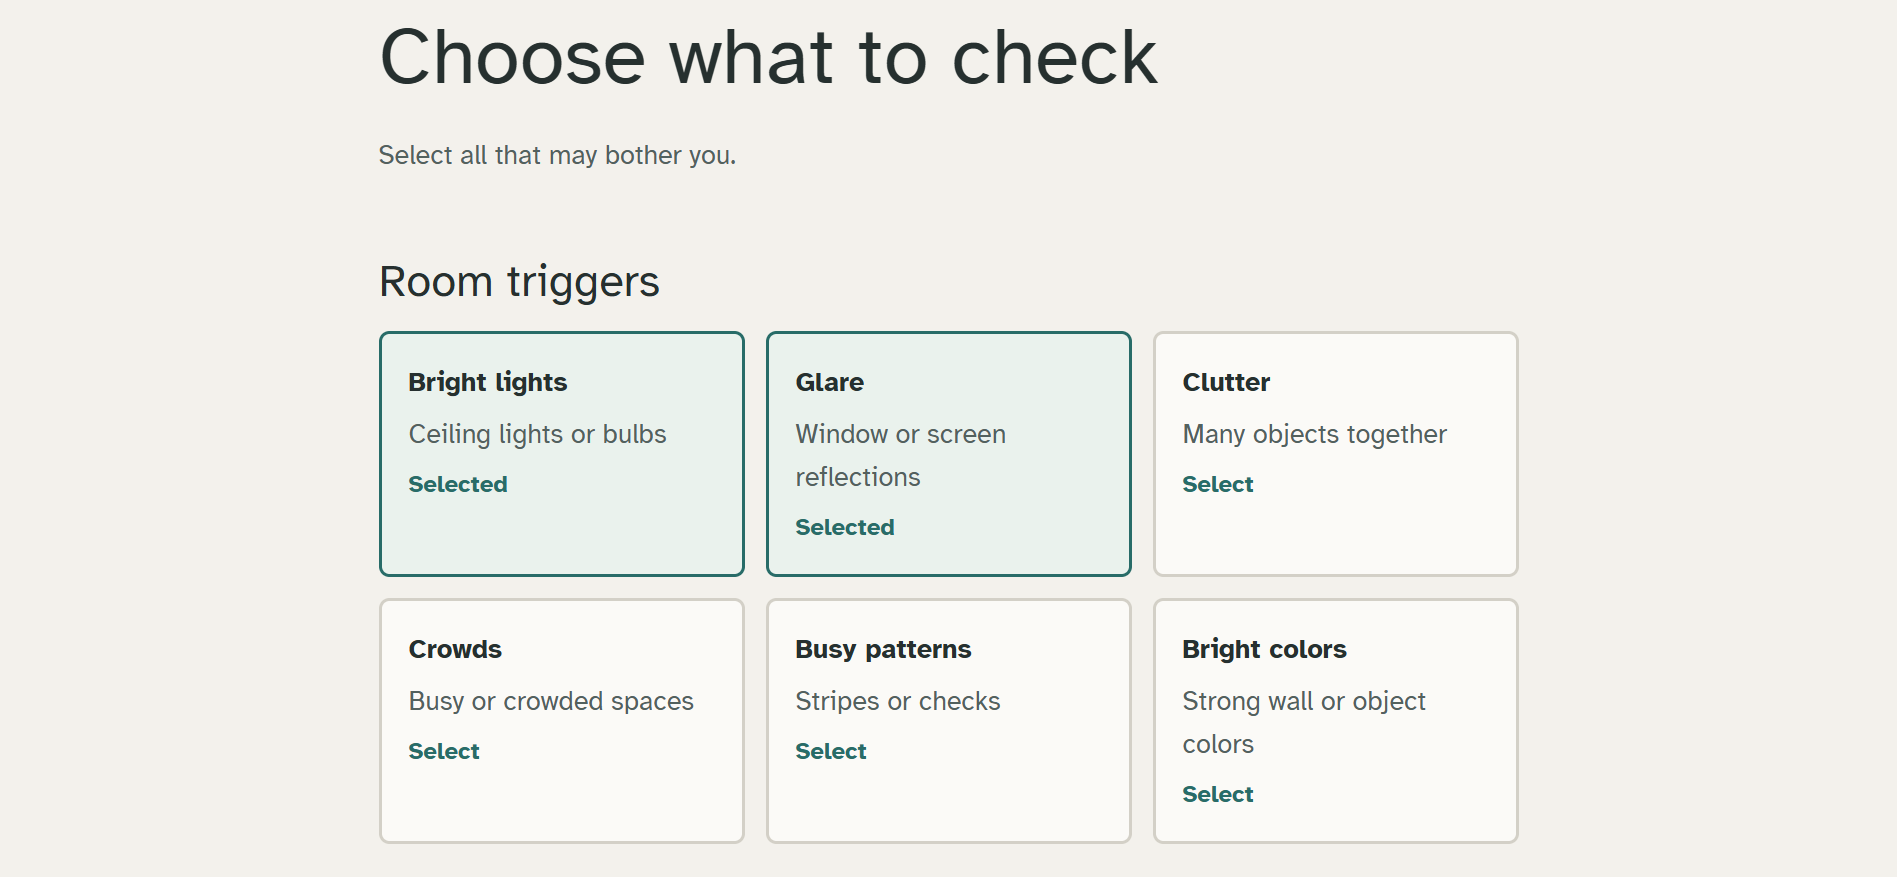
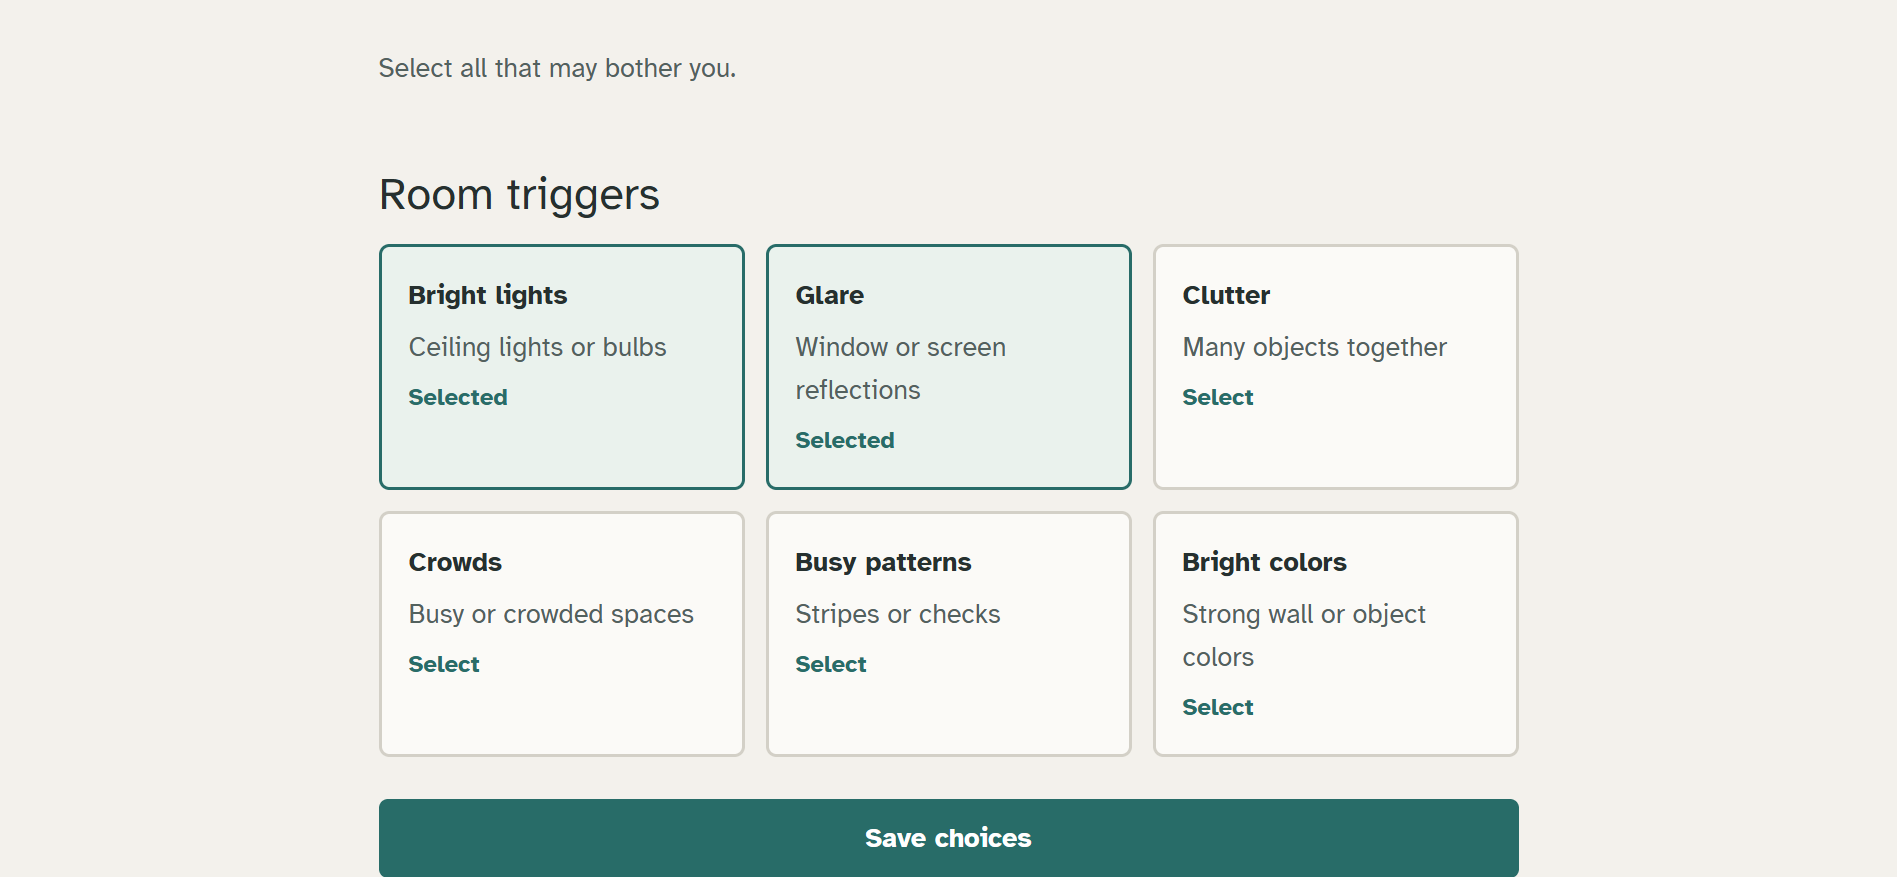
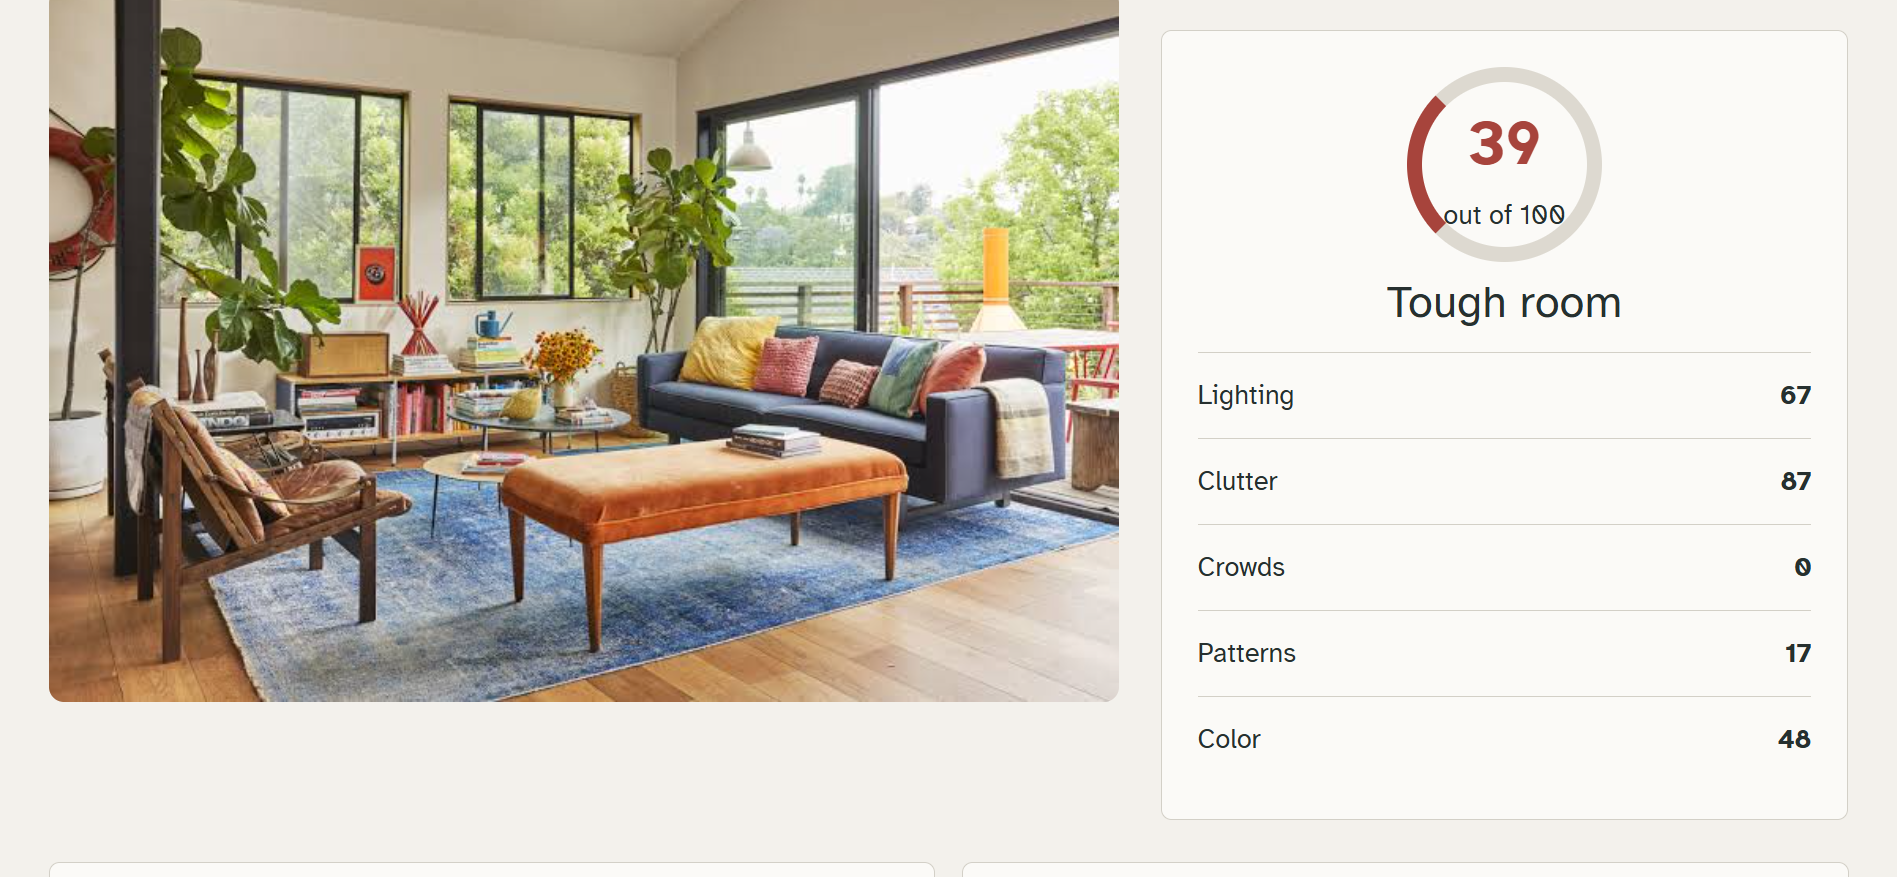
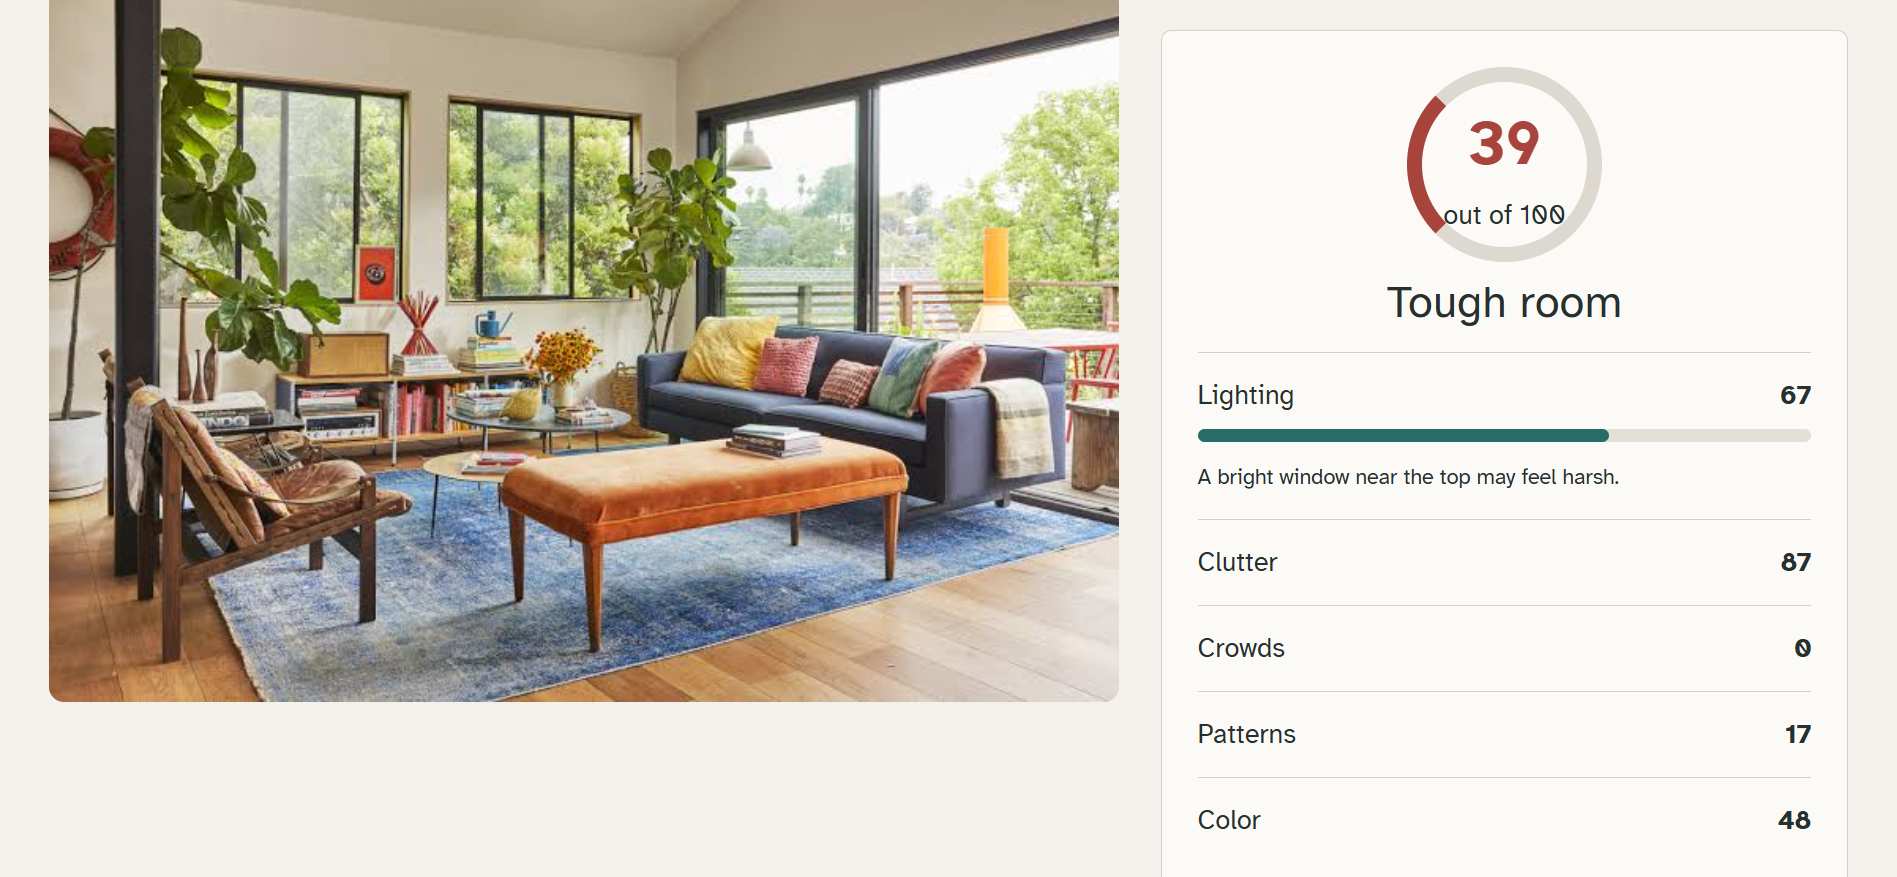
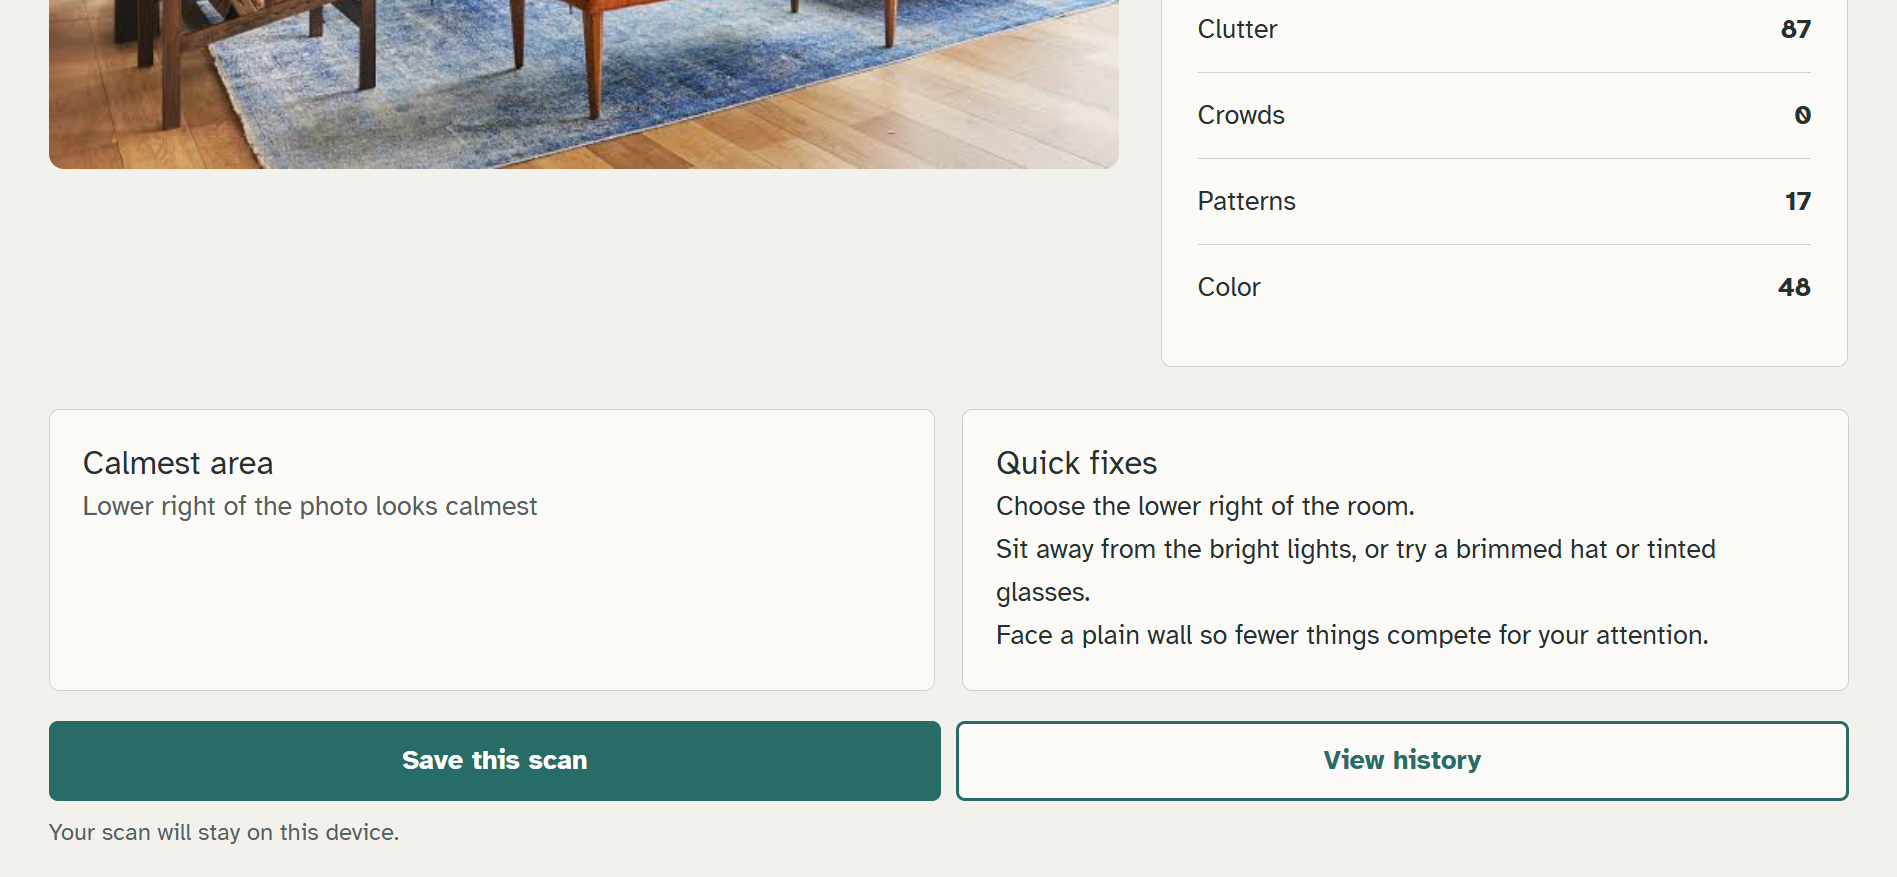
Lighting: harsh overhead lights, glare, and bright windows Clutter: how visually busy the scene is Patterns: stripes, checks, and busy prints, a known migraine trigger Color: very saturated or high-contrast areas Crowds: how many people are in view
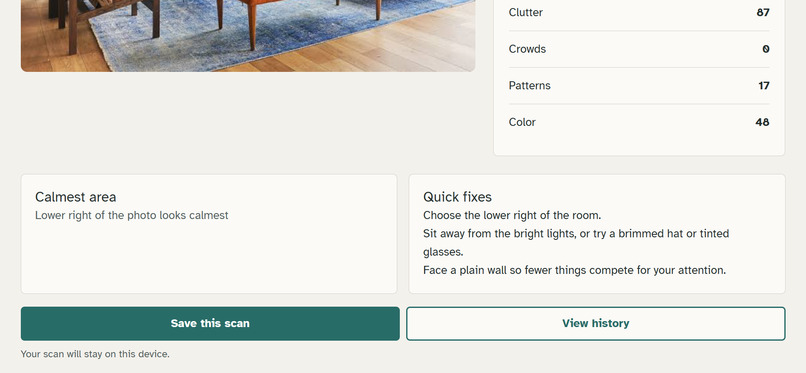
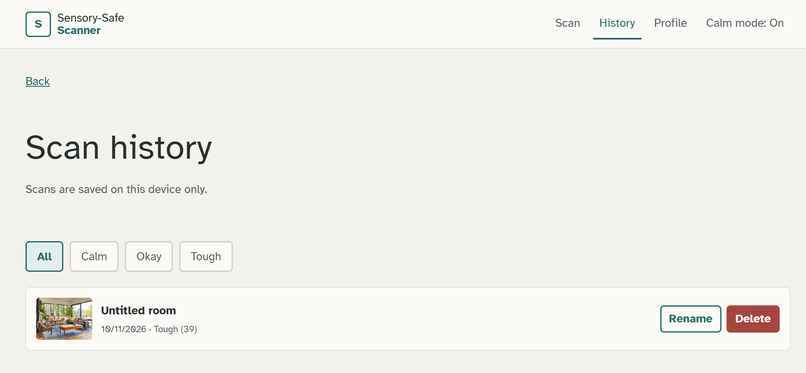
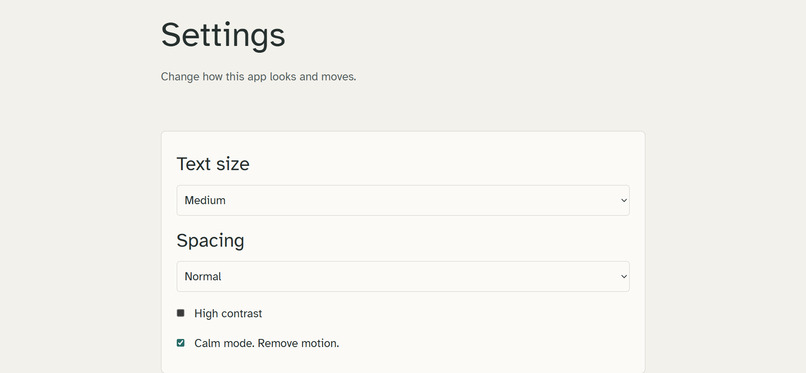
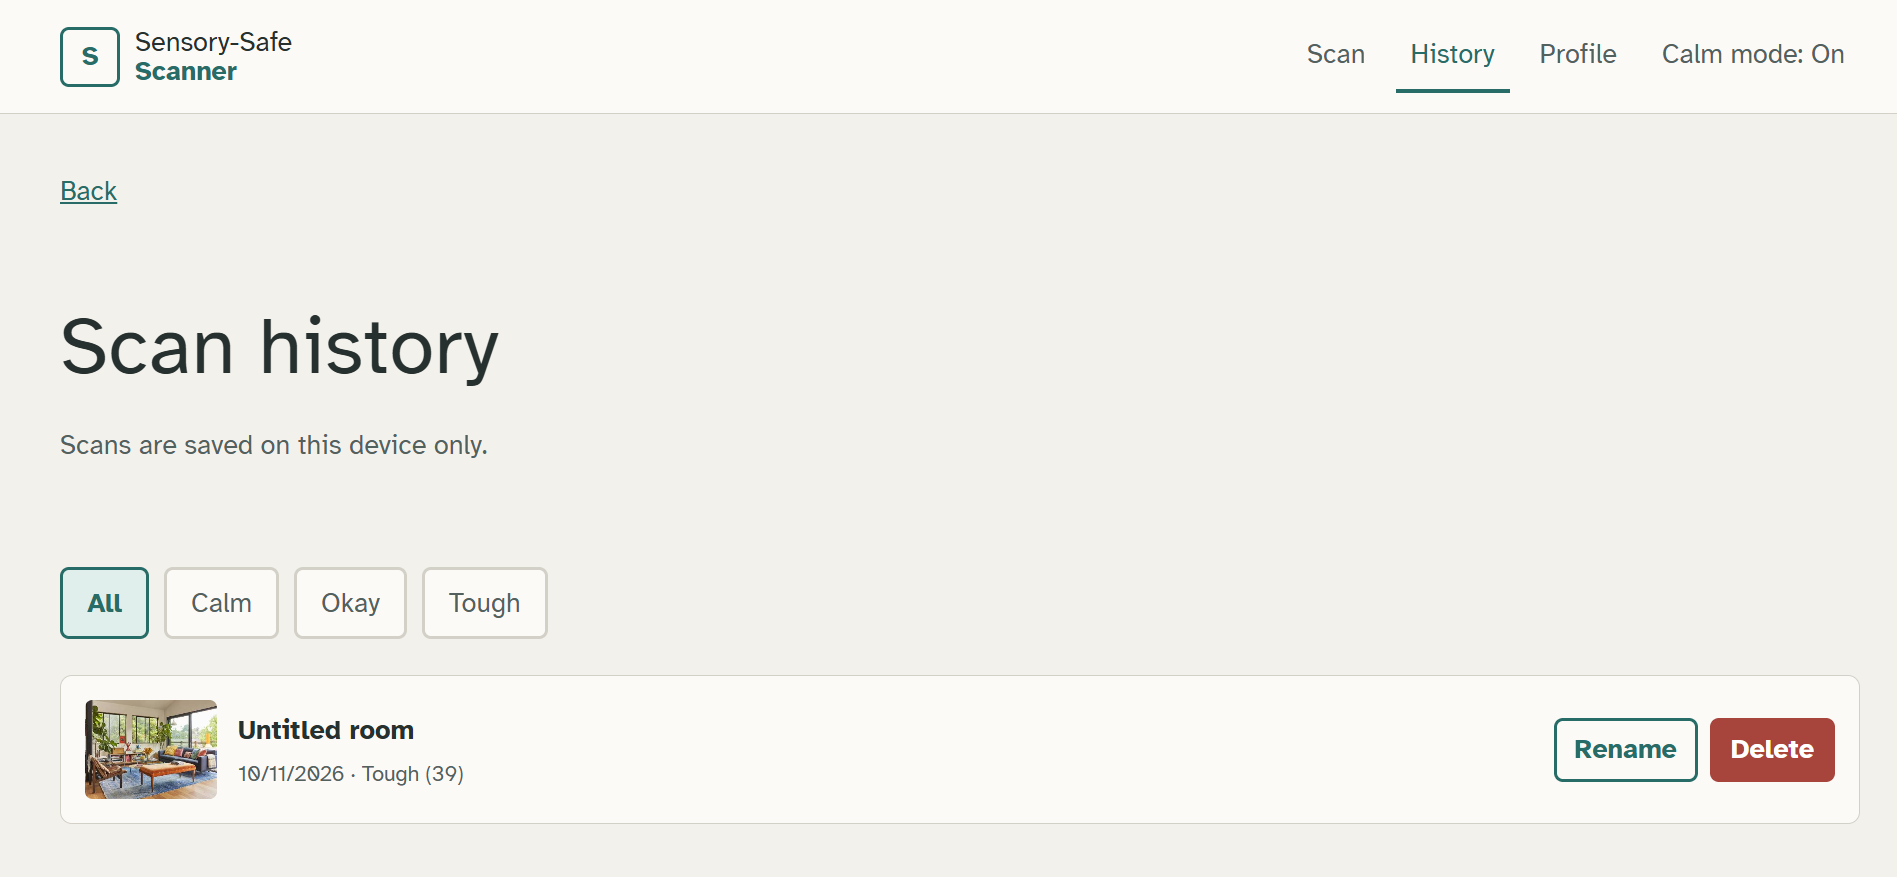
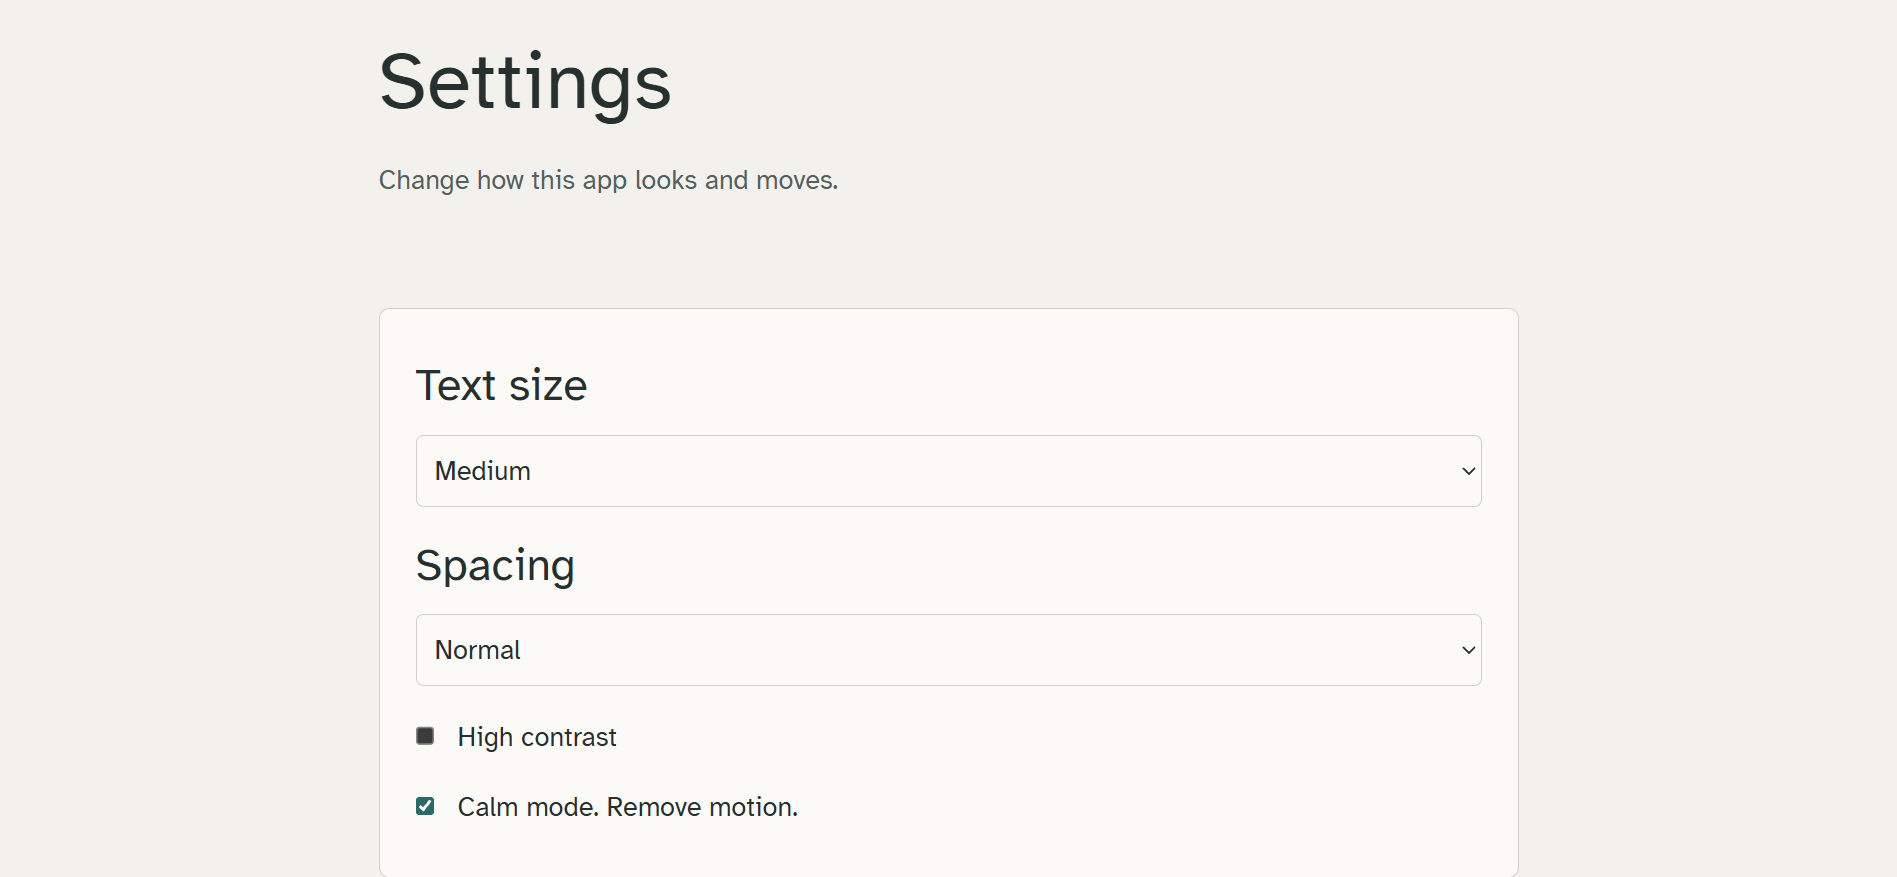
You get a Calm Score from 0 to 100, outlines on the photo showing where each problem is, the calmest area of the room, and a few plain-language quick fixes. You choose which triggers bother you, and the score weights those more. Scan history, text size, spacing, high contrast, and a Calm mode that removes motion are all built in.
How we built it
Front-End Tech Stack Framework: Next.js (utilizing the App Router with files like app/page.tsx and app/layout.tsx)
Library: React
Language: TypeScript
Styling: Tailwind CSS (alongside custom styles in app/globals.css supporting high contrast, multiple text sizes, wide spacing, and a motion-reduced "Calm mode")
Client-Side Storage: Browser-native IndexedDB and localStorage (via lib/history.ts) for saving scan history, thumbnails, and user preferences locally without requiring external user accounts.
Back-End Tech Stack Runtime Environment: Node.js
Framework: Express.js (server.js) providing API endpoints such as POST /api/analyze and GET /api/health
Image Processing & Heuristics: sharp library for fast in-memory image decoding, resizing, rotation normalization, and grid-based edge/color saturation statistics (imageStats.js, factors.js, score.js)
Vision & AI Model: Google Gemini API (vision.js) integrated via structured prompts and JSON schemas to identify light sources, patterns, and people bounding boxes (Crowds factor)
Front end on Vercel, backend on Render.
Testing: Automated test framework running unit and end-to-end tests (test/analyze.test.js)
How It Works
Our analysis engine processes images completely in-memory using a multi-stage pipeline combining algorithmic image processing heuristics with vision models:
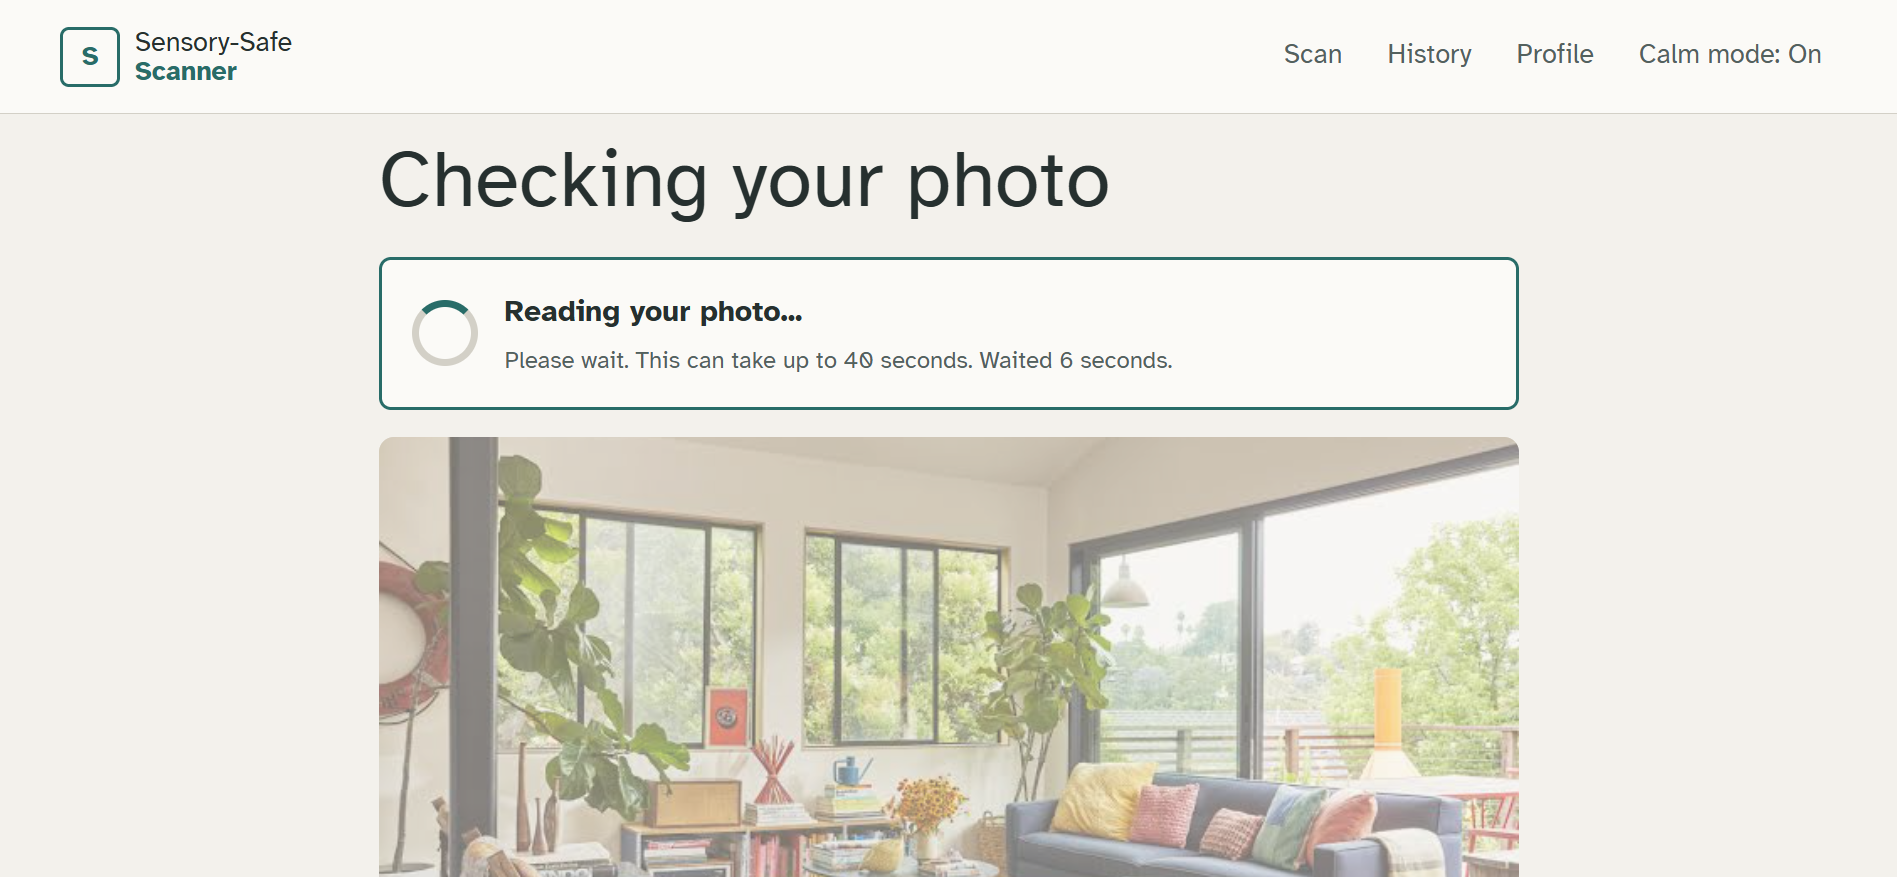
Image Preprocessing: Web-captured frames and image uploads are normalized and standardized in-memory using the sharp library to adjust dimensions and correct rotation before analytics run.
Lighting Analysis: Measures overexposed (blown-out) pixel clusters and bright regions across an adaptive grid to detect glare and harsh overhead light sources.
Clutter Detection: Evaluates edge density algorithms to map visual busyness and quantify spatial chaotic structures.
Pattern Recognition: Utilizes sliding-block autocorrelation algorithms to detect repeating migraine-triggering patterns (such as high-contrast stripes, checks, and dense prints).
Color Saturation & Contrast Evaluation: Calculates pixel saturation distribution and extreme local contrast variations across color spaces.
Crowd & Person Detection: Integrates the Google Gemini vision model with structured JSON schema outputs to obtain precise bounding boxes and evaluate crowd density when active.
Personalized Scoring Engine: Aggregates individual heuristic outputs into a normalized Calm Score (0 to 100), applying a 3x heavier weight multiplier to user-selected personal triggers while locating the optimal calm zone.
Client-Side Privacy Persistence: Saves local scan histories, generated thumbnails, and display accessibility preferences using browser-native IndexedDB and localStorage with zero external database dependencies.
Scoring & Privacy
Calm Score: Combines all factors, giving your personalized trigger selections 3x the weight. It also identifies and highlights the "calmest area" in the photo.
Privacy First: There are no user accounts and no server database. All scan history and settings are stored locally in your browser using IndexedDB and localStorage.
Design Process
Our users are people sensitive to sensory overload, so the interface can’t cause it. We removed gradients, glow, animation, emojis, and decoration. We used Atkinson Hyperlegible, large tap targets, plain short sentences, keyboard navigation, and text labels on every icon and photo overlay. We followed cognitive accessibility guidance: one task per screen, the same navigation on every page, clear confirmations and error messages, and user-controlled text size, spacing, and contrast.
Resources
Tech Stack: Next.js, React, TypeScript, Tailwind CSS, shadcn/ui, Express, sharp, multer, Google Gemini API, IndexedDB.
Guides & References
Web Content Accessibility Guidelines (WCAG 2.2) for cognitive accessibility and text scaling; standard color contrast and typography principles for low-sensory design.
Challenges We Ran Into
Incomplete sensory capture: A photo can’t show everything. It can’t capture sound, smell, or light flicker.
Subjective scoring: Two people can react very differently to the same room, so the result depends entirely on the specific triggers each user selects.
Heuristic calibration: Thresholds for glare, patterns, and clutter were tested on a small set of photos, meaning scores serve as estimates rather than absolute rules. (Example: Early tests flagged uniform white ceiling tiles as heavy "patterns," so we adjusted the edge-density and frequency checks to separate actual high-contrast stripes from flat architectural planes.)
Decoupled architecture: We had to ensure every screen read from a single, shared result format so the backend analysis engine could be swapped or updated without redesigning the front-end components.
Accomplishments We’re Proud Of
Coherent design execution: Building an interface that strictly follows its own advice—calm, plain, and fully customizable.
Actionable feedback: Providing breakdown results that explain where and why a space feels overwhelming, rather than just spitting out a single opaque number.
Privacy-first: no accounts and no server database. Scan history and settings stay in your browser. Photos are processed in memory and never saved by our server, but they are sent to our backend and to Google's Gemini API for crowd detection.
Positive testing feedback: Initial testing with light- and sensory-sensitive peers showed that the trigger weighting and calmest-area highlights accurately matched real-world discomfort zones.
What We Learned
Design lesson: Accessible design is mostly about taking things away; being transparent about what an AI cannot detect builds far more user trust than guessing.
Technical lesson: Image heuristics require careful normalization (such as standardizing incoming image dimensions via sharp before running edge detection) to ensure pixel-density calculations remain consistent across different camera resolutions.
What’s Next
Short video input to detect light flicker.
Estimated noise level from visual cues, clearly labeled as an estimate.
Side-by-side comparison of two rooms.
Expanded pattern and clutter model testing with autistic, ADHD, and migraine communities.
Shareable reports for caregivers, schools, and workplaces.
Sensory-Safe is a guide, not medical advice.
Built With
- express.js
- google-gemini
- html
- next.js
- node.js
- react
- render
- sharp
- tailwind-css
- typescript
- vercel


Log in or sign up for Devpost to join the conversation.