-
-
Log and view data from external sensors
-
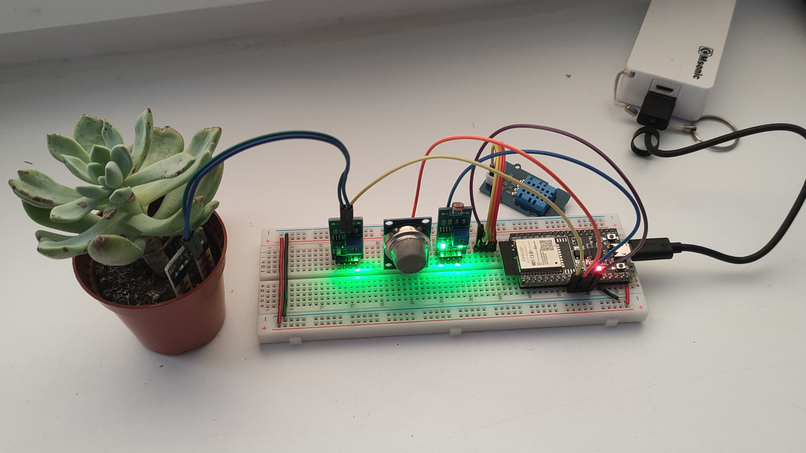
Prototype sensor that measures tempreature, plant soil moisture, light sensitivity, air quality
-
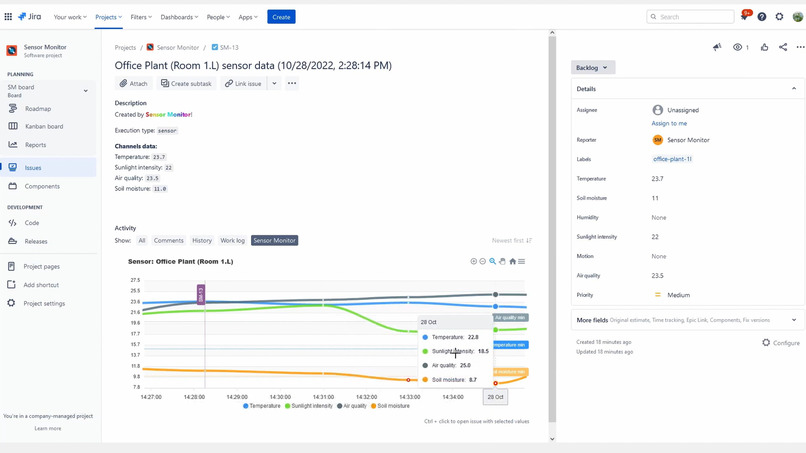
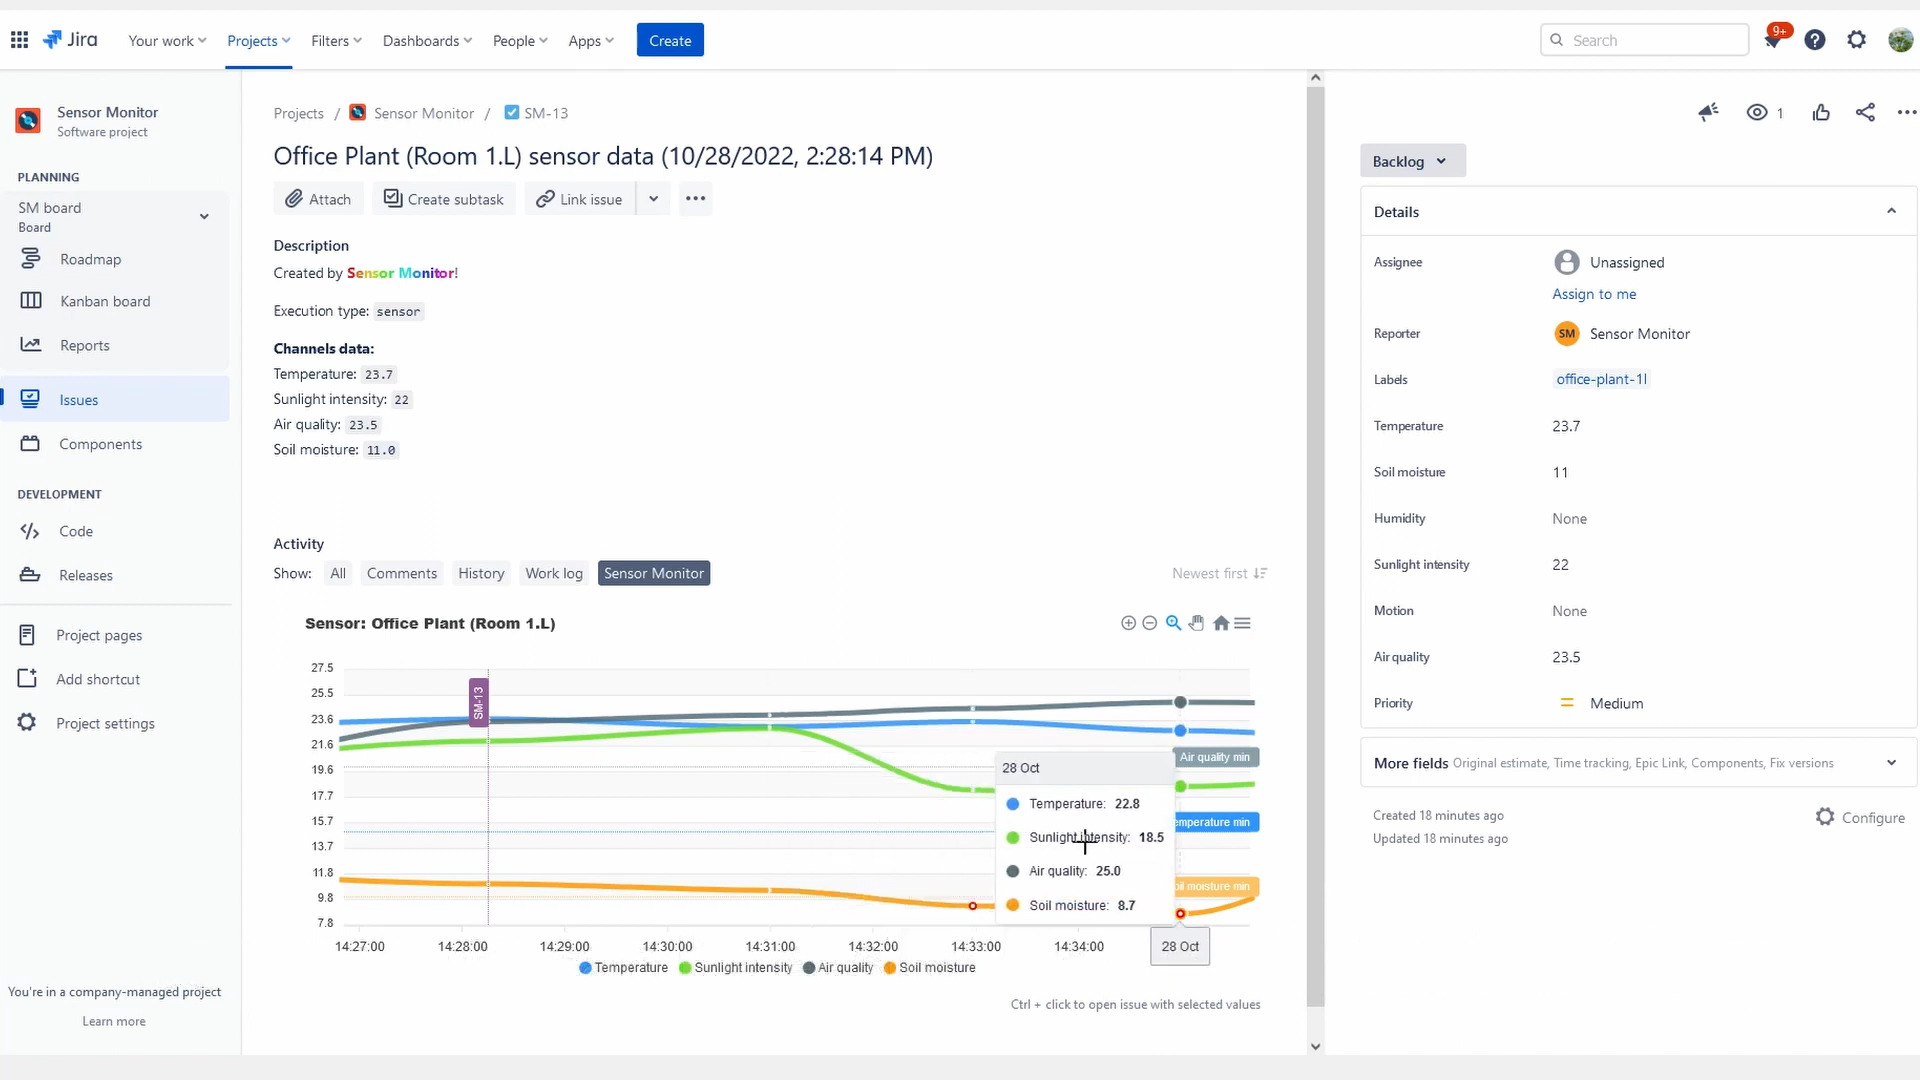
Each data from sensor is stored as issue
-
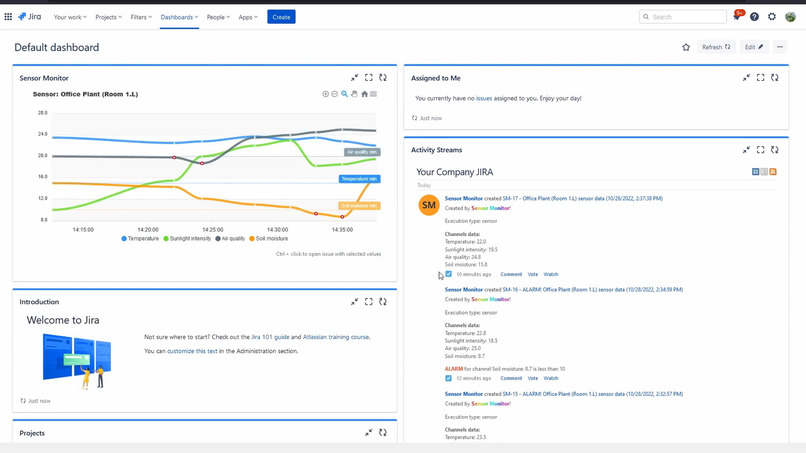
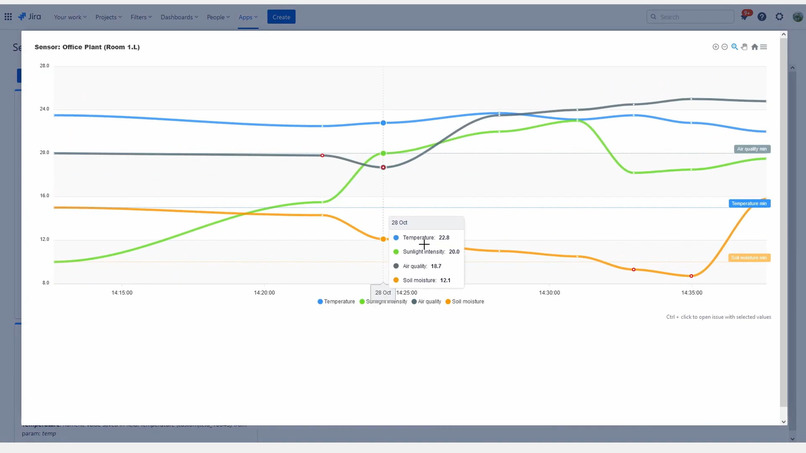
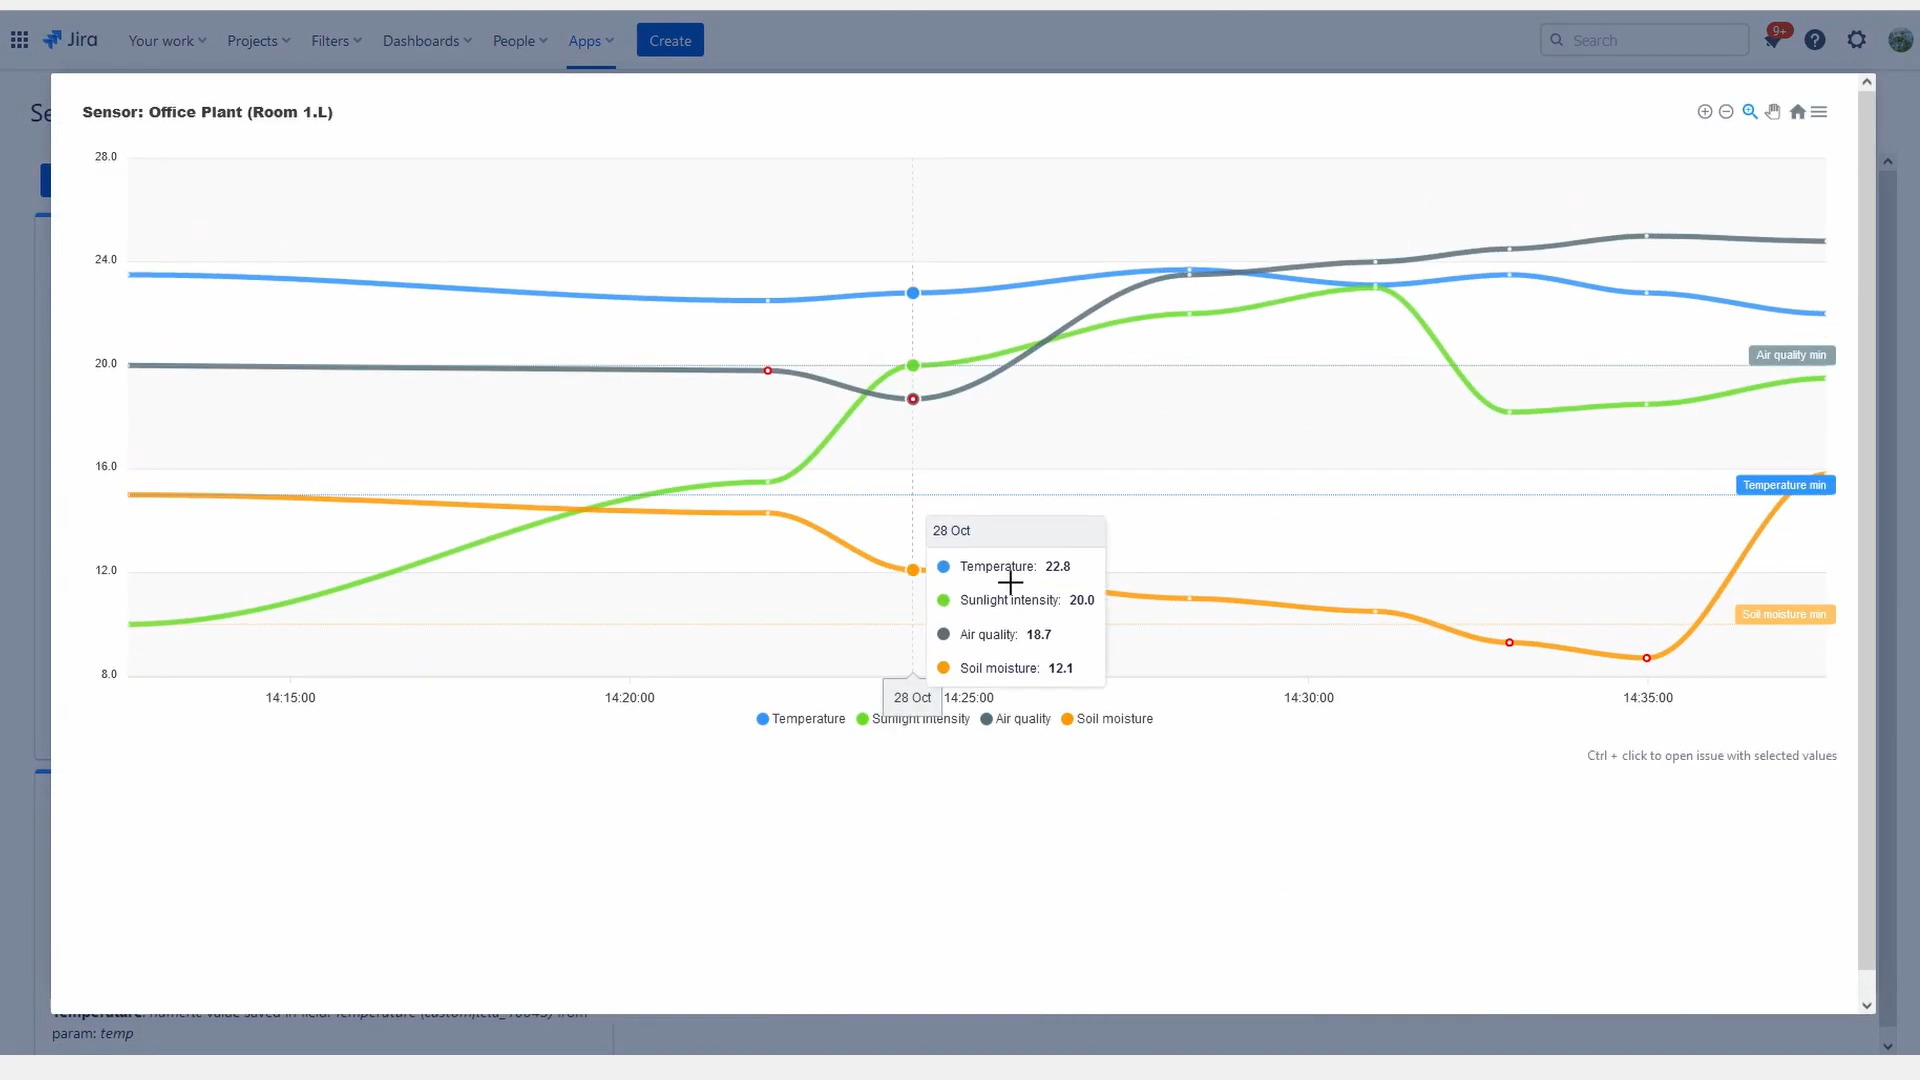
You can display sensor data on dashboard
-
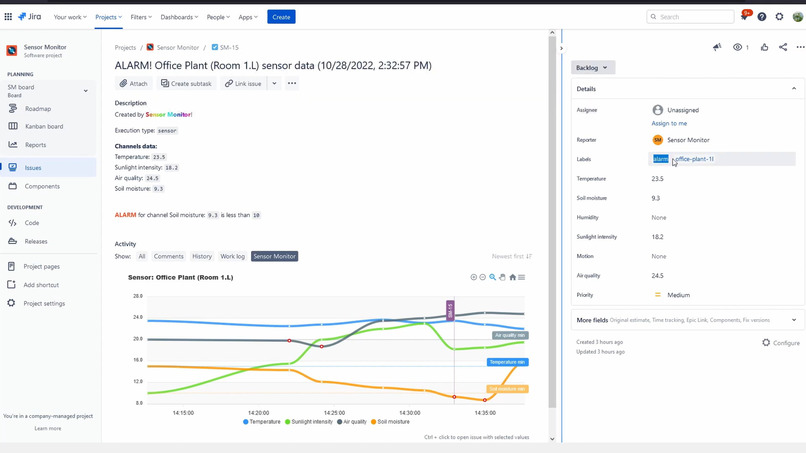
Values that exceeds configured threshold will be labeled with ALARM and annotated with red point on chart
-

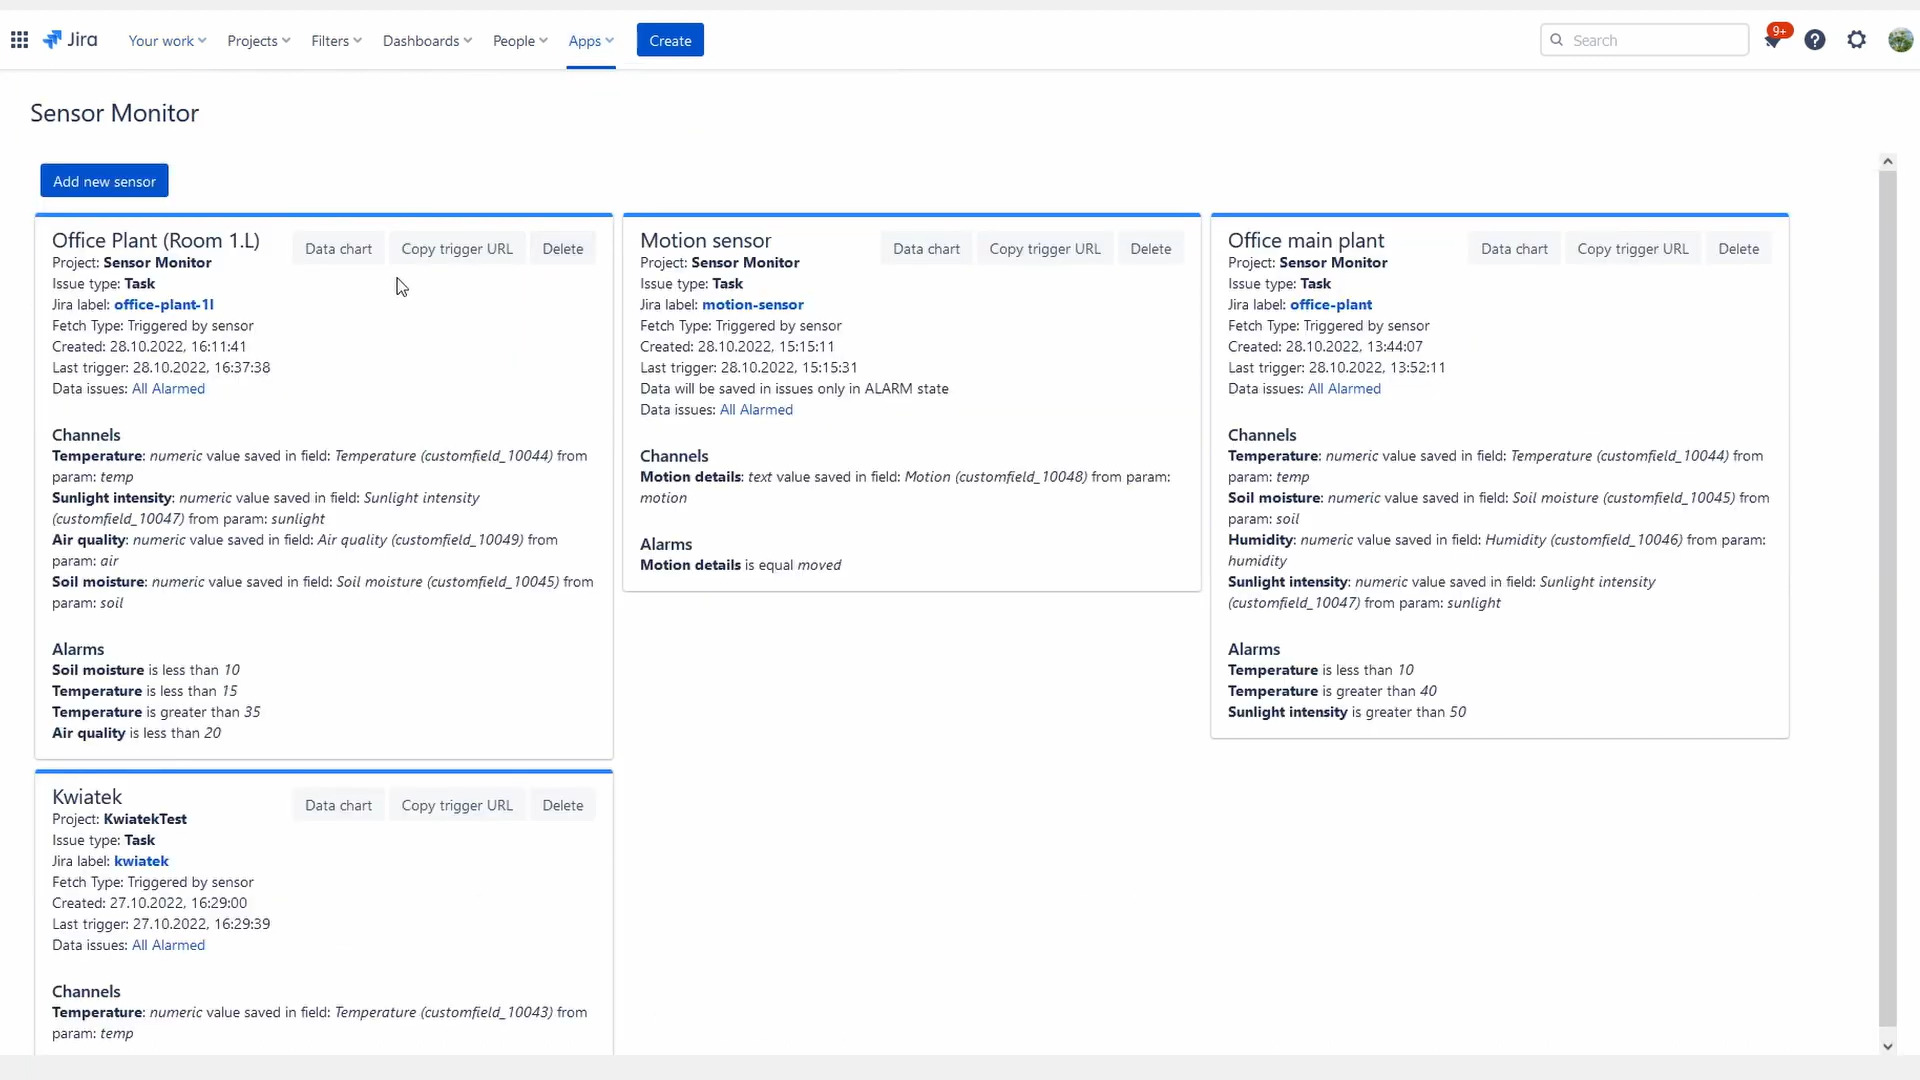
Create multiple sensors - each can contain multiple channels (like temperature, proximity, text value etc.)
-

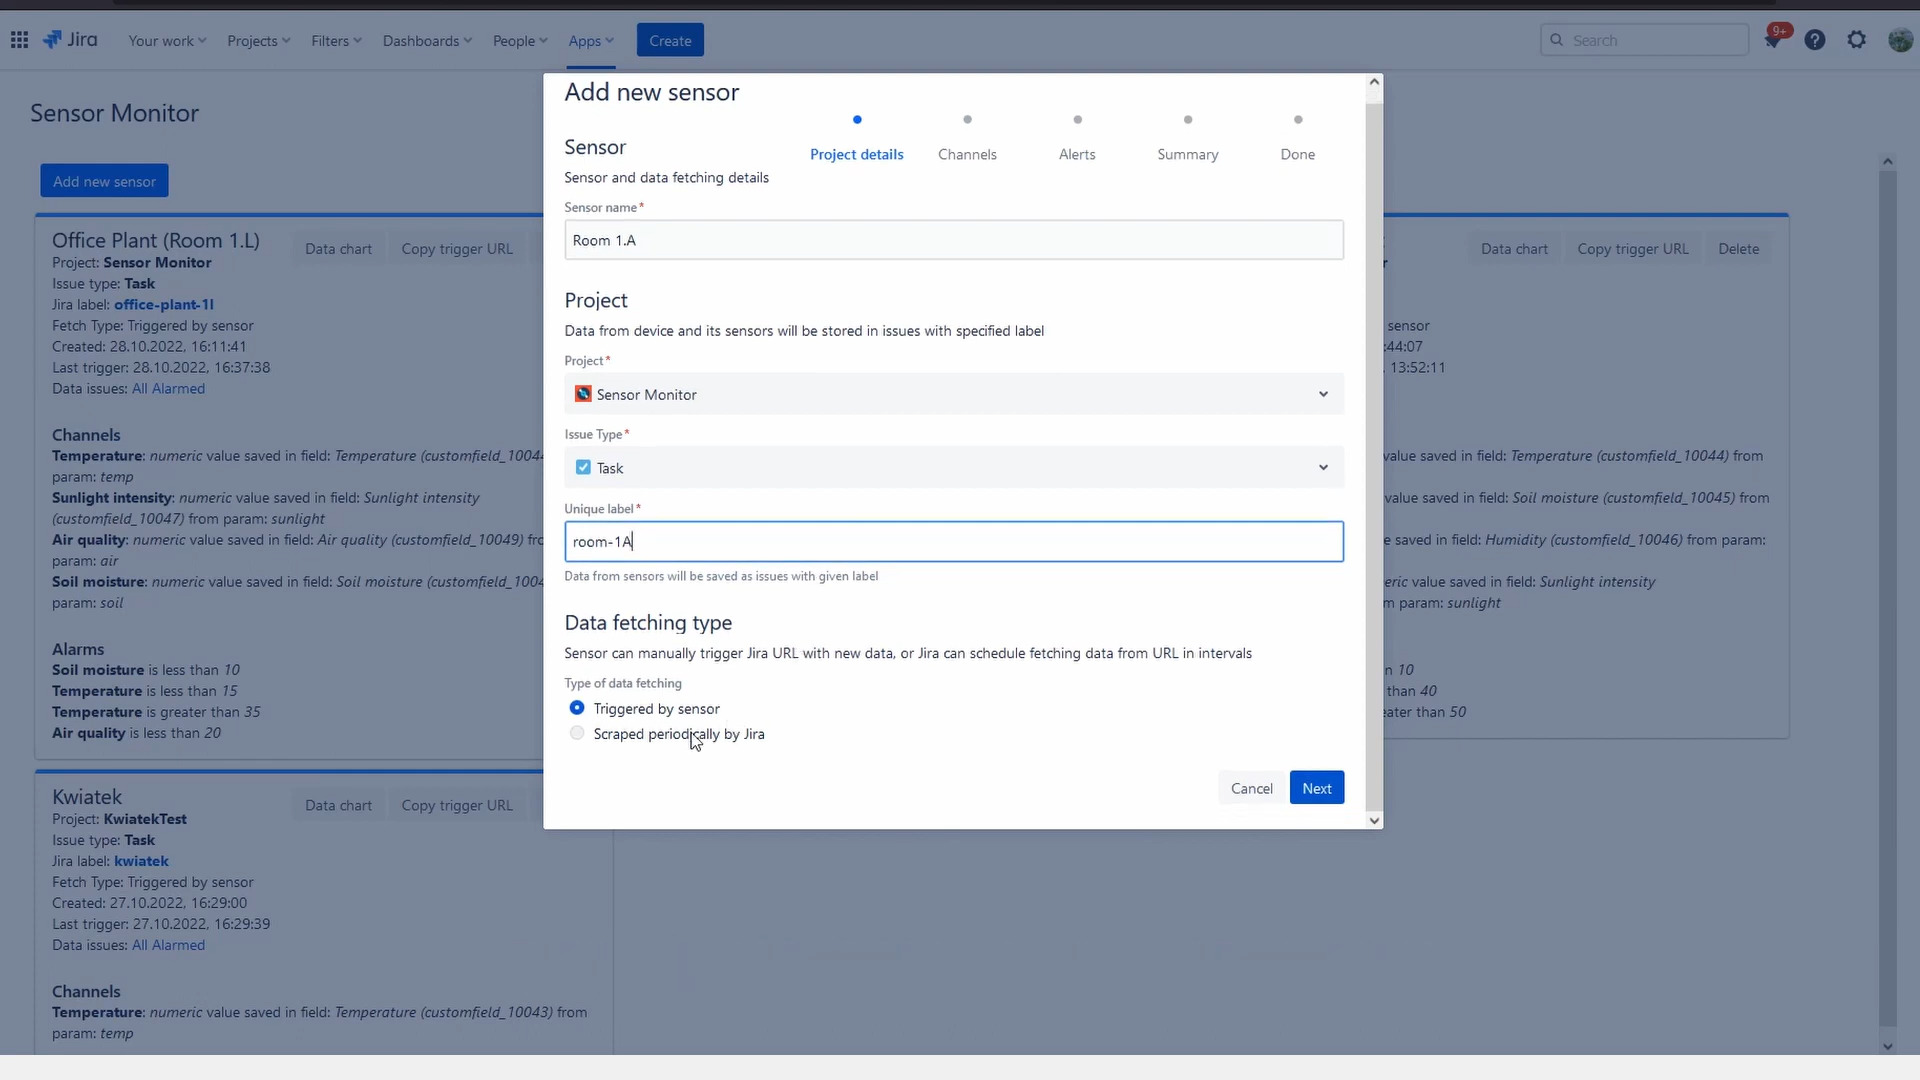
You can configure what project and issue type each sensor will use
-
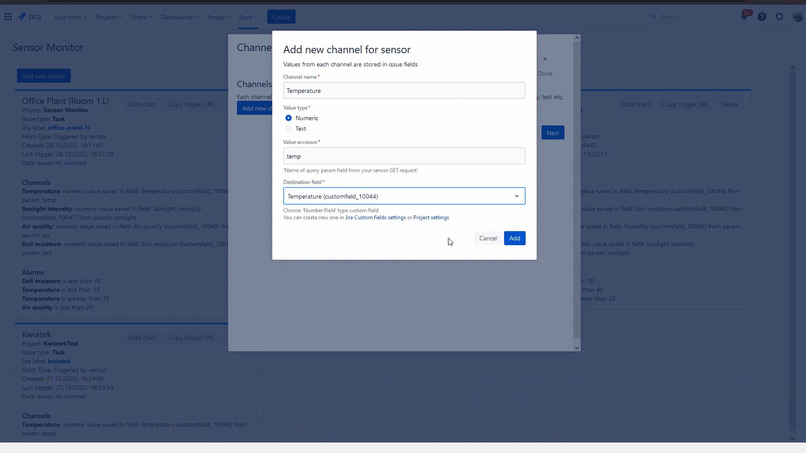
Each configured channel for sensor uses customfield for storing numeric or text data
-
Each channel can have optional thredshold values; you can even configure it to only log data that exceeds those limits!
-
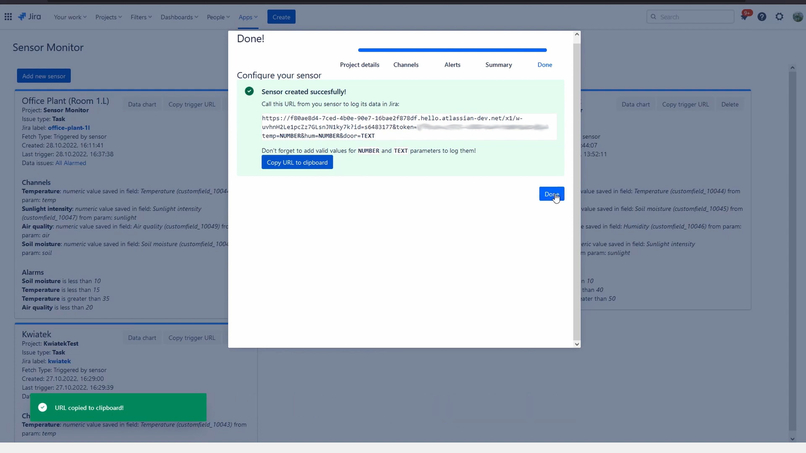
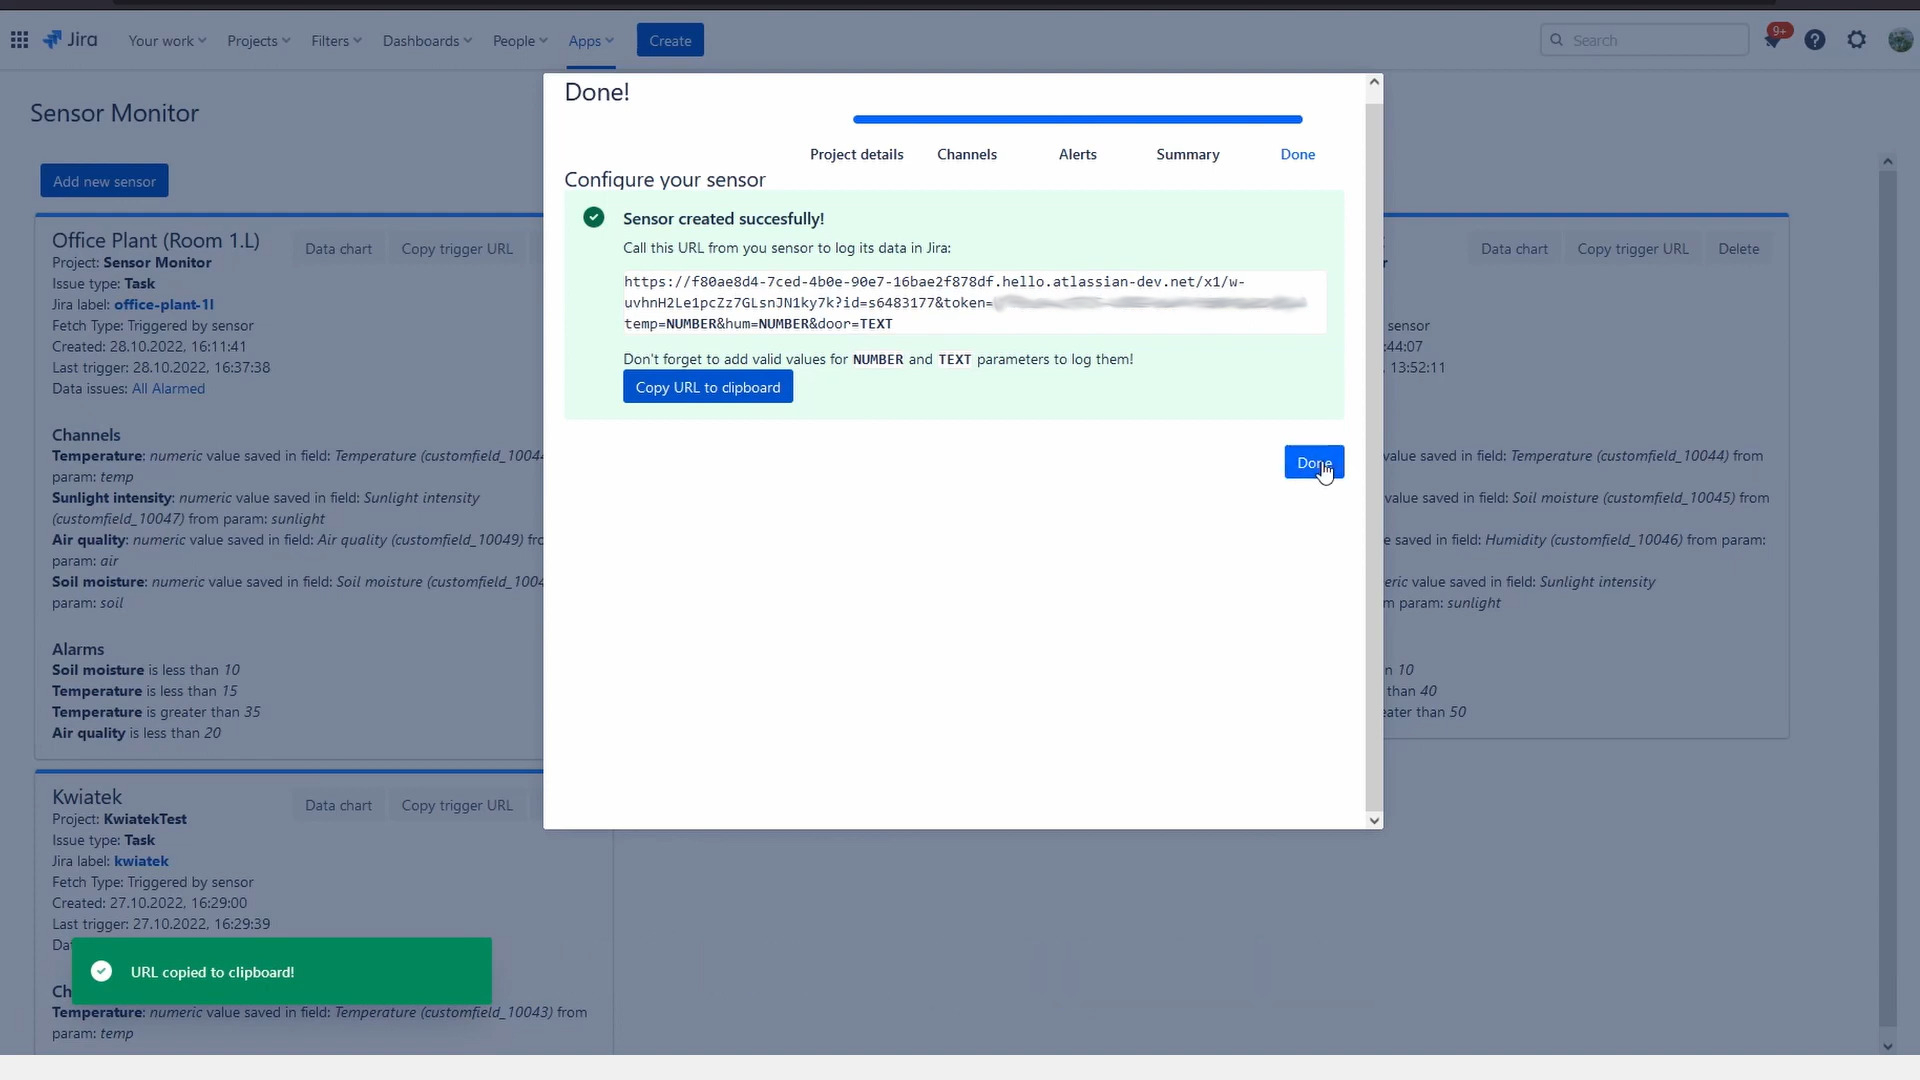
After configuration you will get URL that your sensor should call with standard GET request


Inspiration
The main inspiration for Sensor Monitor was our poor plants that were left in our office when we started working mainly from our homes. They needed some care and monitoring when we were on home office. So now we can care for them using our company Jira and get notification when any of our office plants needs more water!
What it does
It logs data from sensors in your Jira. But it does it in special way: by saving it in individual issues! But how that data is transferred to Jira? It's simple - by using Forge webtrigger and scheduler functionality! Sensor Monitor generates URL address which external microcontroller/computer with connected sensors can send HTTPS GET request with configured parameters like temperature, humidity etc.
Sensors
Sensor Monitor stores configuration data in entities called Sensors. Sensor stores its data in issues configured Project and Issue type. You can add unique label to sensor so Sensor Monitor and Jira will be able to find issues for this sensor. Each sensor can be configured to fetch data from external sensor in one of two ways.
Obtaining data from sensor
There are two ways of getting data from external sensor:
- by executing Jira webtrigger from sensor:
In this case Sensor Monitor will generate URL for you, and your job will be add that URL to your sensor so it will request using HTTPS GET method. So basically it's like visiting webpage, but from your microcontroller/computer. It can be something like this:
https://some-long-id.hello.atlassian-dev.net/x1/w-otheratlassianmagic?id=s12345&token=s3ns0r-1d&temp=22.5&hum=12&details=ok
You just need to request that address with values from your sensors and those values will be saved in custom fields of newly created issue.
- by scheduling scrapping data periodically from Jira to destination URL:
In this case Jira will periodically (every day or hour) read body data from given URL and extract values from it. To extract data from body you can use regular expressions. Regexp is powerful tool that can extract data in many ways from HTML, JSON, XML or any other text data, but it can be quite challenging to write proper regexp. For now I've mitigated that by providing link to external website with regexp parser and a lot of example regexps, so user will be able to test it there. In this type of data fetching you can use Sensor Monitor to:
- call sensor URL to get data directly from it
- call URL of hosting that sensor stores its data
- call any other external website/API to get any data from it
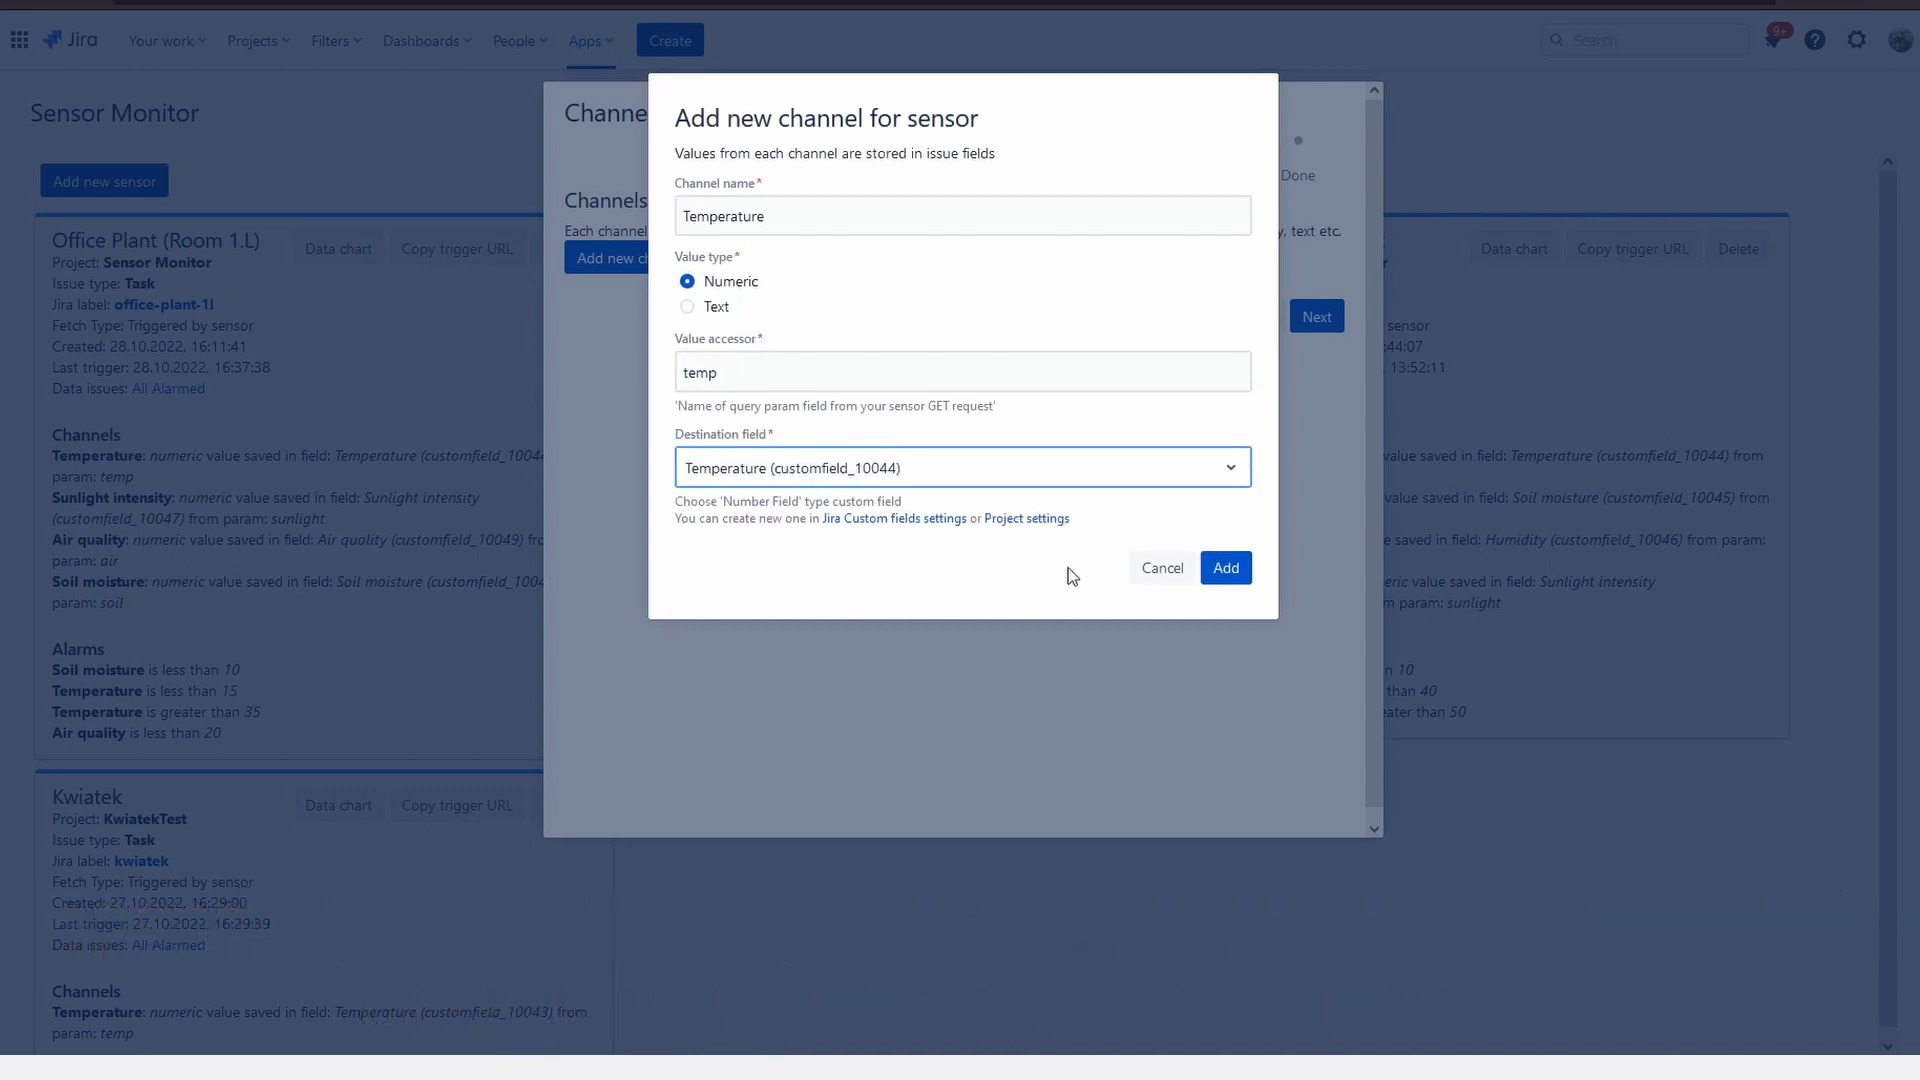
Channels
Every sensor can have one or more channel. Channel is just type of variable, like temperature, humidity, sensitivity etc. that will be stored in selected custom field. Currently there are two types of channels:
- numeric: stores integer or float data, like: 10, 22.5, 30.12, etc. You need to create Number customfield in Jira to store this type of data
- text: stores string data, like: ok, opened, closed, etc. You need to create Short text customfield_ in Jira to store this type of data
Alarms
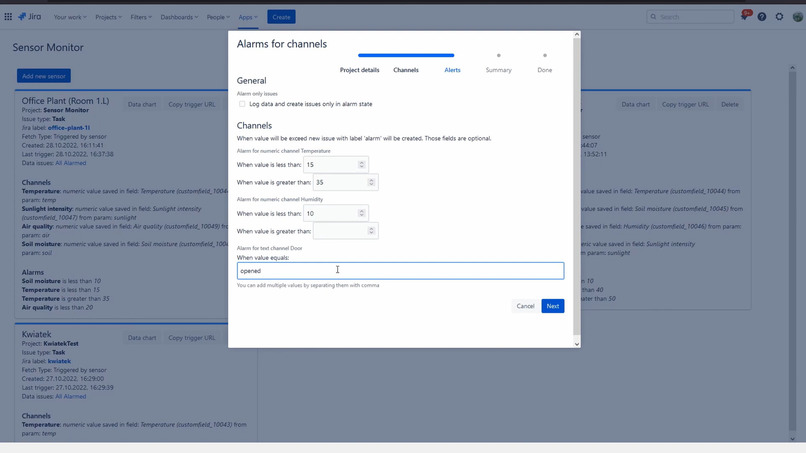
Each channel can be configured with range values that will trigger alarm when will be exceeded. Each type of channel type can have different alarm values:
- numeric: you can set
minand/ormaxvalues - text: you can set text that will trigger alarm. You can add multiple values separated by comma Alarm are optional, so you don't need to configure them if you don't need them.
However you can configure Sensor Monitor to log data (and create new Issue) only when alarm will be triggered. This can be useful when you just want to notification when some unusual values occurs.
Data charts
But what with storing data without visualizing it? Sensor Monitor got you covered! It can display charts:
- on Jira dashboard - easily access sensors data from your main Jira screen
- on Issues with sensor data - tab in issue activities lets you easily navigate between logged data in issues
- on Sensor Monitor all sensor list - just open app configuration page and check charts for every registered sensor
Customization
Due to nature of data being saved as issues there are option to add user customization to it. You can simply add post functions for create issue transition in given project/issue type used by sensor. This post function can eg. send external notification, add special values for field in case there was alarm or check values and execute custom alarm.
Other use cases
Sensor Monitor can also be used for other cases eg. scraping value from external services, like site down detector to check for its availability. It's could be especially helpful when configured with alarm and enabled option to create issue only when there is an alarm value activated. So you will get notification only for created alarm issue.
Building sensor
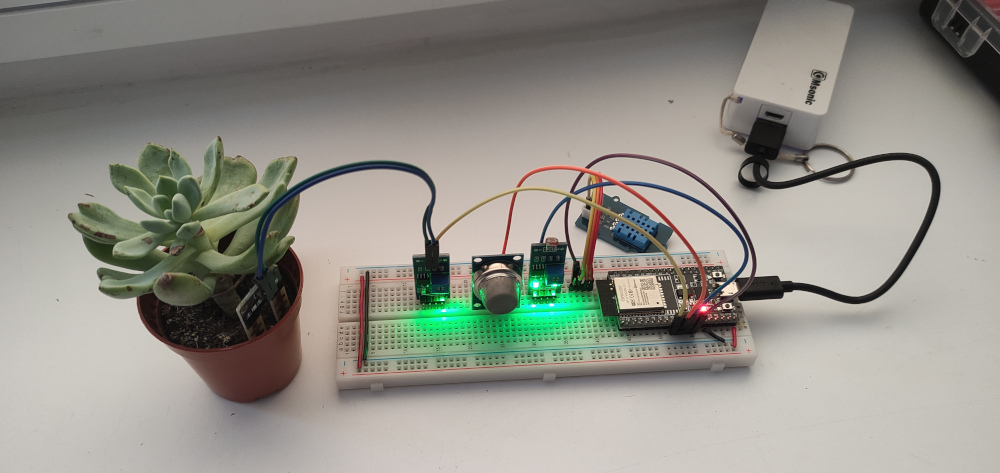
You can use any microcontroller or microcomputer with internet connectivity and connect some sensors to it. It can be eg. Arduino Uno with external WiFi module, Raspberry PI or ESP32 with built-in WiFi module. In my prototype I've used ESP32 devkit with connected sensors:
- DHT11 temperature sensor,
- LDR light sensitivity sensor,
- MQ135 air quality sensor,
- and some generic soil moisture sensor.
On Sensor Monitor I've created new sensor with those four channels and get an URL for my microcontroller.
To simplify prototyping process I've programmed ESP32 with Arduino IDE. It have many example libraries to execute HTTPS GET requests, so it was perfect for this case. It main loop was to:
- read all sensors data
- add them to query parameters of GET request string, like:
&temp=22.5&light=32.3&air=10.2&soil=7.8 - send HTTPS GET request to URL generated by Sensor Monitor
- wait an hour and repeat process
And that's all. Data is started to get logged into our Jira.
How we built it
Sensor Monitor was built using Forge platform with Custom UI. Two new (for me) main core functionalities that I've used here was task scheduling and webtriggers. After some initial testing it turned out that those functionalities provided by Forge works great for my case, so that's how I've begin working on Sensor Monitor. The second part was creating testing sensor hardware. For quick prototyping I've used ESP32 dev board with built-in WiFi programmed with Arduino, with attached sensors on breadboard and some generic USB powerbank. And a small office plant. It looked like it needed some more watering, so it was perfect candidate for testing.
Challenges we ran into
The main challenge was ease of use on sensor hardware. The main concerns was data sending and authorization. and easy of use on sensor. It needed to be as simple as possible, but on the other hand it needed to be secure. I've decided to use query params only approach and sending data using GET HTTPS requests. This way you don't need to attach special headers - you just need to create URL string with all params and send it via HTTPS. For authorization I've used generated query tokens. However I'm have plans to adding other, more advanced options.
Accomplishments that we're proud of
Implementation of scheduled data fetching. There was a lot of questions how to implement this functionality (UI/UX wise) and if there will be enough time to implement it. It was completely different approach than webtriggers triggered by sensor, as in this case Sensor Monitor would need to scrape external data and then somehow extract values from it. But after some quick proof-of-concept and some quick iterations of UI/UX I've made it in time! For now I've opted to stick with regexpes for data extraction (for first version it will be flexible enough for extracting many data formats) and Forge schedulers for scrapping data in specified intervals.
What we learned
Mainly: Forge webtriggers and scheduling. Plus connecting Forge to external service, in this case microcontroller with relatively limited resources. And plant care tips and tricks!
What's next for Sensor Monitor
The main thing I'm missing in current version of app is lack of units to configure. It would be beneficial for charts rendering to include them, so app could easily group all temperature (C/F degrees), lumens for light, distance to object in cm (for distance/proximity sensor) etc. Currently as workaround you can disable channels individually on chart, but it would be better to do this automatically by grouping by units. The second feature I'm currently missing and is something that I would love to add is other option for gathering data for scheduled fetching. Currently you need to add regexp to extract data, but it would be much easier for user when there would be support for fields accessors in JSON or XML. Third thing - more alarm configuration options. Advanced AND/OR operators for multiple channels could be useful for some more complicated cases. And last but not least - publishing on Atlassian Marketplace. Hopefully Sensor Monitor will be useful just like for us!
Enjoy!
PS. No plant was harmed during this project.


Log in or sign up for Devpost to join the conversation.