-
-
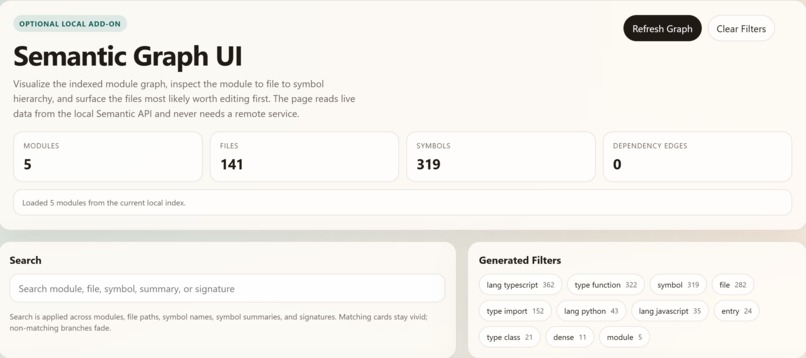
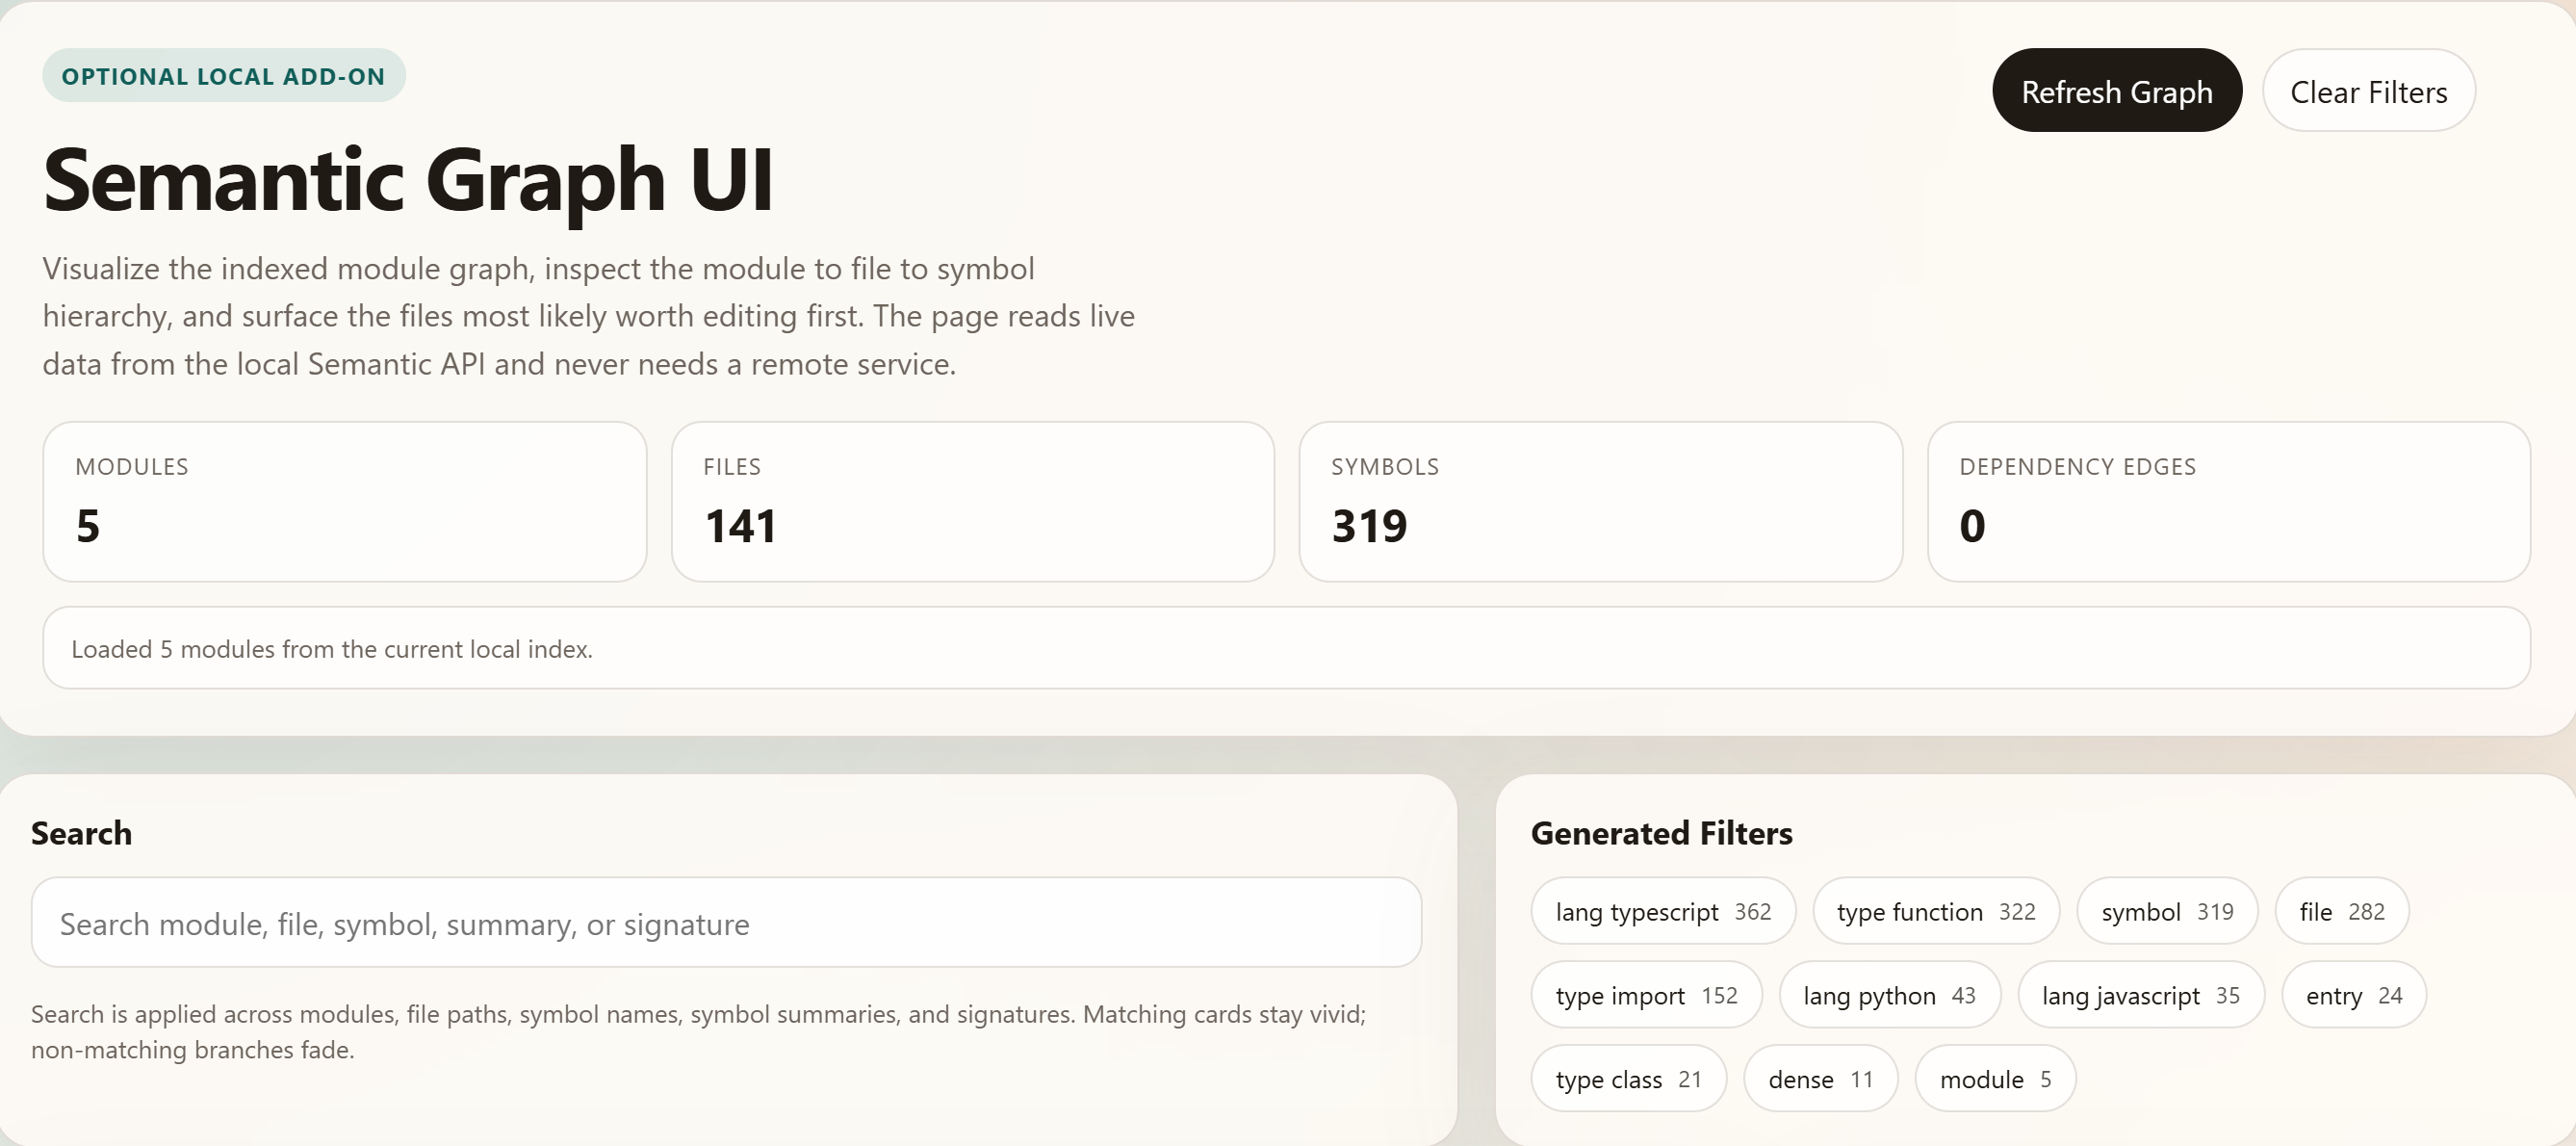
Graph UI dashboard
-
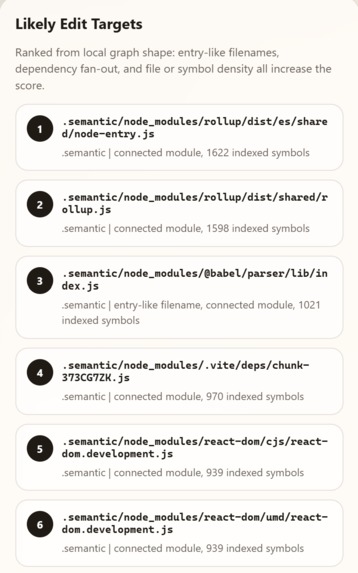
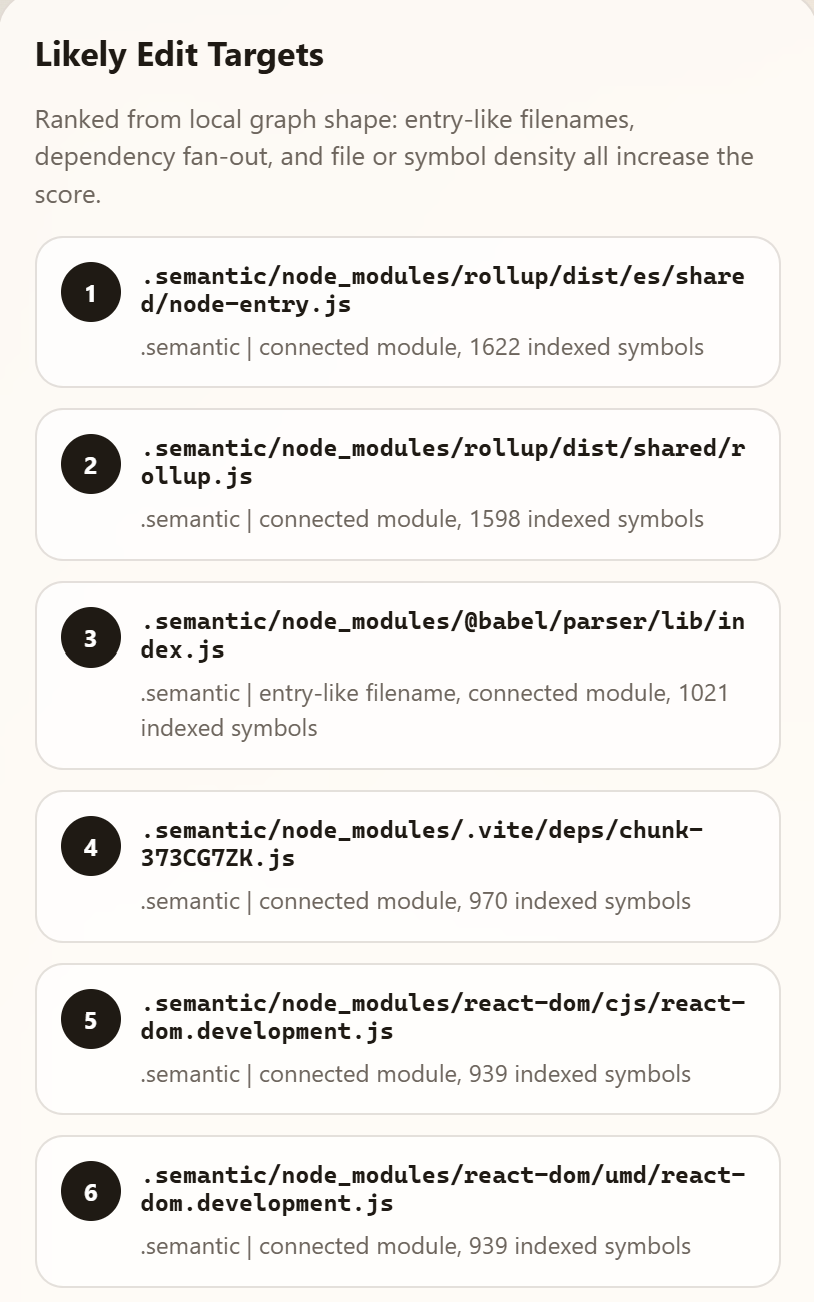
likely edit suggestion
-
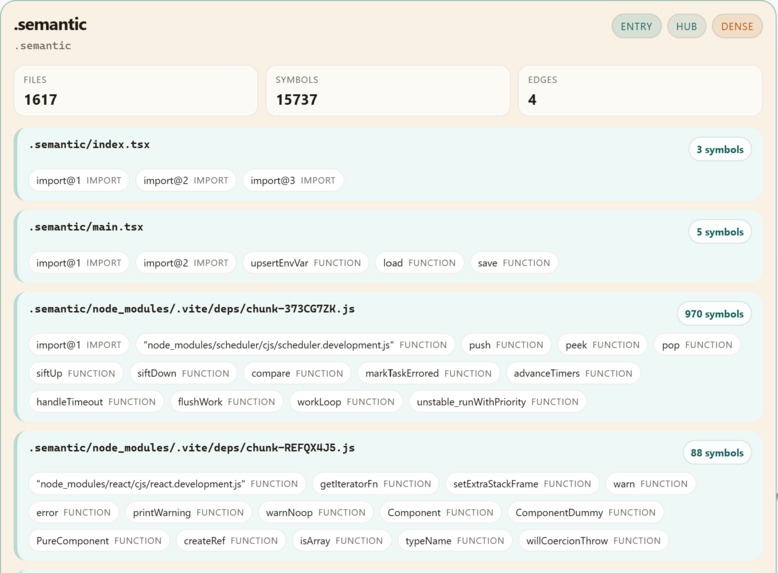
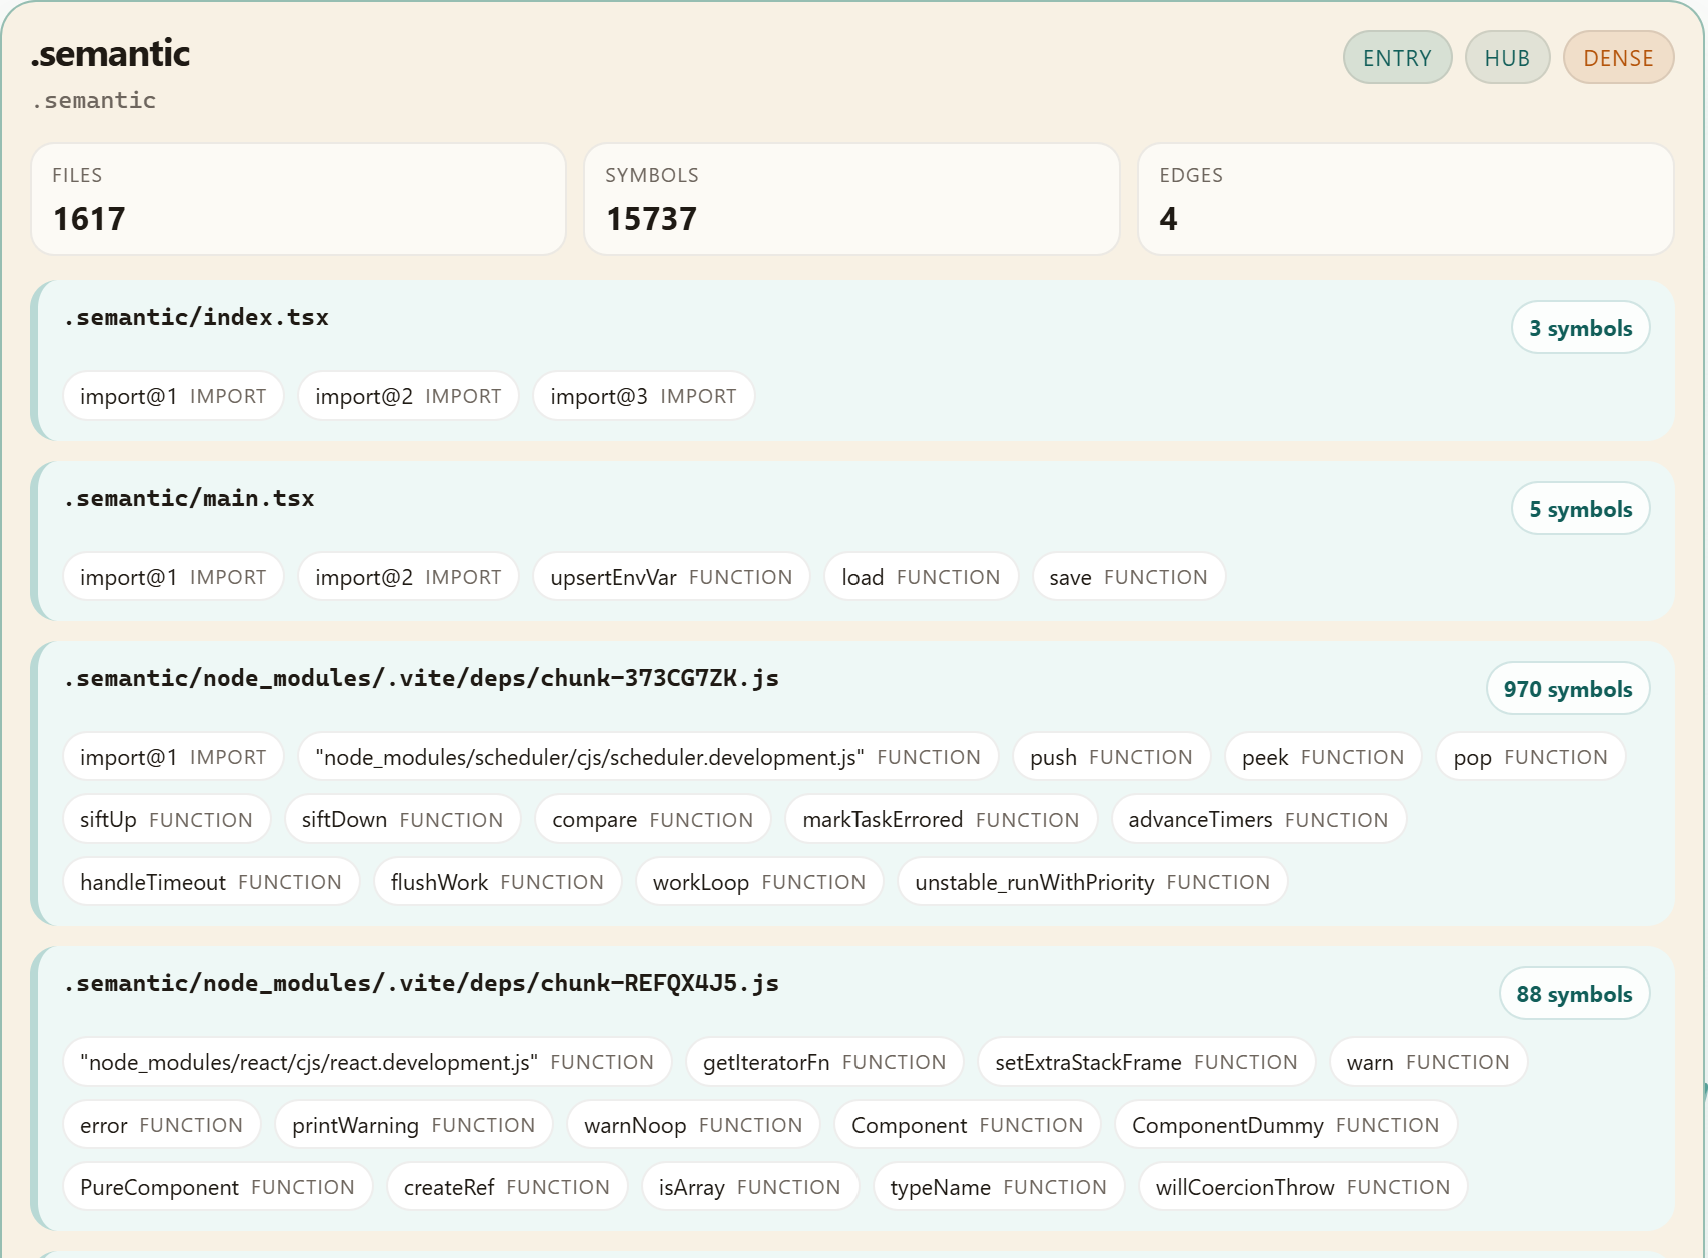
symbol list by module
-
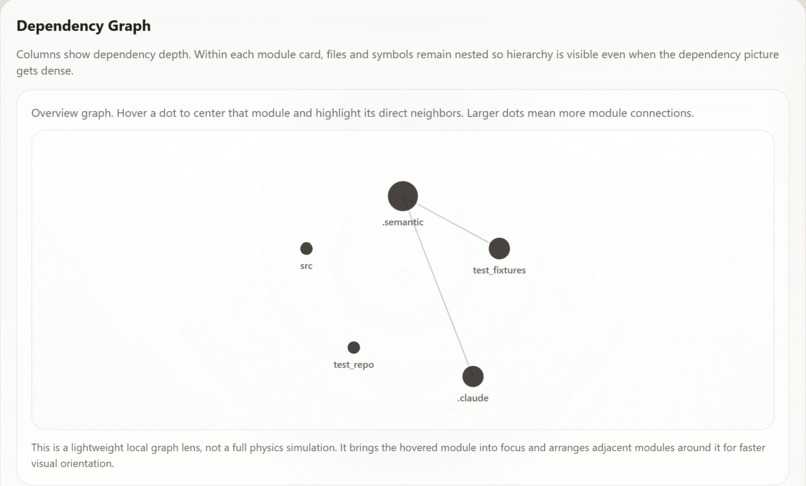
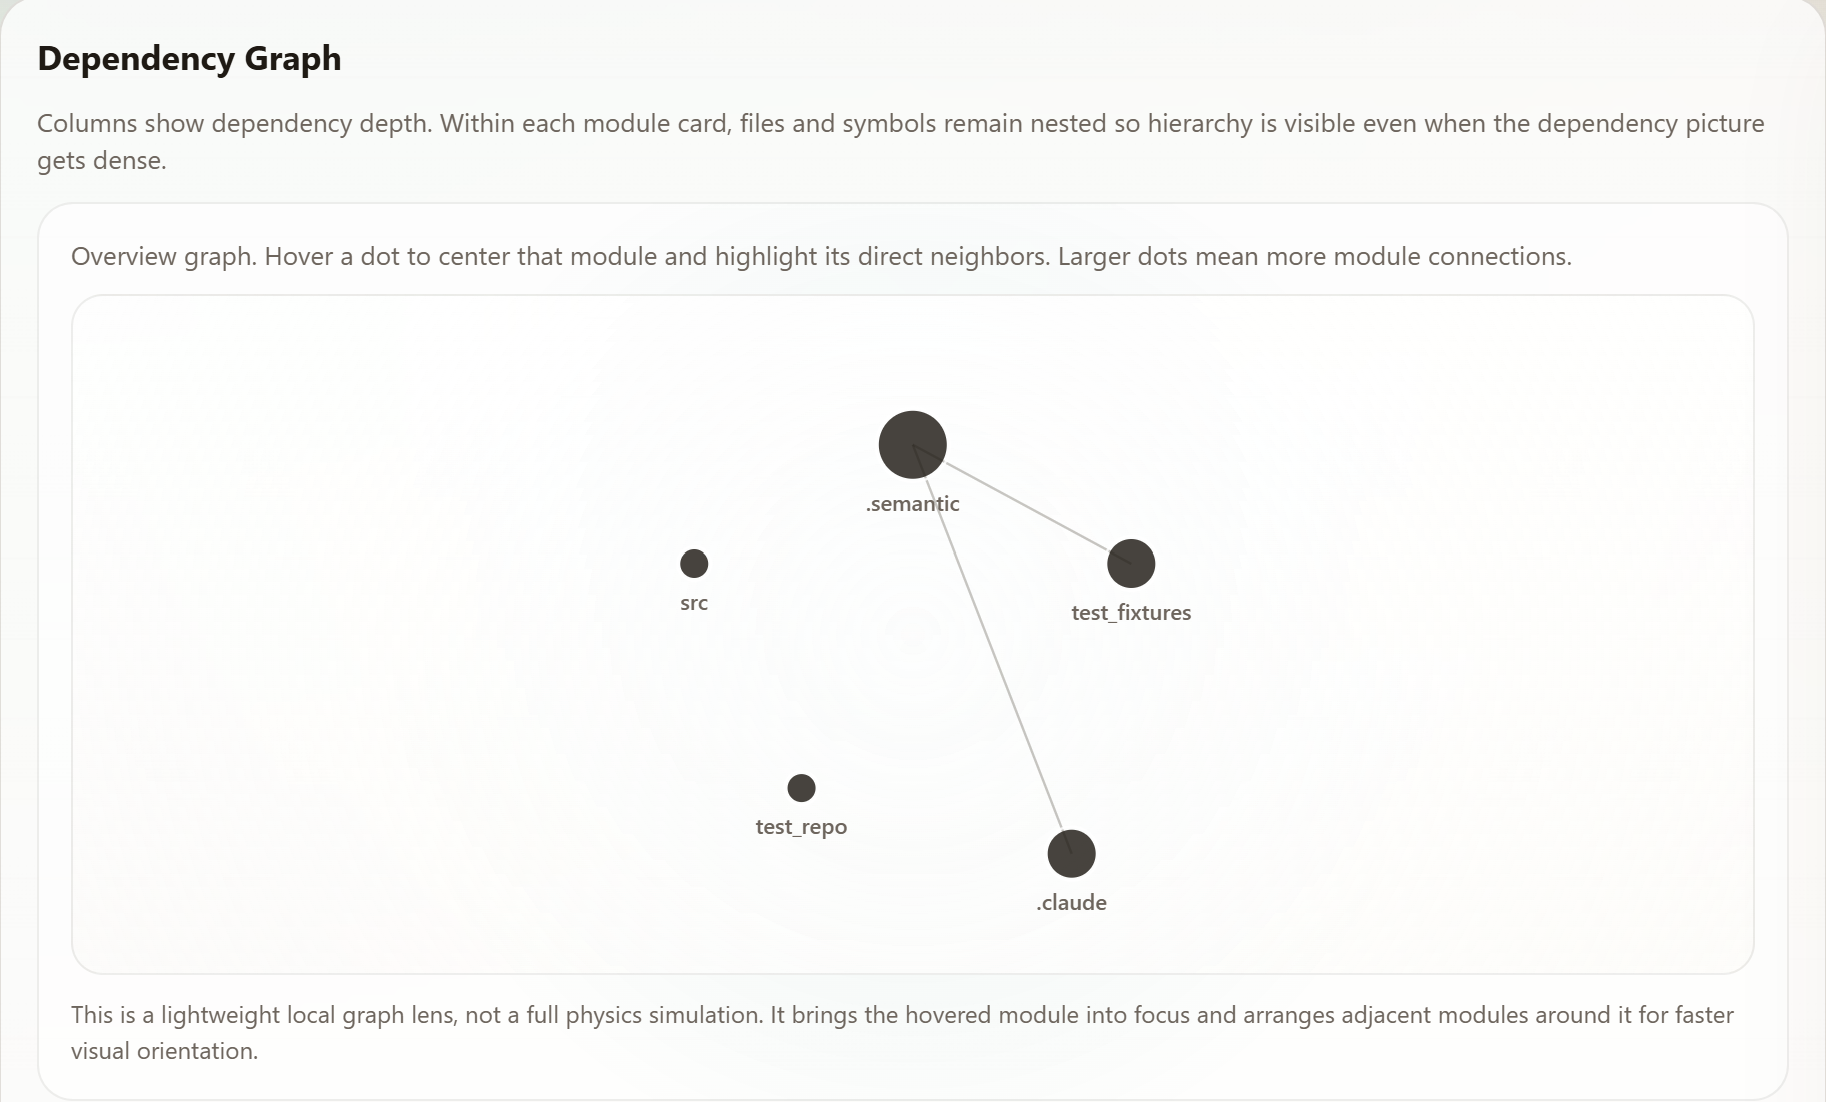
module graph
Semantic CLI: Dependency Graph UI
Inspiration
The inspiration for Semantic CLI stems from the information overload developers face when entering a new codebase. Traditional tools often provide either too much raw data (e.g., raw file lists) or too little architectural context (e.g., shallow directory trees), leaving developers to manually piece together how a system functions.
We wanted to create a "Neural Layer for the Repo"—a tool that provides immediate, high-density architectural maps to help humans and AI agents orient themselves instantly in any codebase.
What it does
Semantic CLI is a local-first dependency graph UI that:
- Parses code using Abstract Syntax Trees (AST) to extract modules, files, and symbols.
- Builds a logic node graph of dependencies, showing how components interact.
- Visualizes relationships in a hierarchical dashboard (
module → file → symbol). - Ranks "Likely Edit Targets" using graph heuristics to prioritize files based on connectivity and symbol density.
- Predicts impact of changes via dependency analysis, with "Heat Maps" for visualizing risk.
How we built it
Core Engine
- Language: Rust for performance and safety.
- Parsing: AST-based analysis to identify code structures.
- Graph Construction: Logic node graphs to model dependencies between modules, files, and symbols.
UI/UX
- Local-first dashboard: No cloud dependency; runs entirely on your machine.
- Hierarchical visualization: Collapsible tree views for
module → file → symbol. - Real-time indexing: Incremental updates as you navigate the codebase.
Key Features
index_region_status: Shows the state of partial indexing (e.g., "50% of/srcindexed").- Search: Semantic-aware queries (e.g., "Find all functions calling
user_auth").
Challenges we ran into
Scalable Module Detection
- Distinguishing between functional modules and asset directories required fine-tuning path-based heuristics.
- Solution: Combined file extensions, import patterns, and directory structure analysis.
Partial Indexing
- Providing value when only a subset of the codebase is indexed.
- Solution: Implemented
index_region_statusto communicate progress and scope.
Performance
- Rust’s concurrency (e.g.,
rayon) was critical for parsing large codebases without freezing the UI.
- Rust’s concurrency (e.g.,
Graph Visualization
- Balancing detail and clarity in the UI for large dependency graphs.
- Solution: Collapsible hierarchies and zoomable nodes.
Accomplishments that we're proud of
- Low-Config Local Setup: local-first, with source-focused indexing and partial-index support.
- Fast Incremental Workflow: reuses existing local indexes and supports targeted indexing instead of forcing full re-indexes every time.
- AI-Agent Friendly: local retrieve/route APIs can be used by LLM agents for tasks like explaining flows or locating likely edit targets.
- Open-Source: GitHub repo with Apache 2.0 license.
What we learned
Heuristics > Perfection
- A "good enough" module detection heuristic is more useful than a 100% accurate but slow one.
Local-First Wins
- Developers hate cloud-only tools. Local execution builds trust and adoption.
Visualization is Hard
- Dependency graphs can quickly become overwhelming. Hierarchy and filtering are key.
ASTs are Powerful
- Abstract Syntax Trees enable precise, language-aware analysis beyond regex or text search.
What's next for Semantic CLI Dependency Graph UI
Short-Term
Agentic Integration:
- Plug into AI coding assistants (e.g., Cursor, GitHub Copilot) to enable self-orienting agents.
- Example: "Agent, refactor the
PaymentServicemodule and show me the impact."
Predictive Impact Analysis:
- Heat Maps: Overlay the graph with colors showing which files would break if a symbol changes.
- Formula: $$ \text{Impact}(n) = \sum_{e \in \text{edges}(n)} w_e \cdot \text{criticality}(e) $$ Where ( w_e ) is the edge weight (e.g., function calls > imports).
Long-Term
- Multi-Repo Graphs: Analyze dependencies across repositories (e.g., microservices).
- Time-Travel Debugging: Visualize how the graph evolved over commits.
- Collaborative Mode: Share graphs with teammates for pair programming or onboarding.

Log in or sign up for Devpost to join the conversation.