Inspiration
Ad teams usually have too many creatives and too little time. Most dashboards show raw performance, but they do not answer the harder question: which creatives are truly worth pushing right now, and which are just visual copies of stronger ads.
Selecta was inspired by that gap. We wanted a system that helps performance teams make faster decisions by combining:
- a core quality score,
- a market/revenue signal,
- and a visual similarity penalty that prevents weak duplicates from crowding the portfolio.
The goal was simple: turn a noisy creative set into a ranked, actionable output.
What We Built
We built an end-to-end decision layer for creative ranking and integrated it into a clean Streamlit product UI.
1) Multi-layer scoring backend
For each creative (i), we compute:
- Core score (m_i) (main signal, currently mocked for demo),
- Revenue boost (b_i) (normalized within app context),
- Similarity penalty (p_i) (asymmetric; weaker ads are penalized when similar to stronger ones).
Final score:
[ s_i = w_m \, m_i + w_b \, b_i - w_p \, p_i ]
with practical score range clamping:
[ s_i \leftarrow \min!\big(\max(s_i, s_{\min}), s_{\max}\big) ]
In our setup, the main layer is intentionally dominant, while side layers are controlled modifiers.
2) Similarity logic (asymmetric by value)
Given visual embeddings (x_i), we compute cosine similarity:
[ \mathrm{sim}(i,j) = \frac{x_i^\top x_j}{\lVert x_i \rVert \, \lVert x_j \rVert} ]
Penalty only applies from stronger-to-weaker creatives. If creative (j) has better value signal than (i), then similarity contributes to (i)'s penalty:
[ p_i = \sum_{j \neq i} \mathbf{1}[r_j > r_i] \cdot \max!\big(0, \mathrm{sim}(i,j)-\tau\big)\cdot g(r_j-r_i) ]
where:
- (r_i) is creative value proxy (revenue-driven),
- (\tau) is similarity tolerance,
- (g(\cdot)) scales penalty by value gap.
This preserves strong winners while discouraging low-value lookalikes.
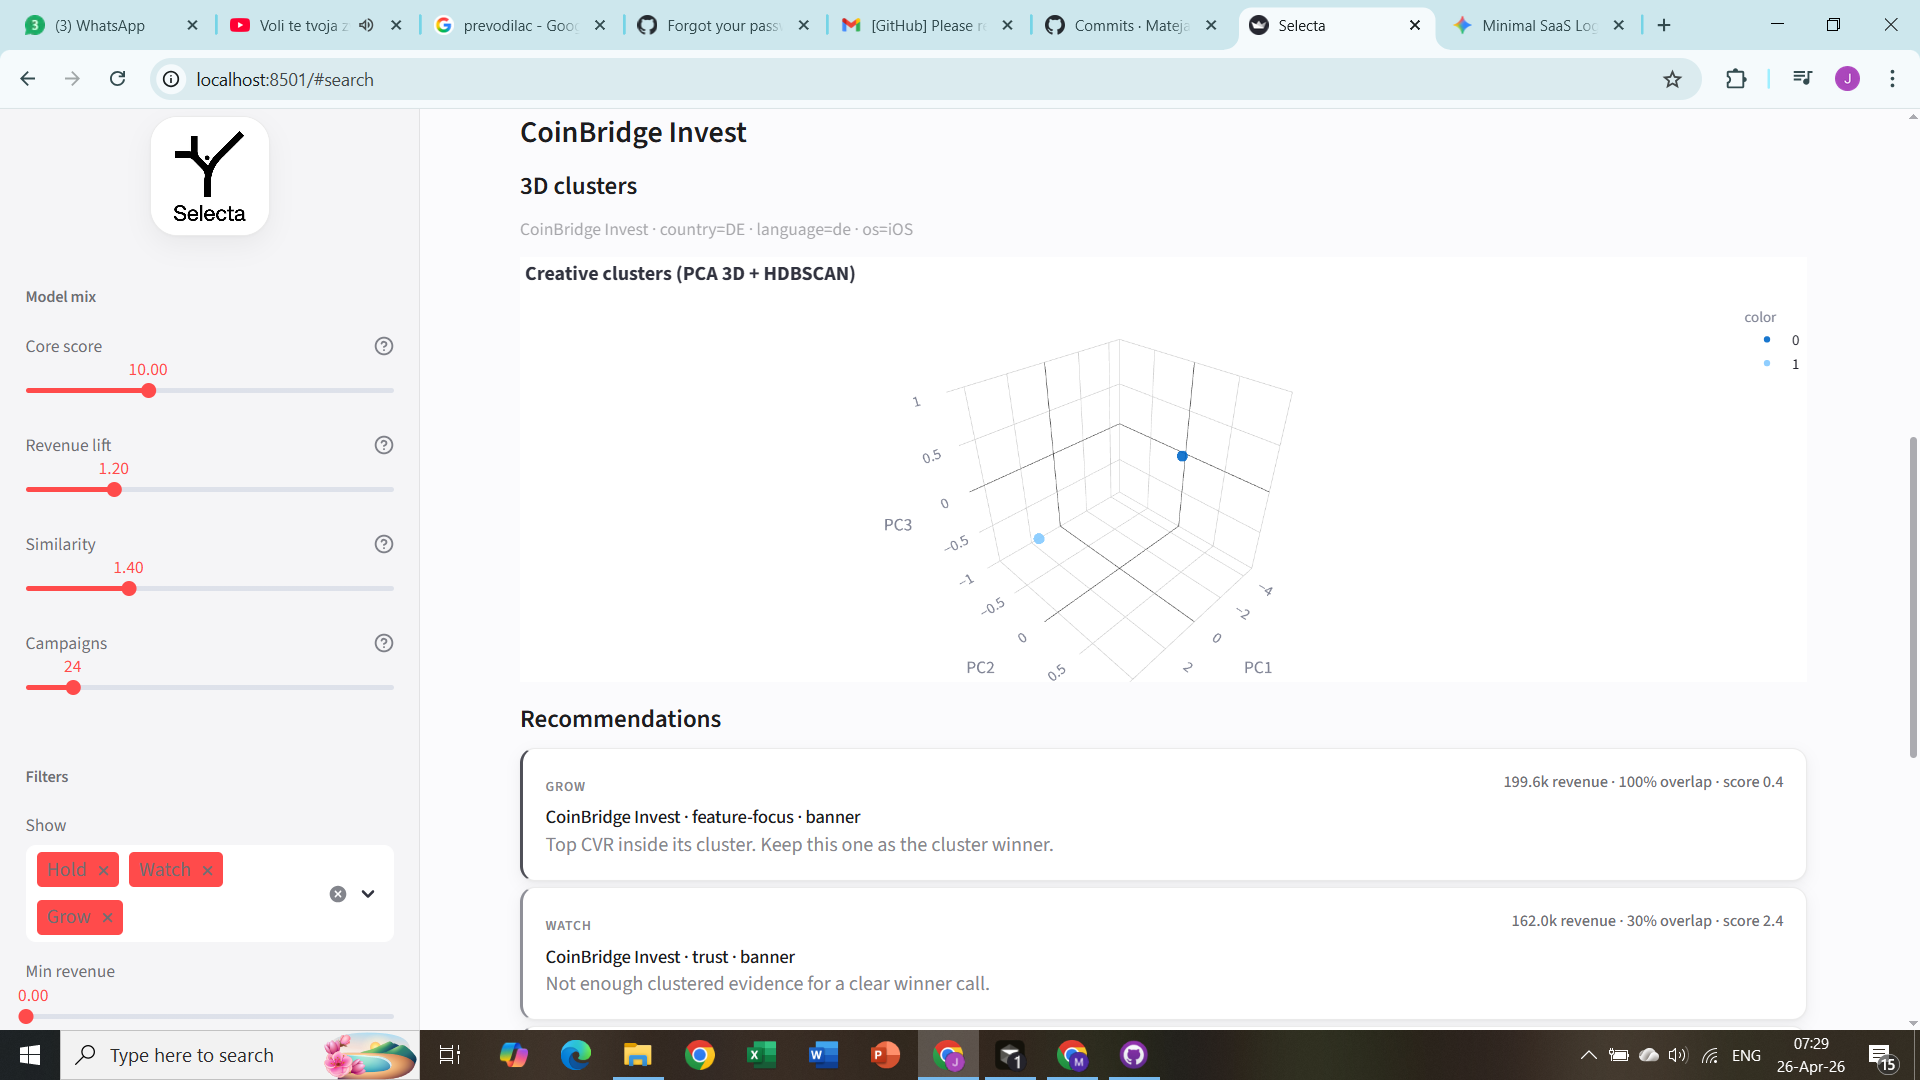
3) Cluster-aware analysis
For a selected app + audience slice (language/country/OS), we build time-series-based creative features, standardize them, reduce with PCA, then cluster.
Standardization:
[ z_{ik} = \frac{x_{ik} - \mu_k}{\sigma_k} ]
PCA retains at least 95% variance:
[ \min d \quad \text{s.t.} \quad \sum_{k=1}^{d}\lambda_k \big/ \sum_{k=1}^{D}\lambda_k \ge 0.95 ]
Clustering strategy:
- small sample: Ward hierarchical clustering with automatic cut,
- larger sample: HDBSCAN.
Inside each cluster, winner selection is CVR-based:
[ \mathrm{CVR}_i = \frac{\mathrm{conversions}_i}{\mathrm{clicks}_i + \epsilon} ]
For each cluster (C):
[ i^\star = \arg\max_{i \in C} \mathrm{CVR}_i ]
- (i^\star) is labeled winner (Grow),
- others in (C) are held back (Hold),
- singleton cluster (\Rightarrow) that single creative is winner by definition.
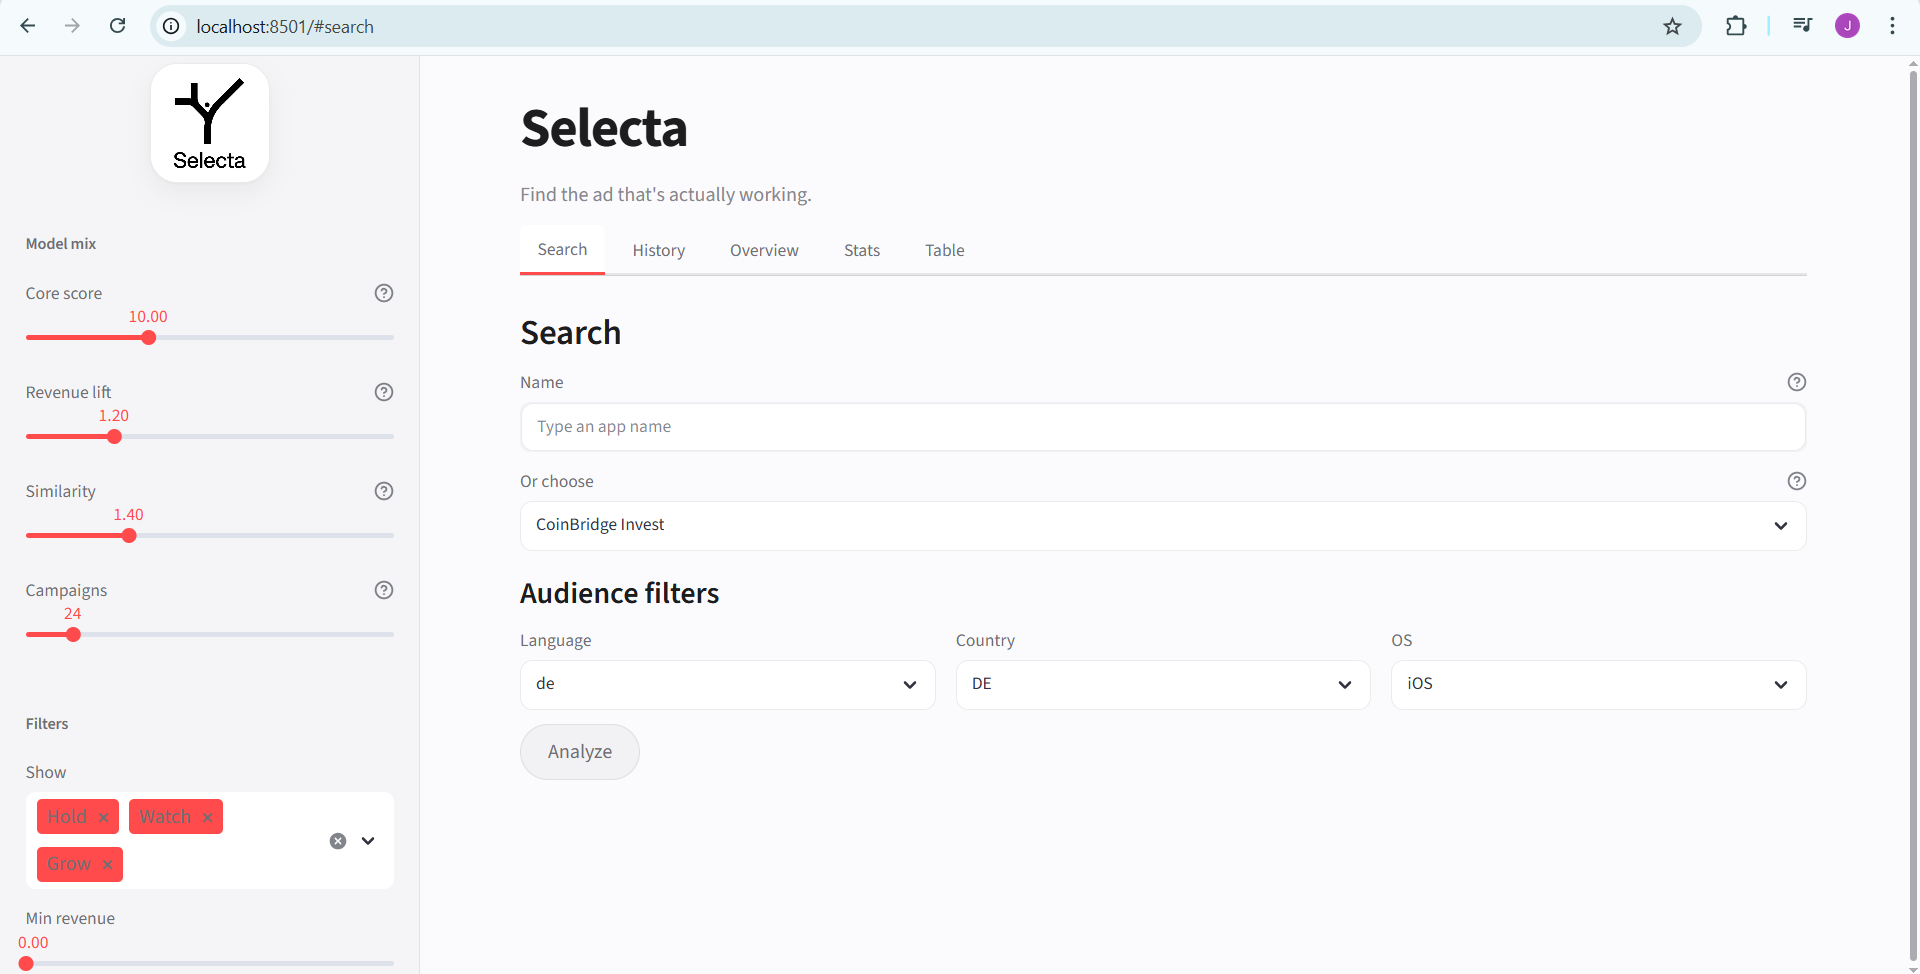
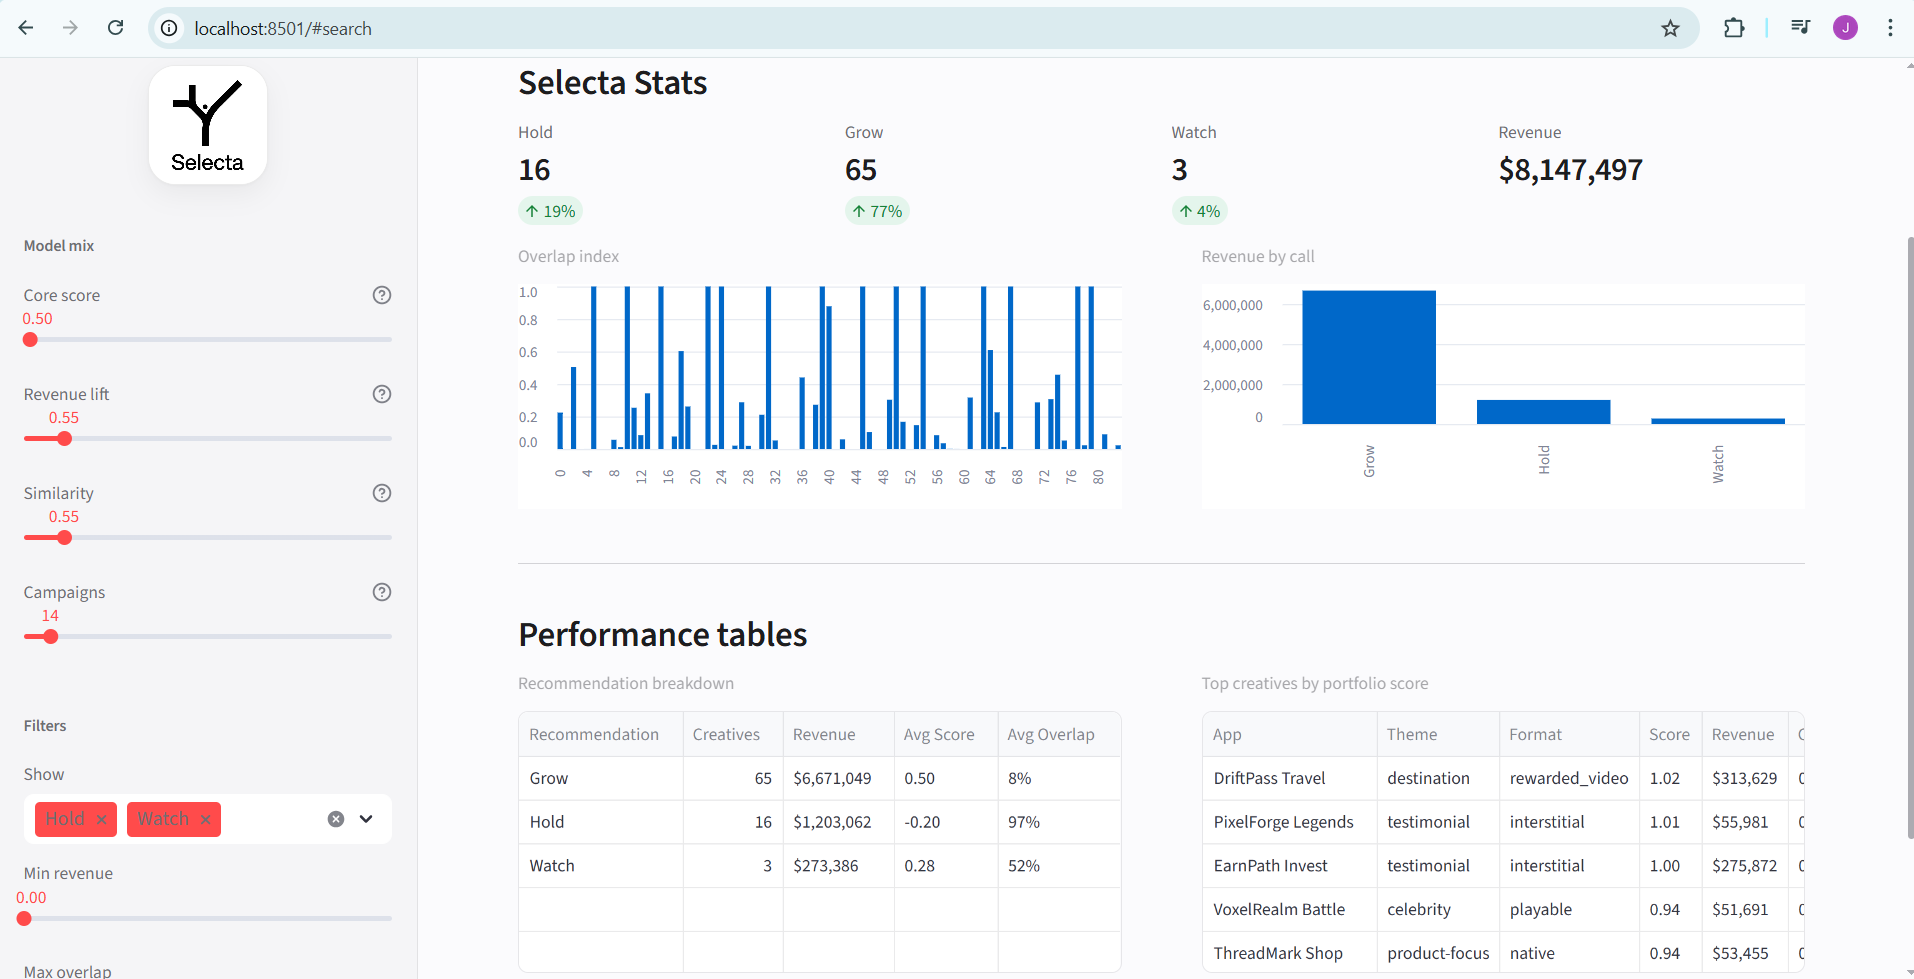
Product Experience
We integrated everything into a branded Selecta UI with:
- fast Search flow by app and audience filters,
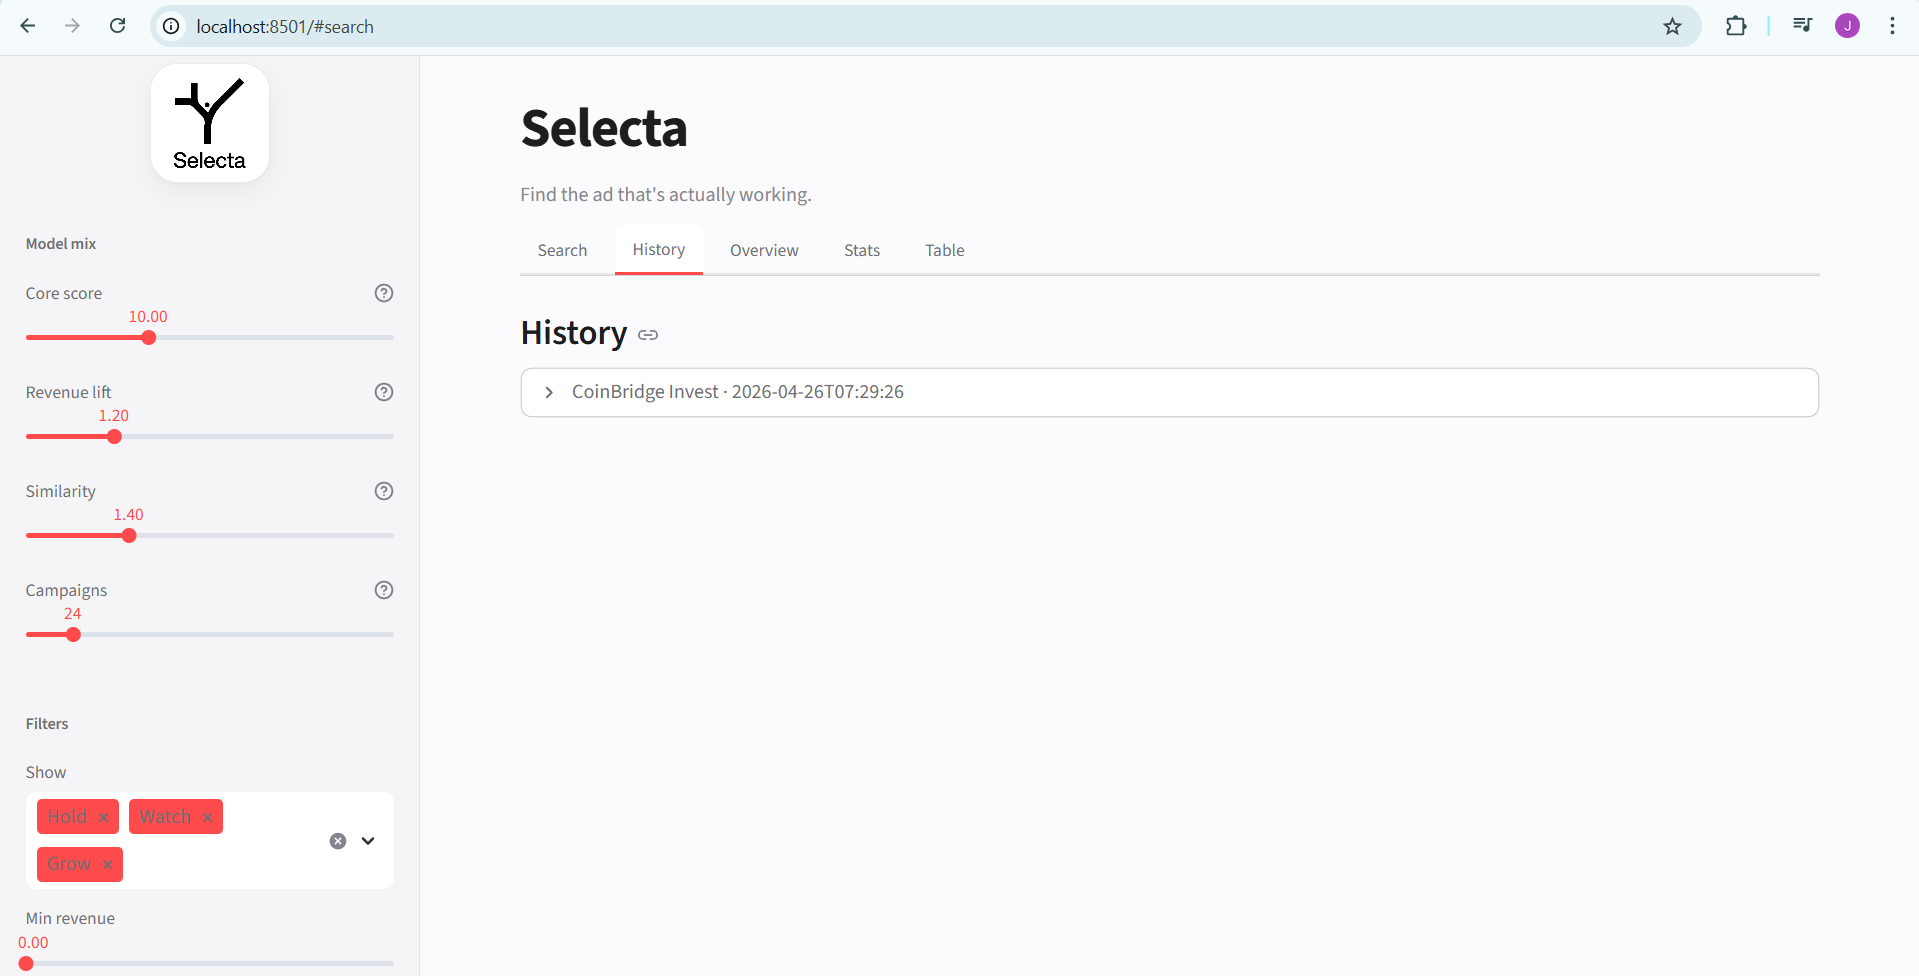
- run History,
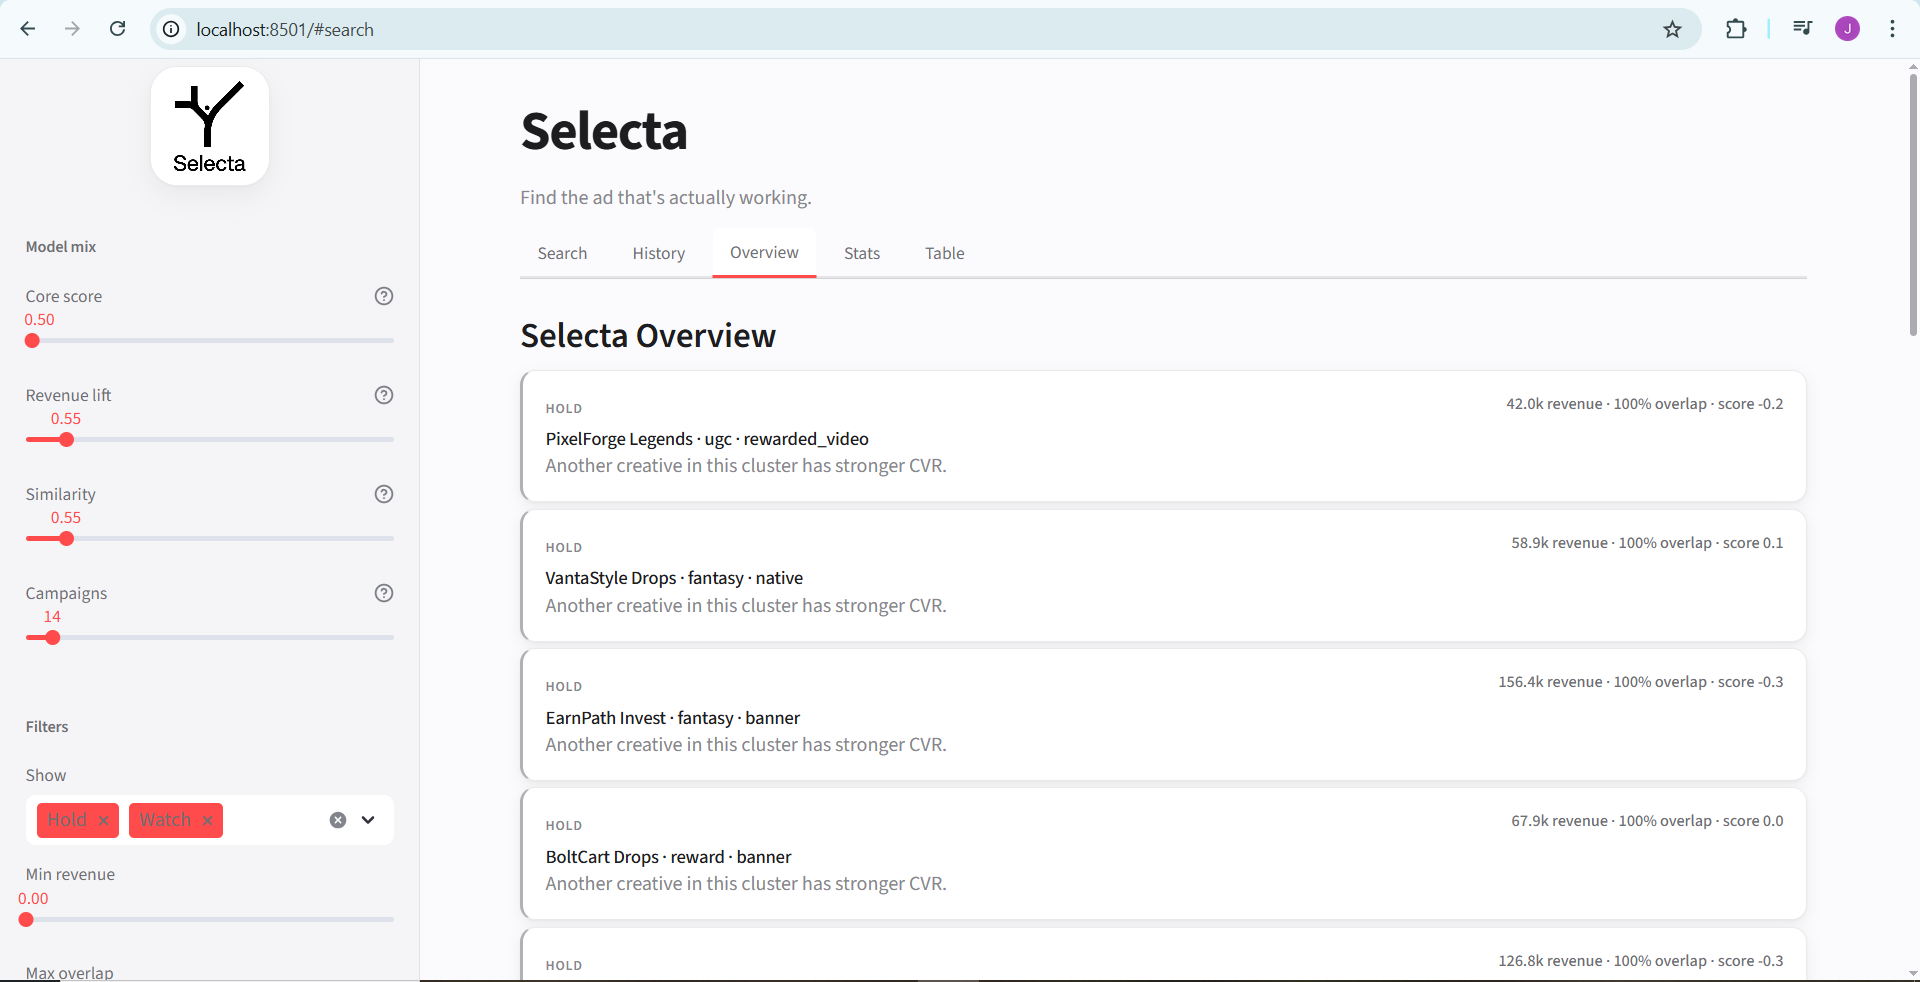
- overview and stats views,
- recommendation cards with friendly language (Hold / Watch / Grow),
- compact, minimal design tuned for presentation.
This allows teams to move from raw data to action in one screen.
Challenges We Faced
Cross-machine inconsistency in clustering output
We found that even small implementation drift can change cluster counts. We resolved this by wiring the UI to call the exact clustering implementation used in validation.Platform-specific runtime issues (Windows)
SSL/certificate and console encoding differences caused startup/runtime failures. We added robust launcher/runtime handling to keep behavior stable locally.Balancing explainability vs. model complexity
A ranking model is useful only if humans trust it. We kept formulas and recommendation logic interpretable and aligned labels with decision language.UI polish under hackathon speed
We repeatedly refined spacing, hierarchy, and controls to keep the experience modern, minimal, and focused.
What We Learned
- Consistency beats cleverness: exact reproducibility across devices matters more than micro-optimizations.
- Asymmetric similarity is practical: not all similarity is bad; it is harmful mainly when weaker creatives imitate stronger ones.
- Decision framing matters: business users respond better to clear actions (Hold/Watch/Grow) than abstract technical metrics.
- Tight integration wins: backend signal quality and frontend clarity must evolve together.
Impact
Selecta turns creative evaluation into a structured decision system:
- rank creatives with weighted multi-signal scoring,
- detect and penalize weak visual redundancy,
- surface cluster-level winners by CVR,
- deliver clean outputs for immediate performance decisions.
In short, it helps teams find the ad that is actually working, and scale it faster.
Built With
- hdbscan
- numpy
- pandas
- scikit-learn

Log in or sign up for Devpost to join the conversation.