-
-

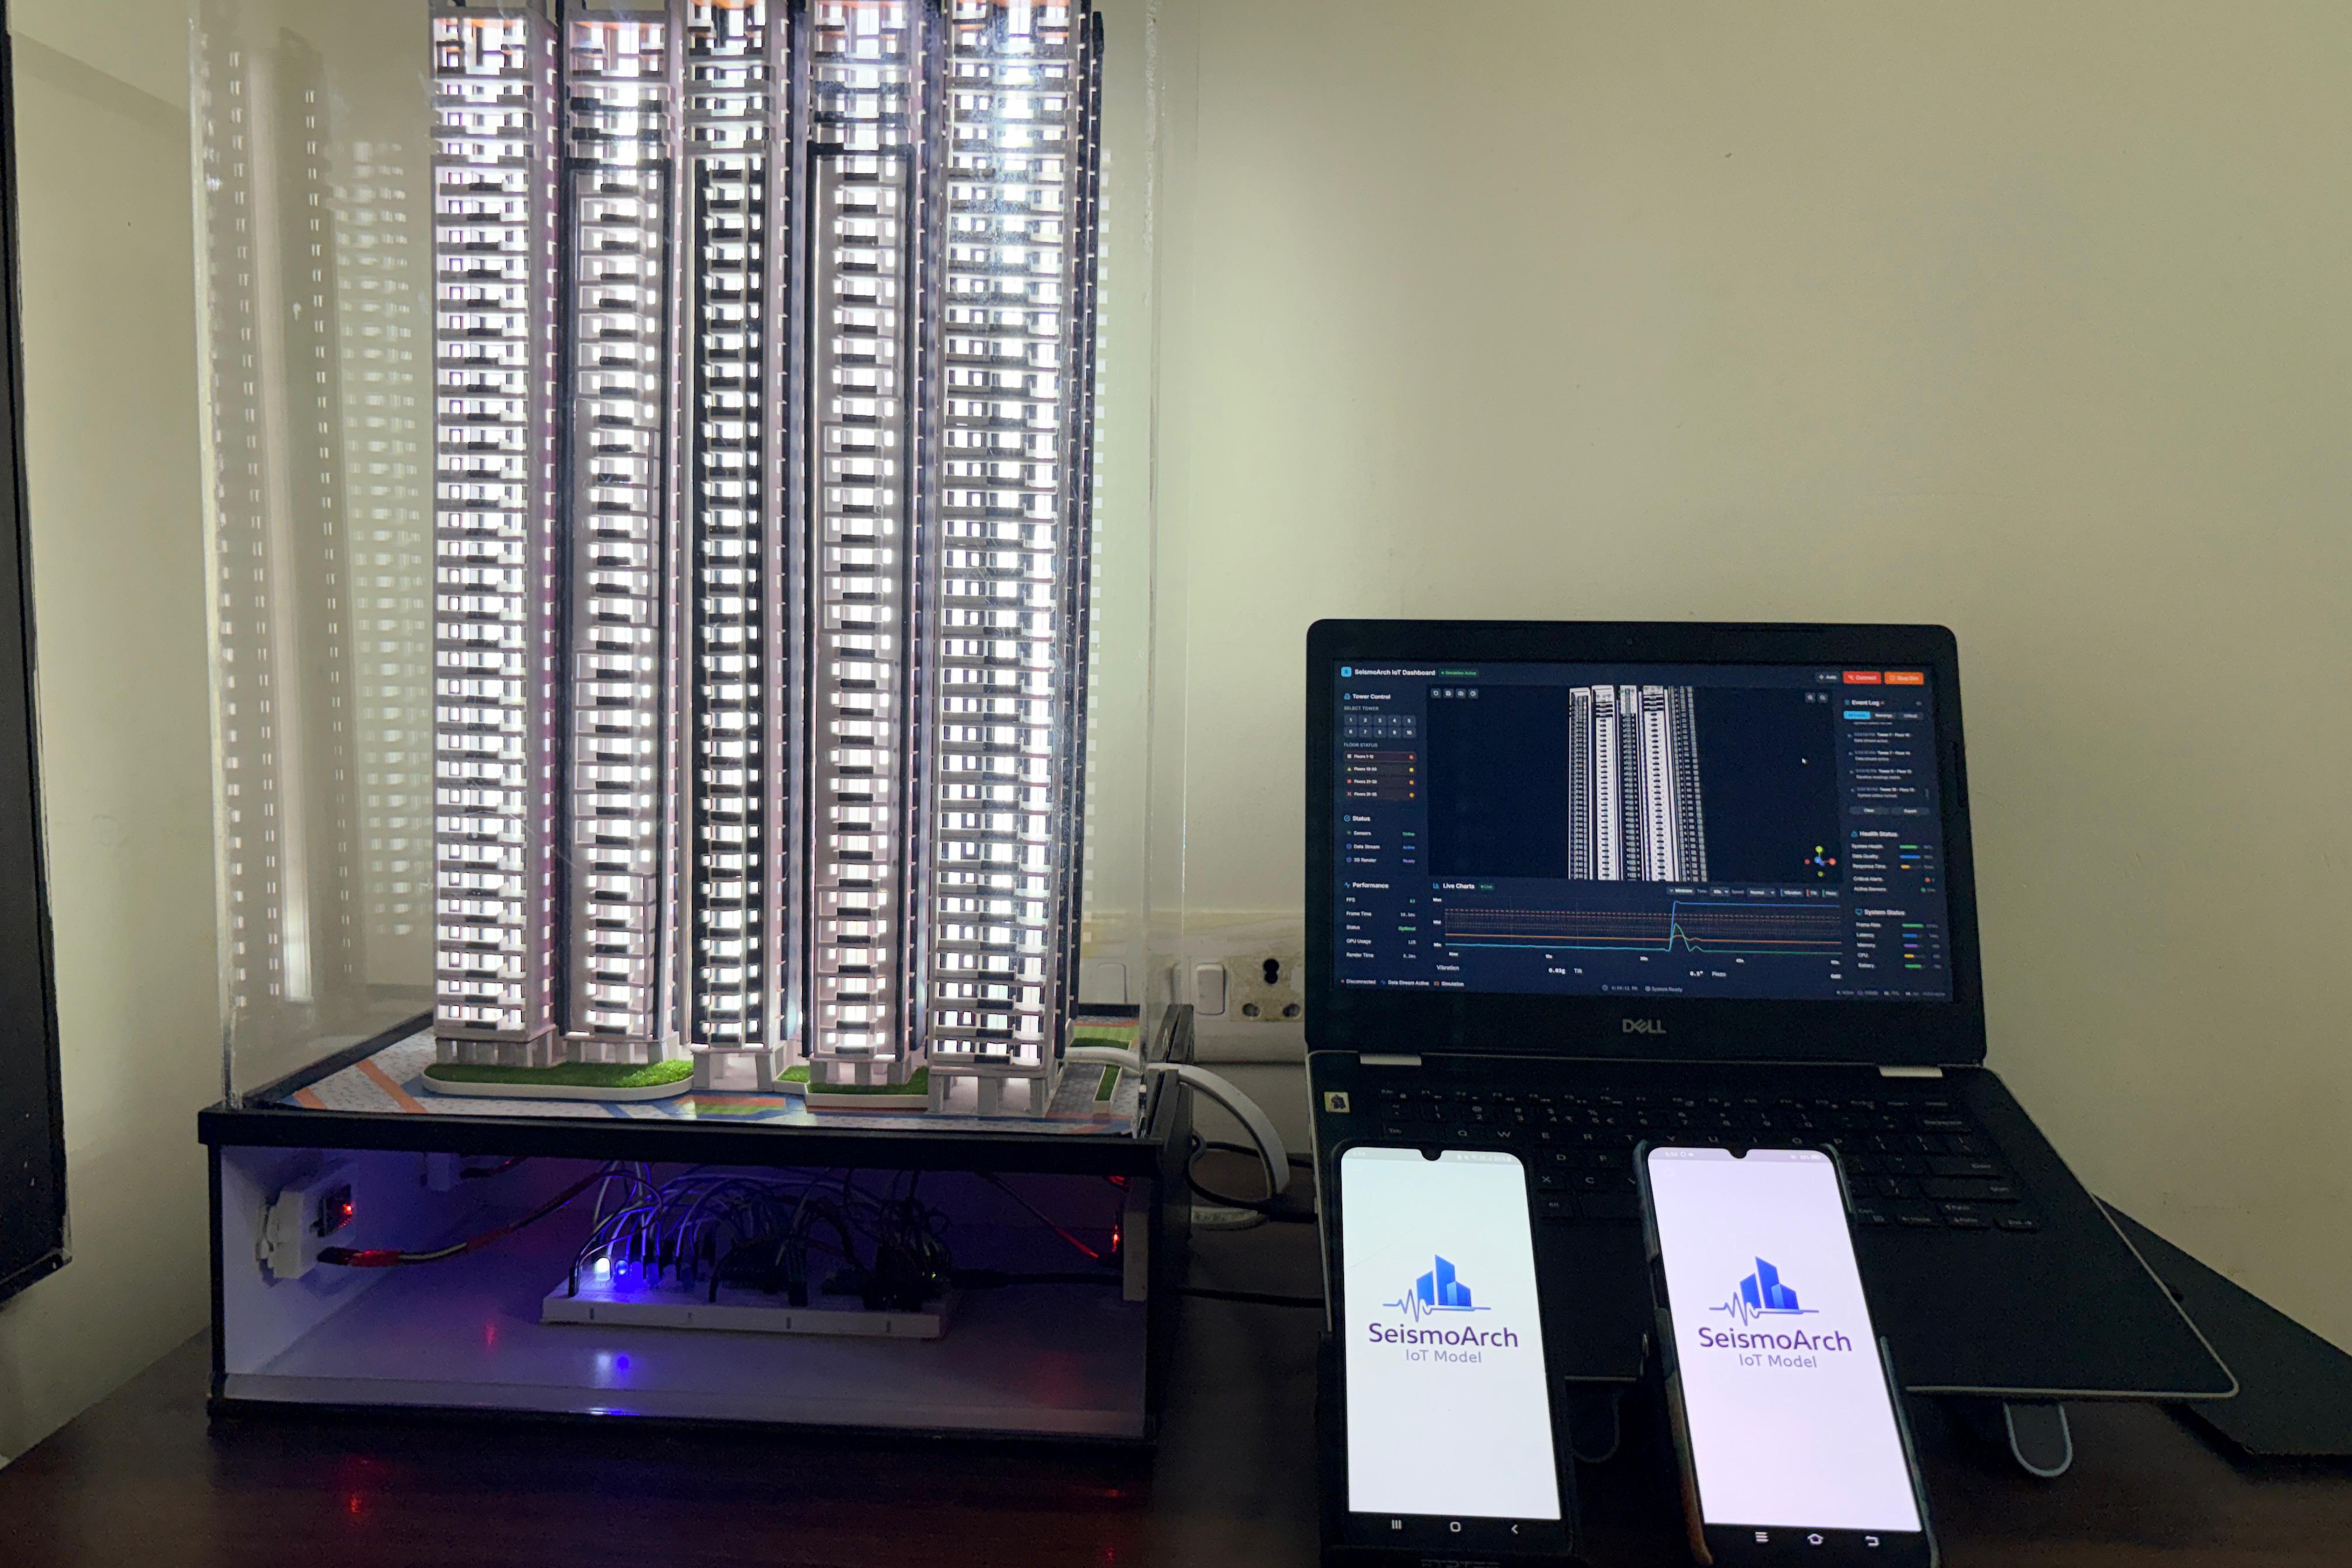
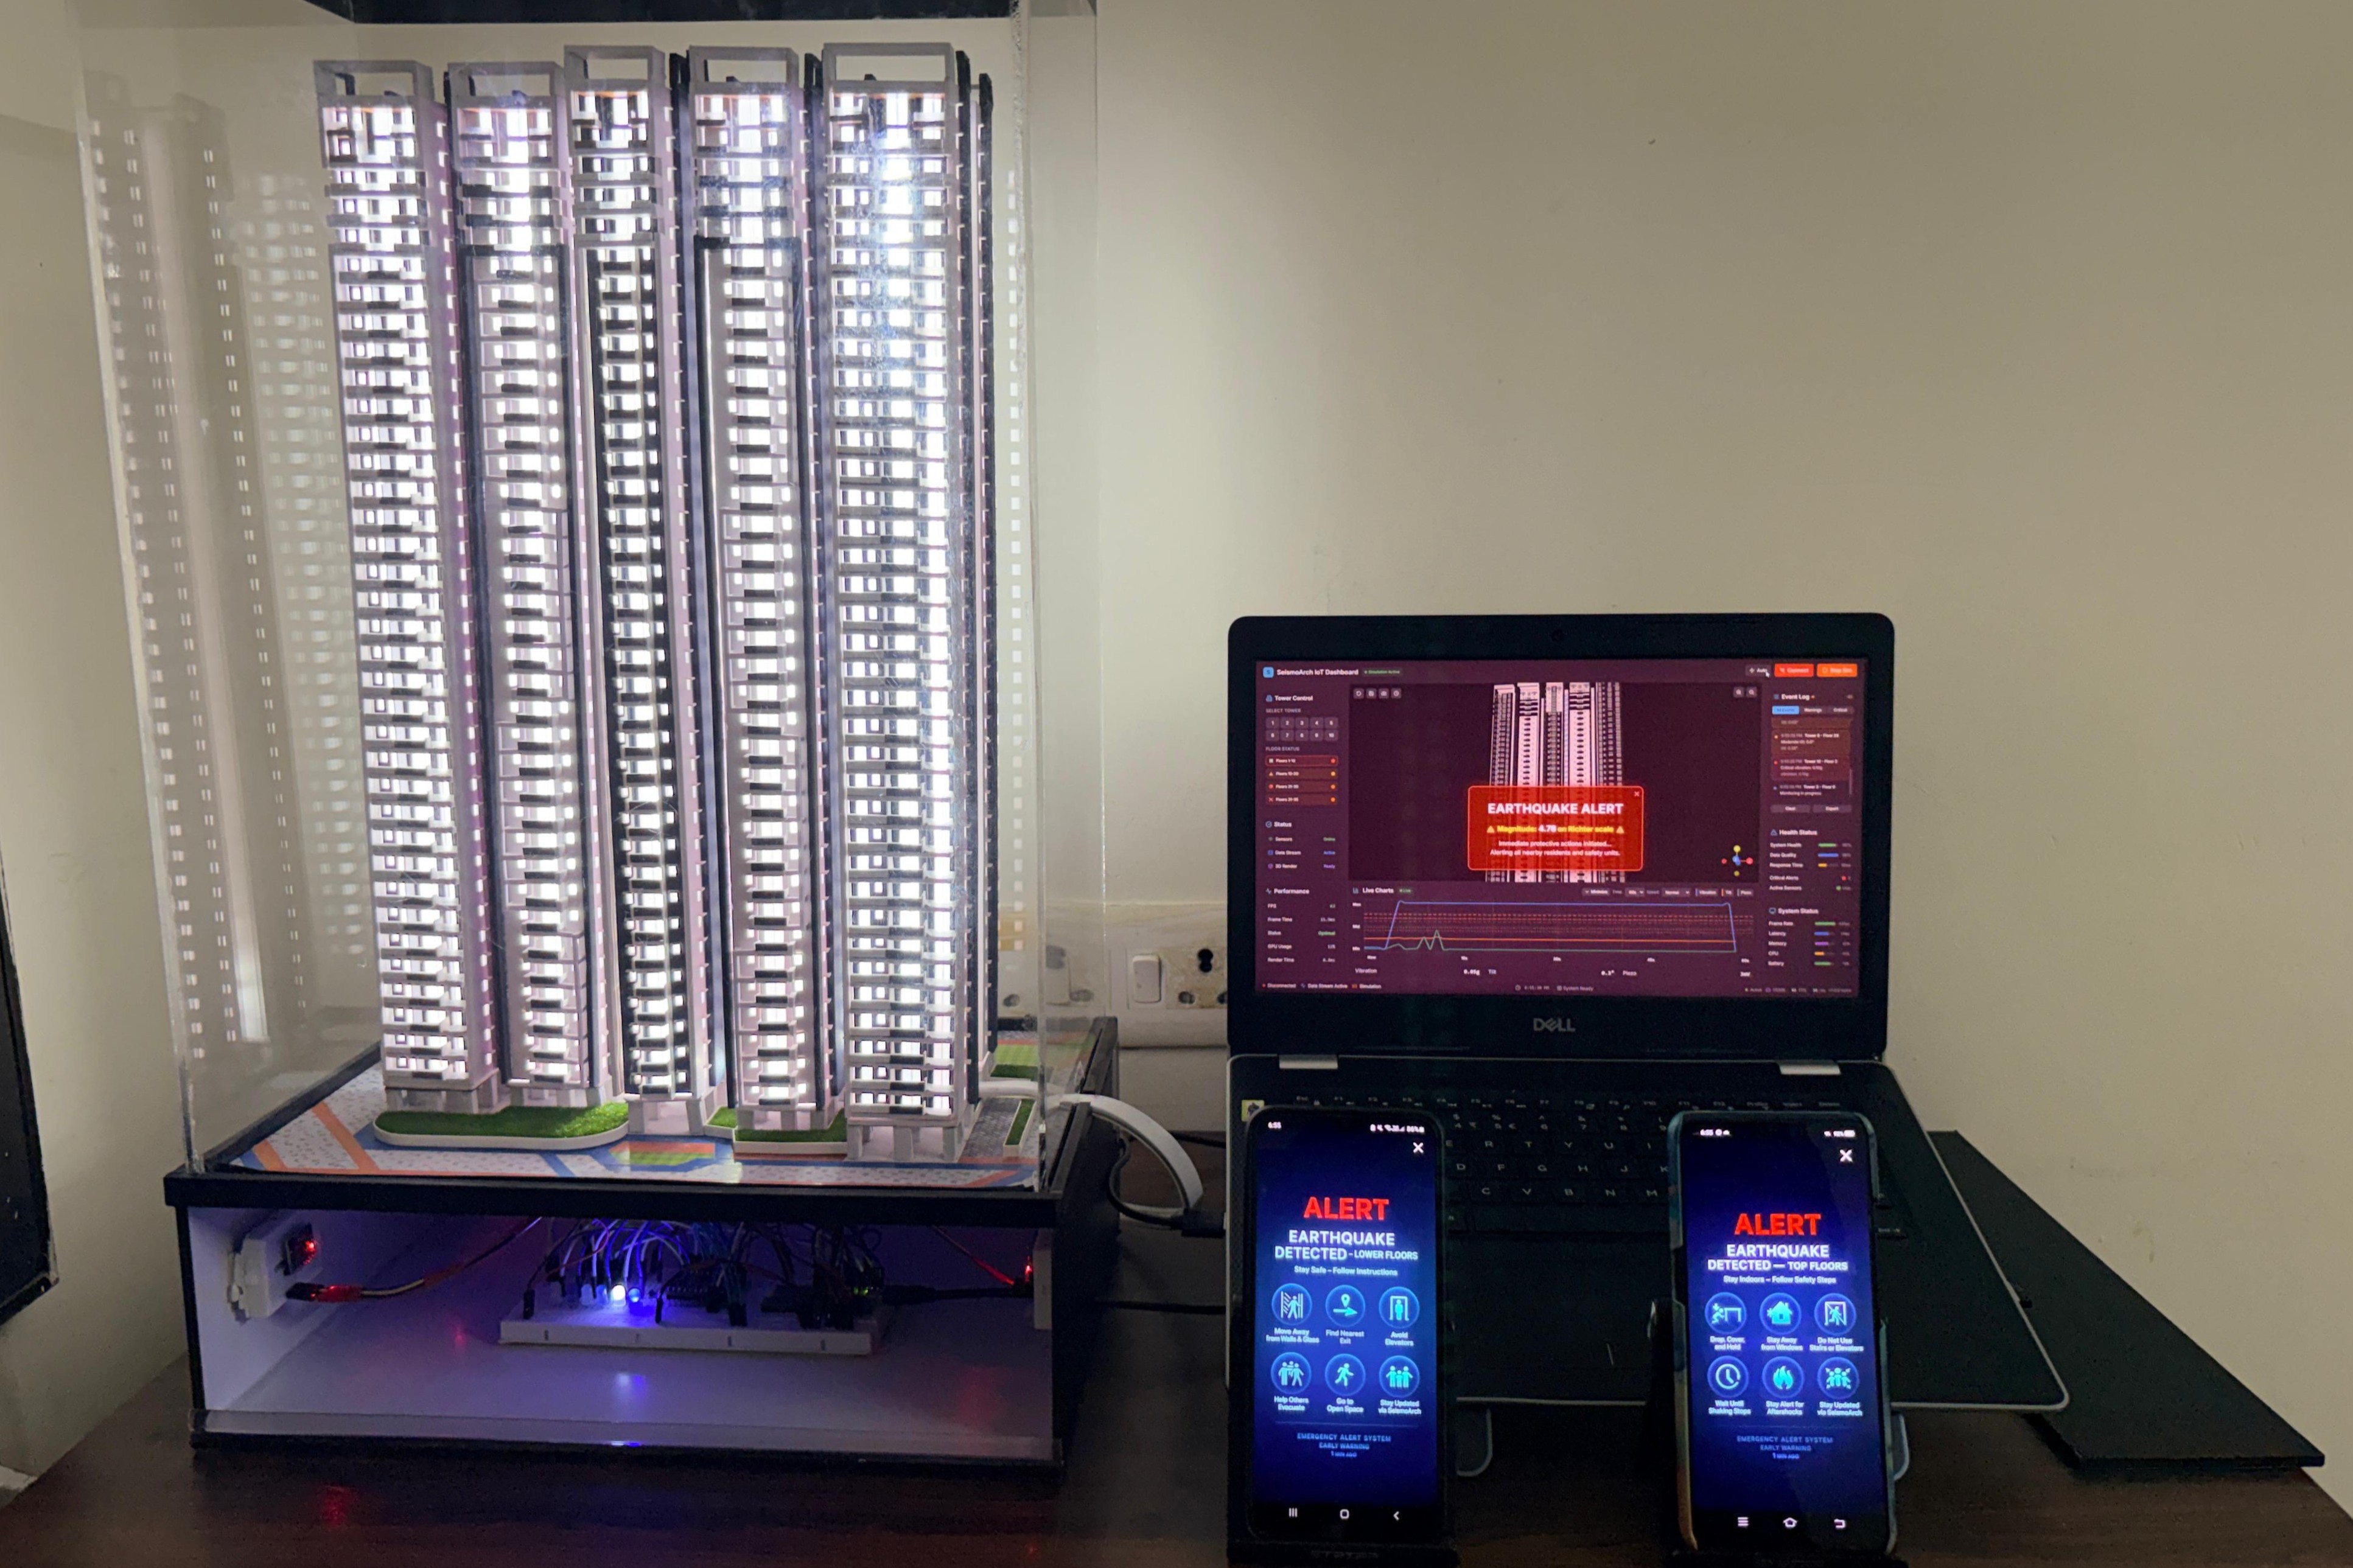
Complete hand-built SAIM demonstration setup combining the physical building model, live dashboard, and mobile alerts.
-

End-to-end earthquake early warning demonstration: physical structure, real-time monitoring dashboard, and mobile notification output.
-

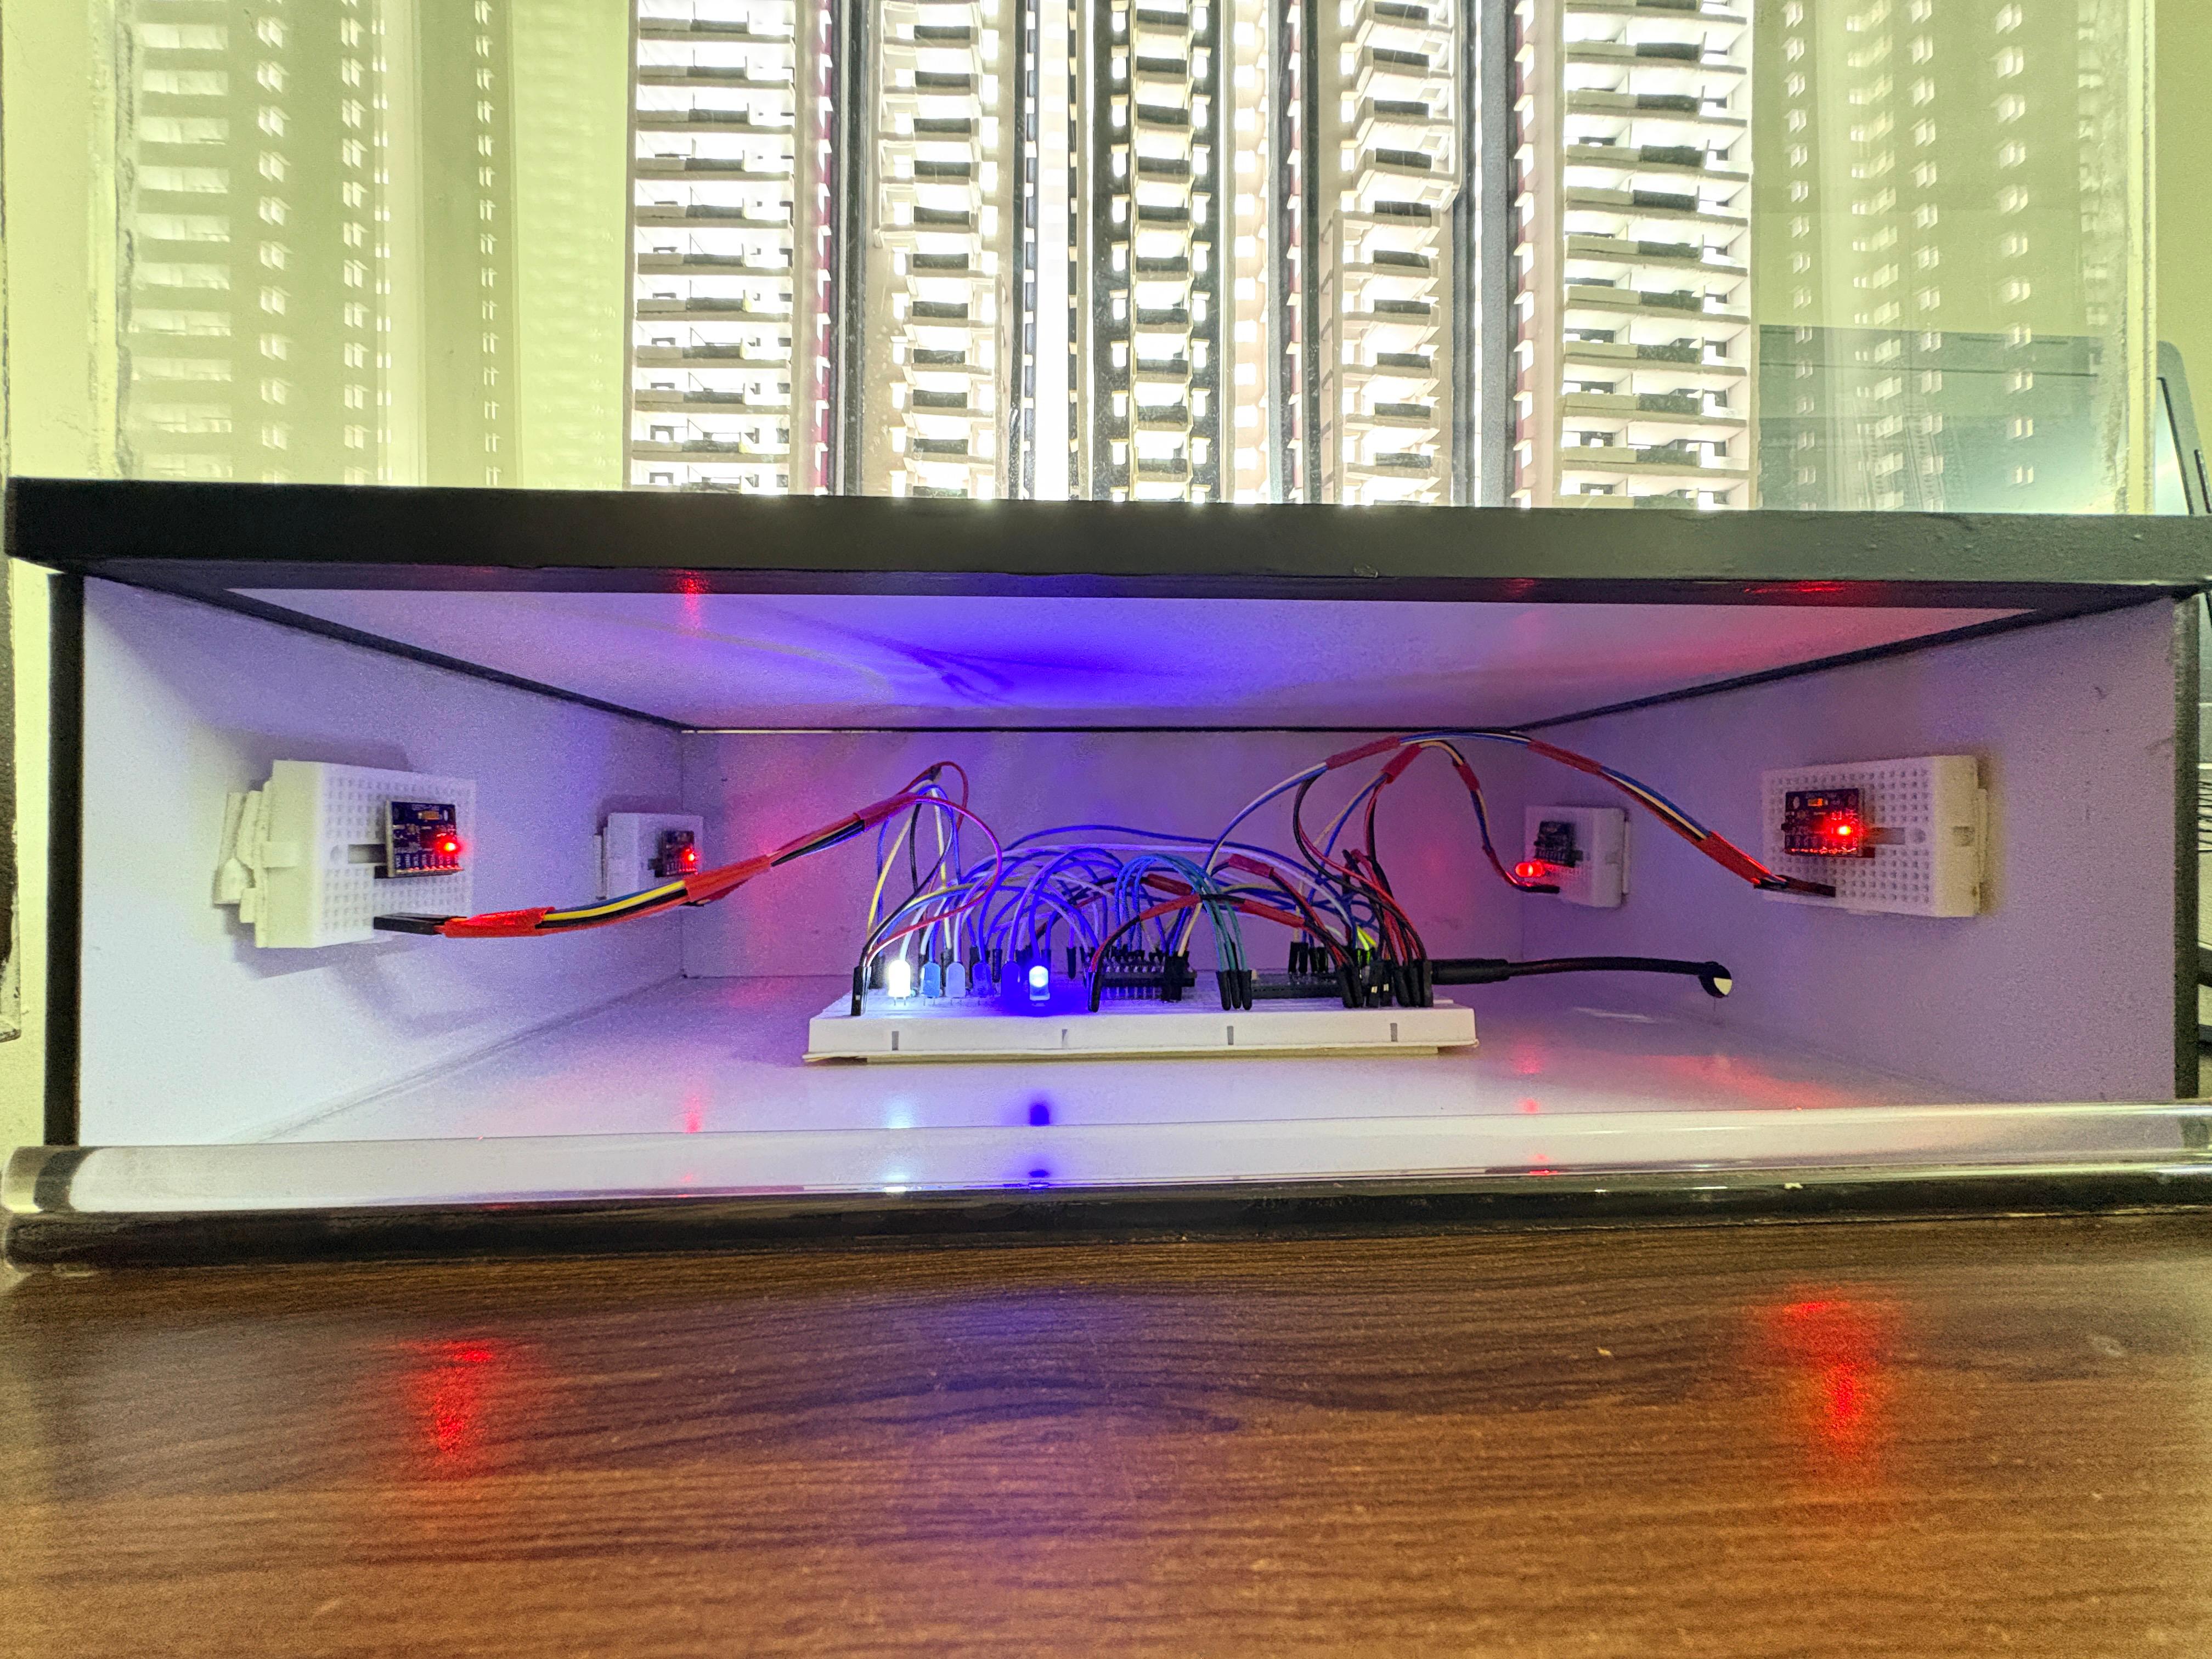
Internal hardware layout of the SAIM prototype showing distributed vibration sensors mounted inside the building model.
-
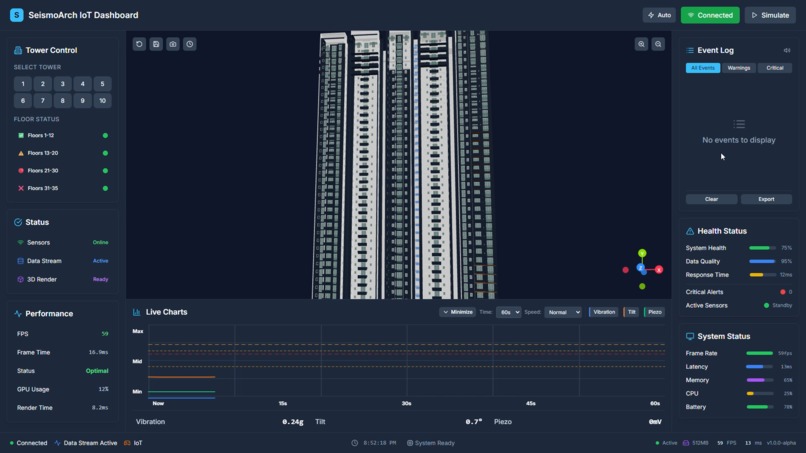
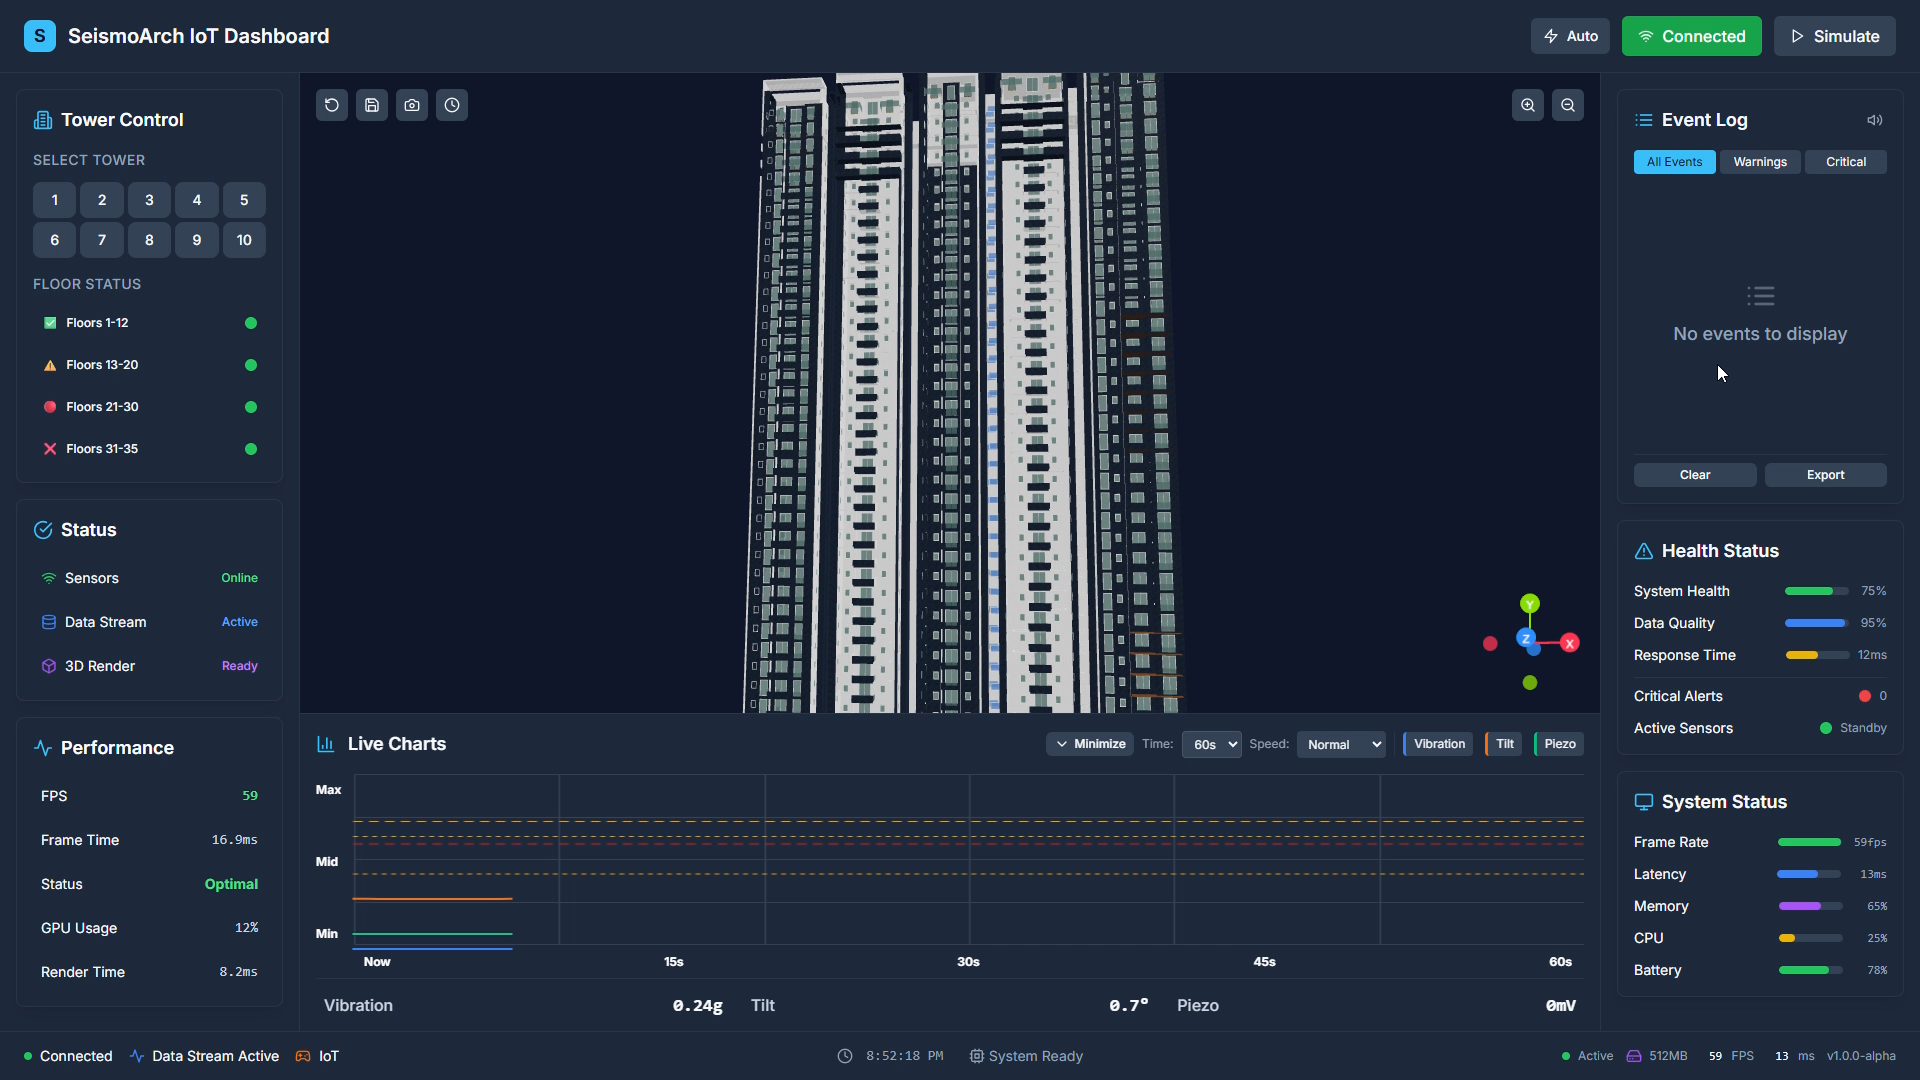
Real-time monitoring interface showing live vibration graphs, event logs, and system health indicators.
-
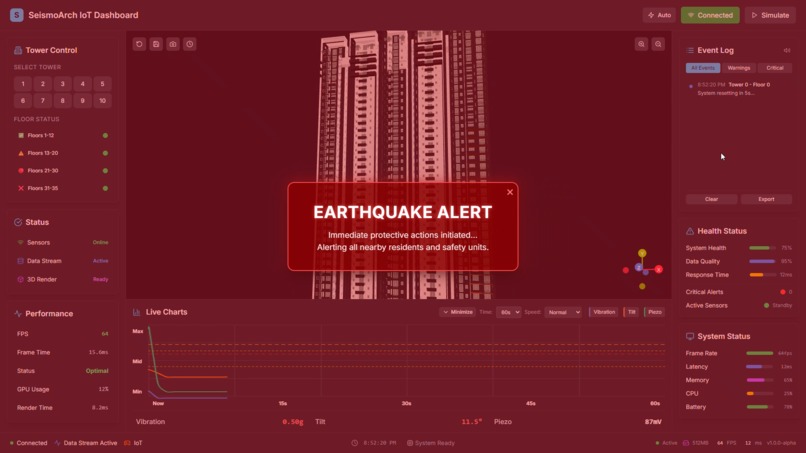
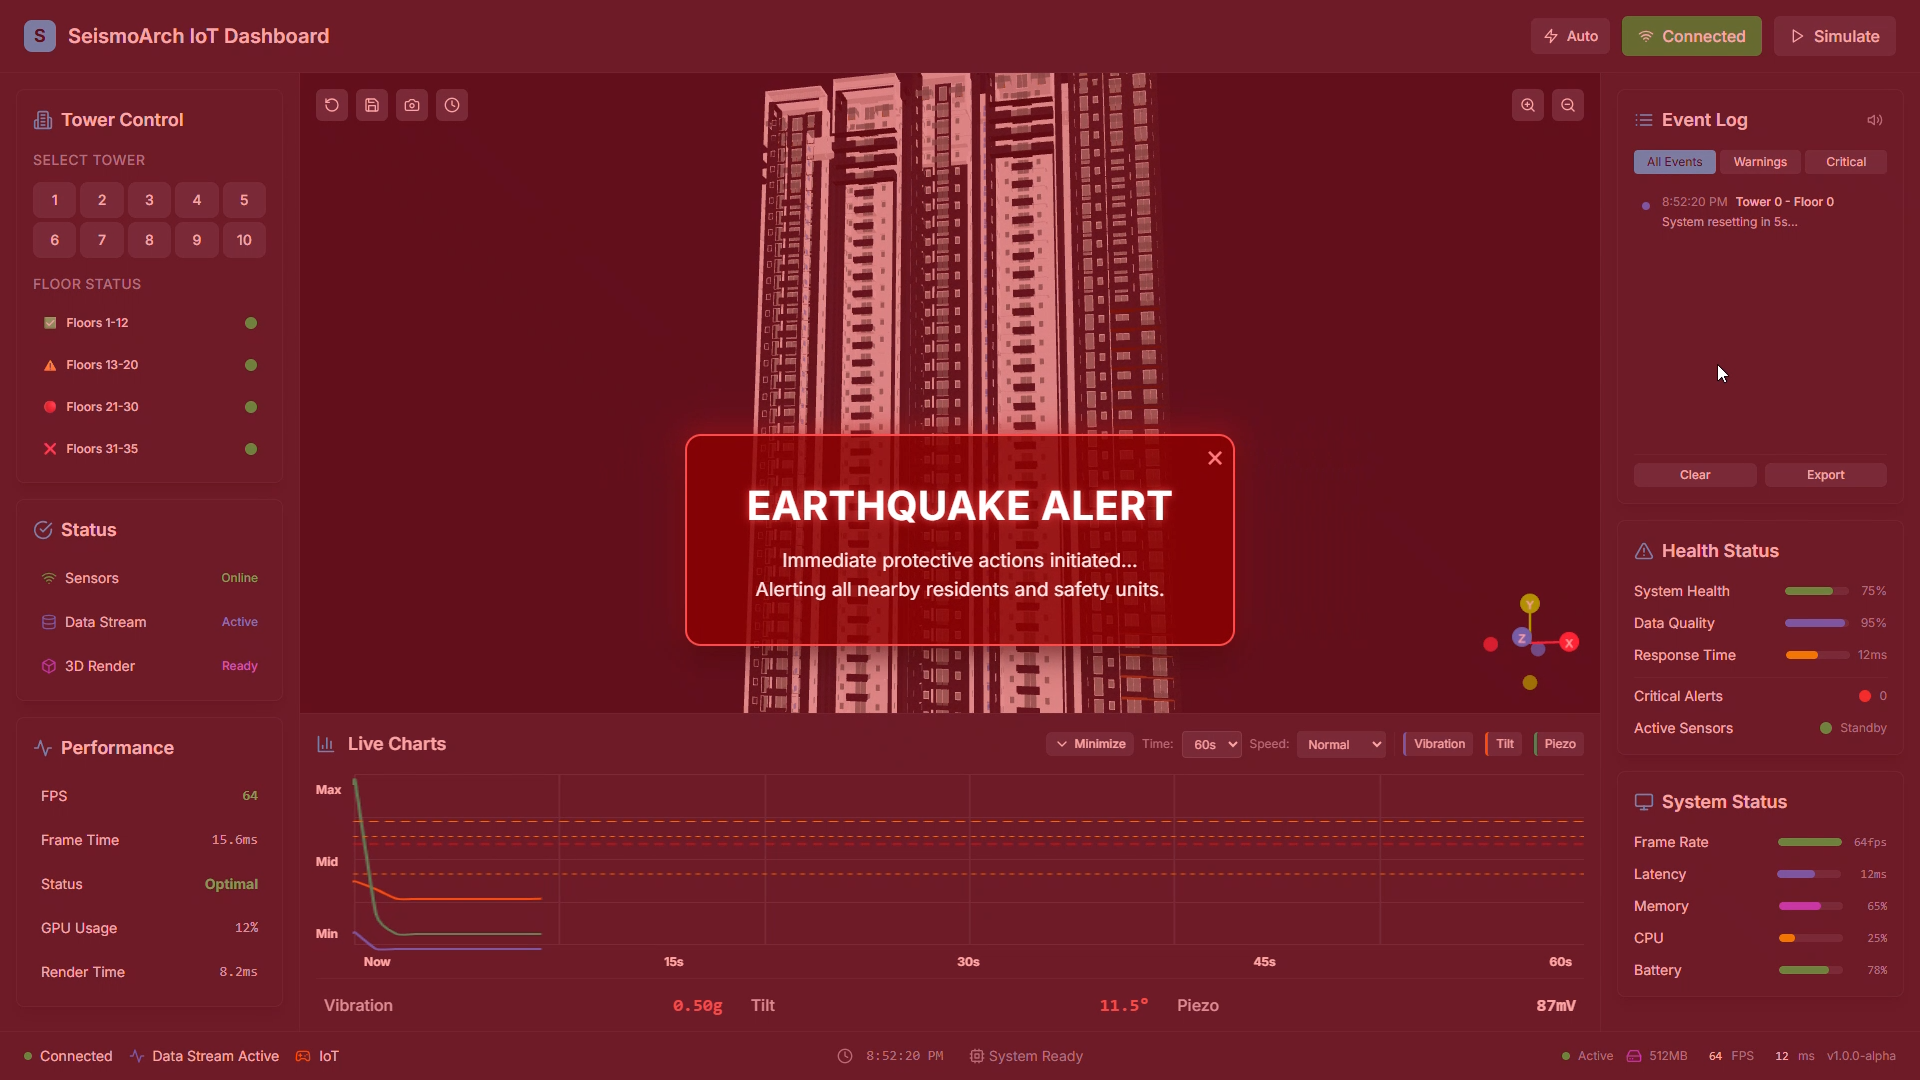
SeismoArch IoT dashboard displaying a simulated earthquake event and system-wide alert state during testing.
-
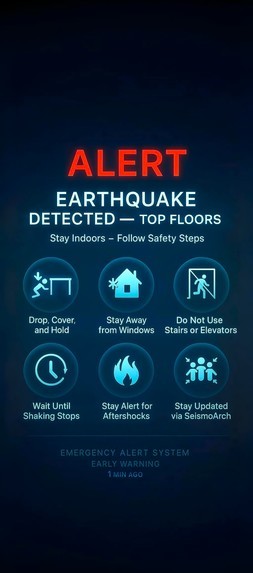
Mobile alert interface for upper-floor occupants, delivering tailored safety guidance based on floor-level risk during seismic events.
-
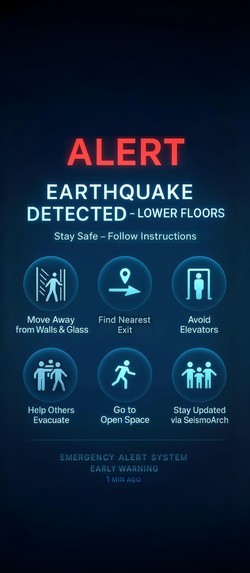
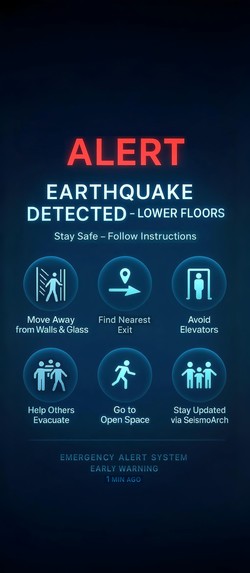
Mobile alert interface for lower-floor occupants, providing real-time earthquake warnings and location-specific safety instructions.
-
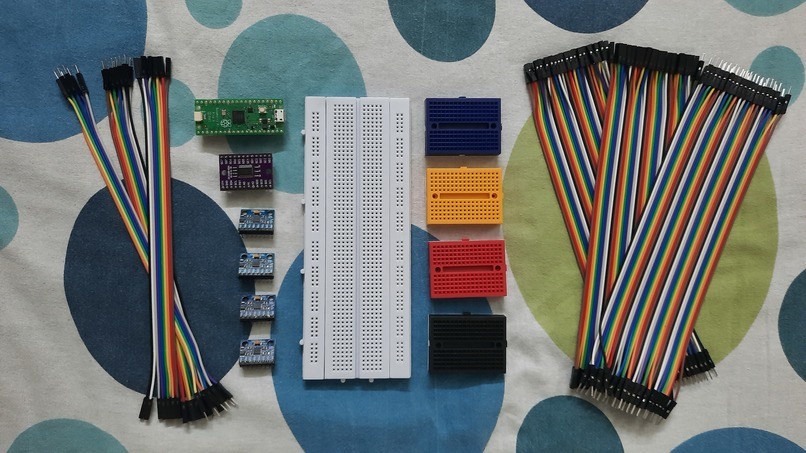
Core SAIM electronics: microcontroller, multiple vibration sensors, breadboards, and wiring prepared for distributed sensing.
-

Manual fabrication process used to create structural components, foamboards and hand-cutting tools used during model construction.
-
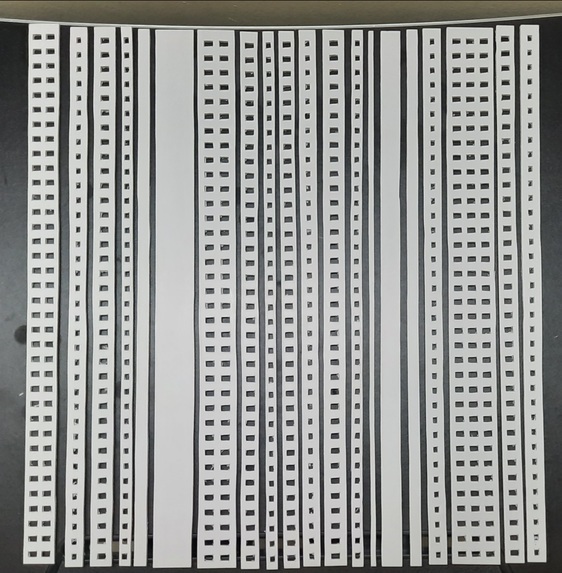
Base plates and vertical alignment elements hand-prepared to maintain uniform spacing and structural symmetry across floors.
-

Hand-cut and assembled structural floor panels used to construct the scaled multi-storey building model for vibration testing.
-
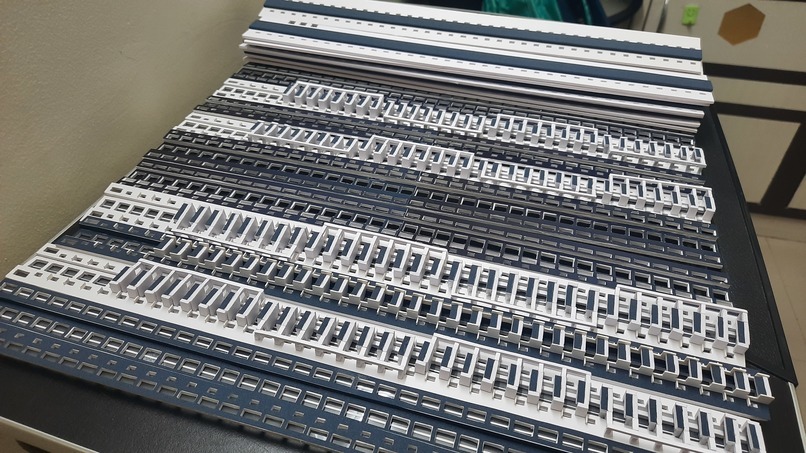
Individually fabricated wall and floor components arranged by floor level before manual assembly of the building model.
-

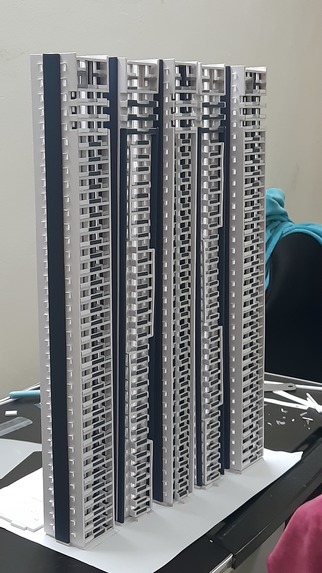
Manually assembled scaled building towers constructed layer by layer to replicate real building mass and height distribution.


Inspiration
Earthquakes cause injuries not only because of structural damage, but because people receive no warning before destructive shaking begins. Most existing warning systems operate at a regional level, which often delays alerts for individual buildings where people actually live, study, and work.
We were inspired by a simple question: what if buildings themselves could detect danger early and react instantly? SeismoArch IoT Model was created to explore how localized, low-cost sensing can improve disaster preparedness and reduce injury risk during seismic events.
What it does
SeismoArch IoT Model is a building-level earthquake early-warning and monitoring system.
The system continuously monitors structural vibrations using distributed sensors. By detecting early seismic signals (P-waves) directly at the building, SeismoArch can trigger alerts before the arrival of destructive shaking (S-waves).
Key capabilities include:
- Real-time vibration, tilt, and motion monitoring
- Early-warning alerts based on seismic signal patterns
- Live dashboard for visualization, alerts, and system health
- Simulation mode for testing and demonstration
The focus is on early awareness, faster response, and human safety.
How we built it
SeismoArch is built as an end-to-end IoT system combining hardware sensing, real-time data processing, and a cloud-connected dashboard.
Vibration sensors are placed at the base of the structure to capture early seismic motion from any direction. Sensor data is processed in real time and streamed to a monitoring dashboard via cloud services. When abnormal seismic patterns are detected, alerts are triggered automatically and logged for analysis.
The dashboard provides:
- Live charts for sensor data
- Event logs with warning and critical classifications
- System health and performance monitoring
- Interactive structural visualization
The system is designed to be lightweight, scalable, and deployable in homes, apartments, schools, and hospitals.
Challenges we ran into
- Differentiating meaningful seismic signals from environmental noise
- Ensuring real-time responsiveness with minimal delay
- Integrating hardware data with a reliable cloud-based dashboard
- Designing a system that remains clear and usable under emergency conditions
These challenges required careful tuning, testing, and system-level thinking.
Accomplishments that we're proud of
- Built a working, real-time IoT prototype, not just a concept
- Successfully demonstrated early-warning logic using seismic principles
- Designed a dashboard that supports both live data and simulation
- Created a scalable architecture suitable for real-world deployment
What we learned
- Early-warning systems depend as much on engineering reliability as intelligence
- Hardware-based systems expose problems quickly, encouraging better design
- Clear visualization and simplicity matter in safety-critical applications
- Small improvements in response time can have a large impact on safety
What's next for SeismoArch IoT Model
Future work includes:
- Integrating machine learning for adaptive signal classification
- Expanding sensor networks for larger structures and campuses
- Field testing in real-world environments
- Exploring integration with smart city and emergency response systems
SeismoArch aims to contribute to safer, more resilient infrastructure through accessible and intelligent monitoring.
Live Dashboard (Recommended: Full Screen)
This link opens the real-time SeismoArch monitoring dashboard.
The dashboard loads instantly. The structural model may take 10–30 seconds to load depending on internet speed.
Since the dashboard is not connected to the physical prototype in this deployment, system behavior can be demonstrated using the Simulate button in the top-right corner.
Dashboard Capabilities
Structural Visualization
- Interactive structural model for situational awareness
- Controls: right-click drag to rotate, Ctrl/Shift + right-click to move
- Scene management allows saving, reordering, and timing different viewpoints
Tower Control
- Select individual towers to view live sensor charts
- Selecting multiple towers displays the average of selected readings
- No selection defaults to all-tower aggregation
Live Monitoring
- Real-time vibration, tilt, and piezoelectric data
- Charts are minimized by default and can be expanded for detailed analysis
- Time window, playback speed, and signal type are adjustable
Event & Alert System
- Event log records all sensor data
- Events categorized as normal, warning, or critical
- Logs can be cleared or exported as CSV
System Health & Performance
- Sensor health, data quality, and response time monitoring
- Performance metrics including FPS, latency, CPU, memory, and GPU usage
- Status indicators show data stream, sensor, and render activity
System Status Bar
- Displays current system time and runtime state
Note: Some features require a live physical sensor connection and may be limited when using simulation mode.
Log in or sign up for Devpost to join the conversation.