-
-

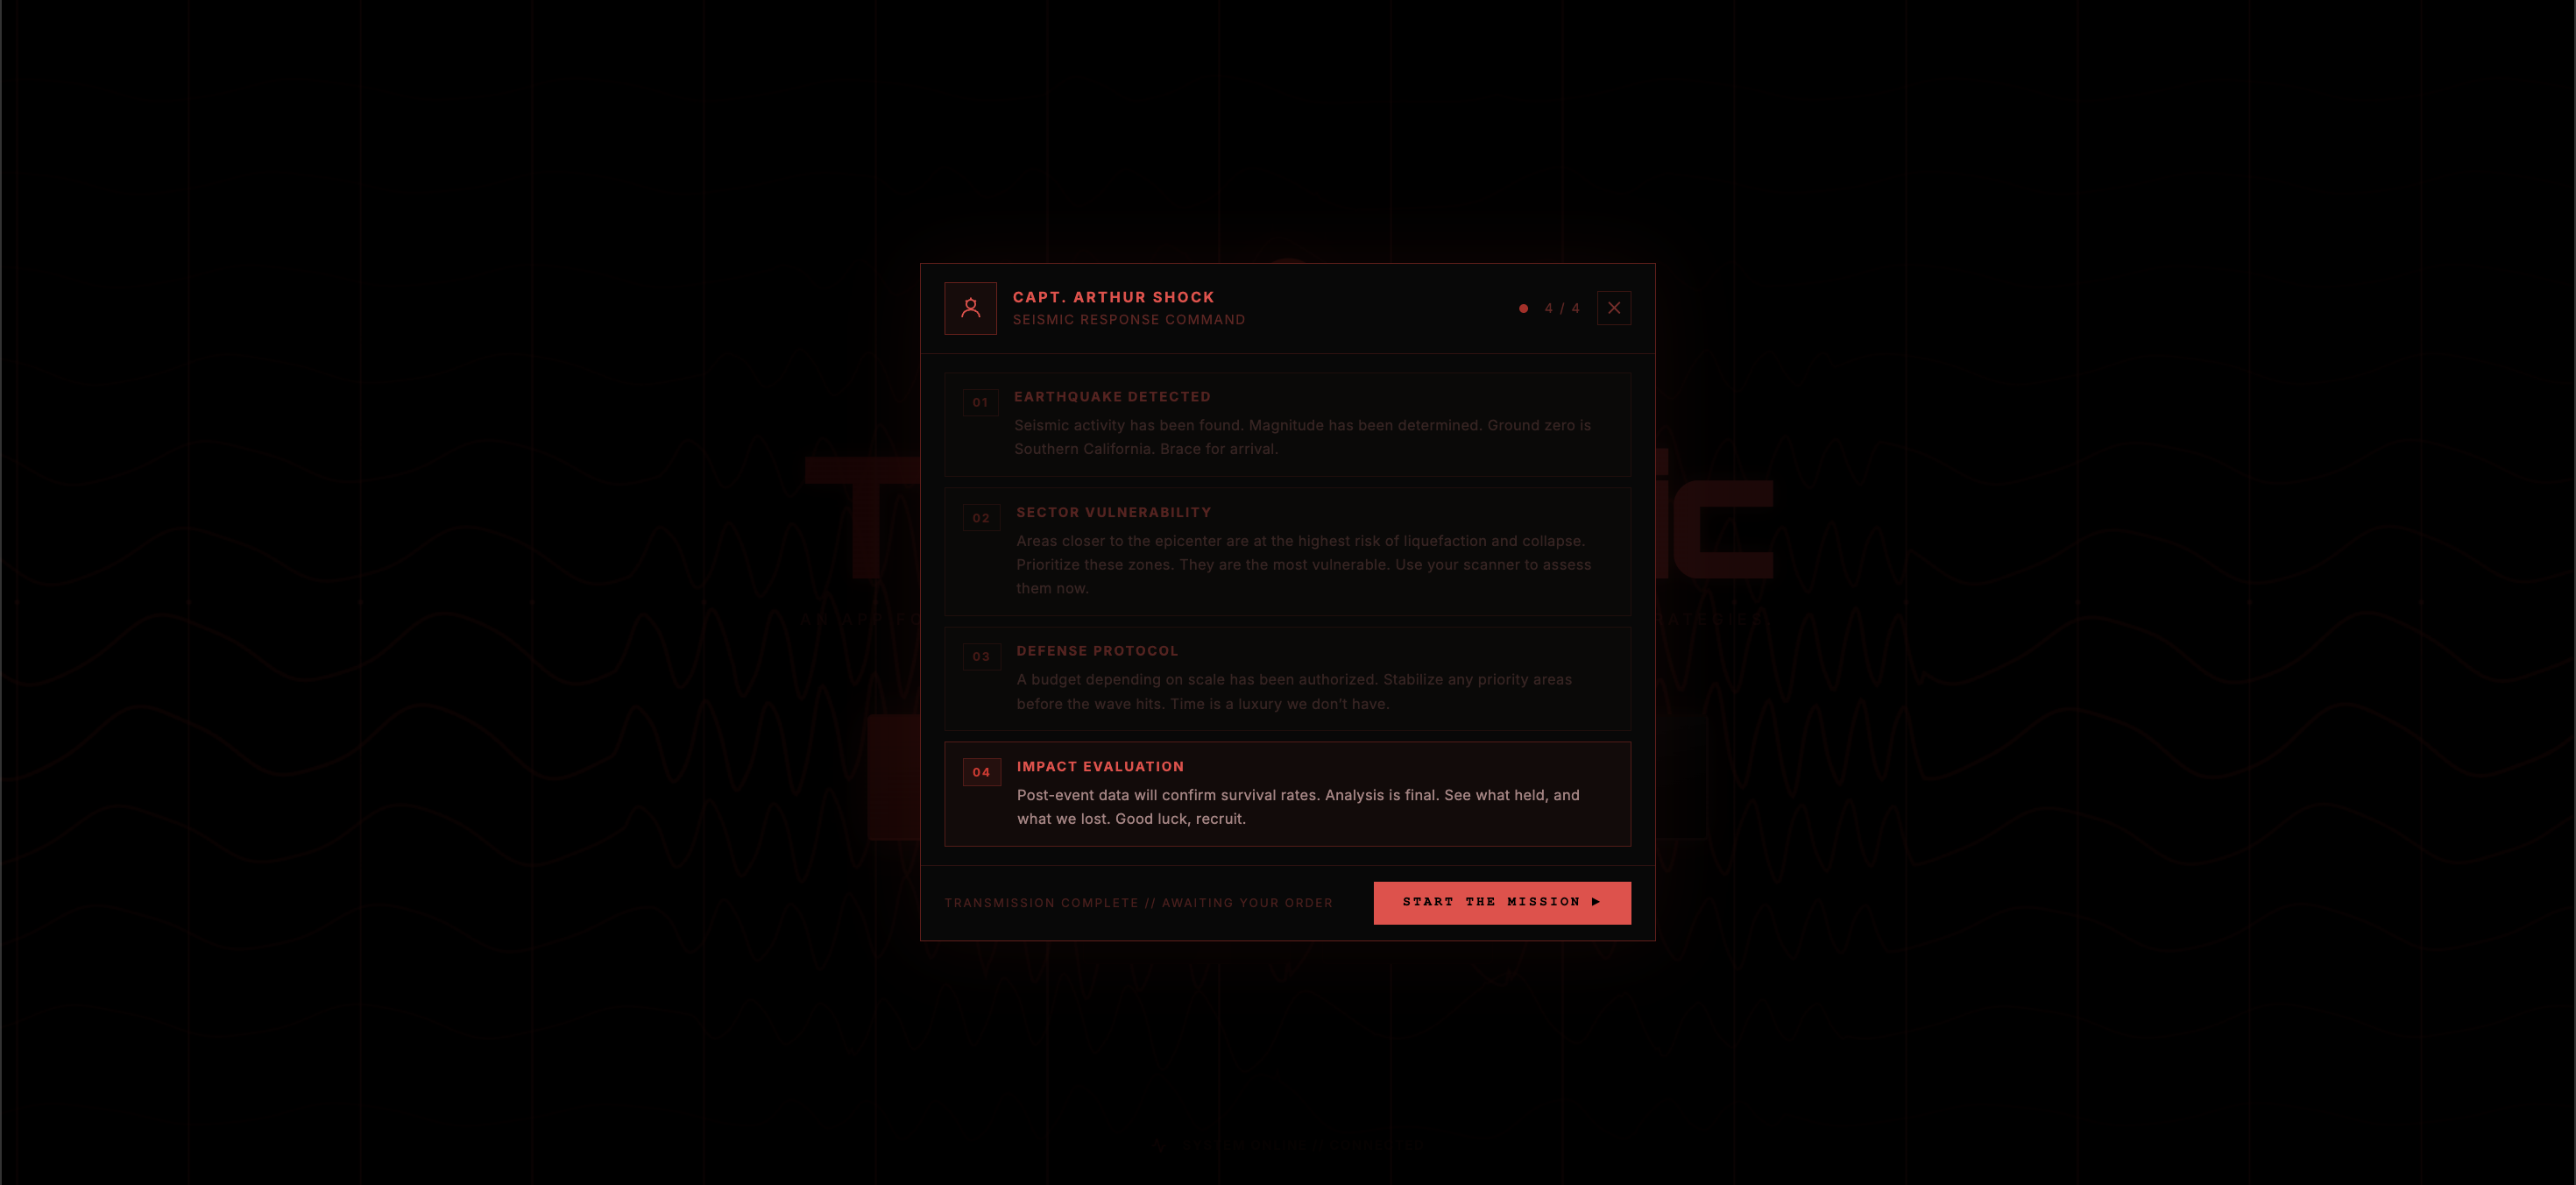
Mission Control Briefing
-
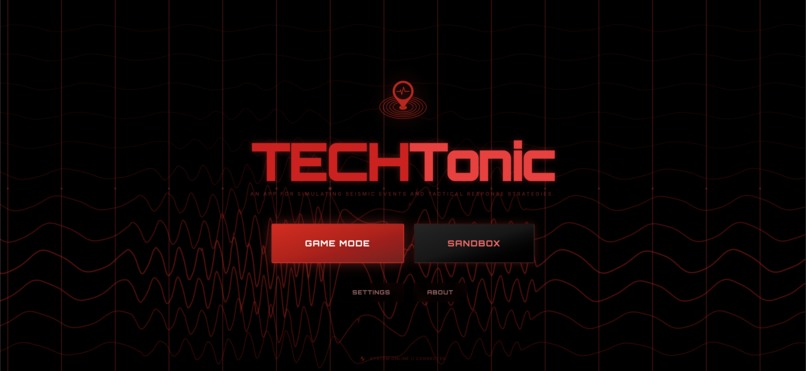
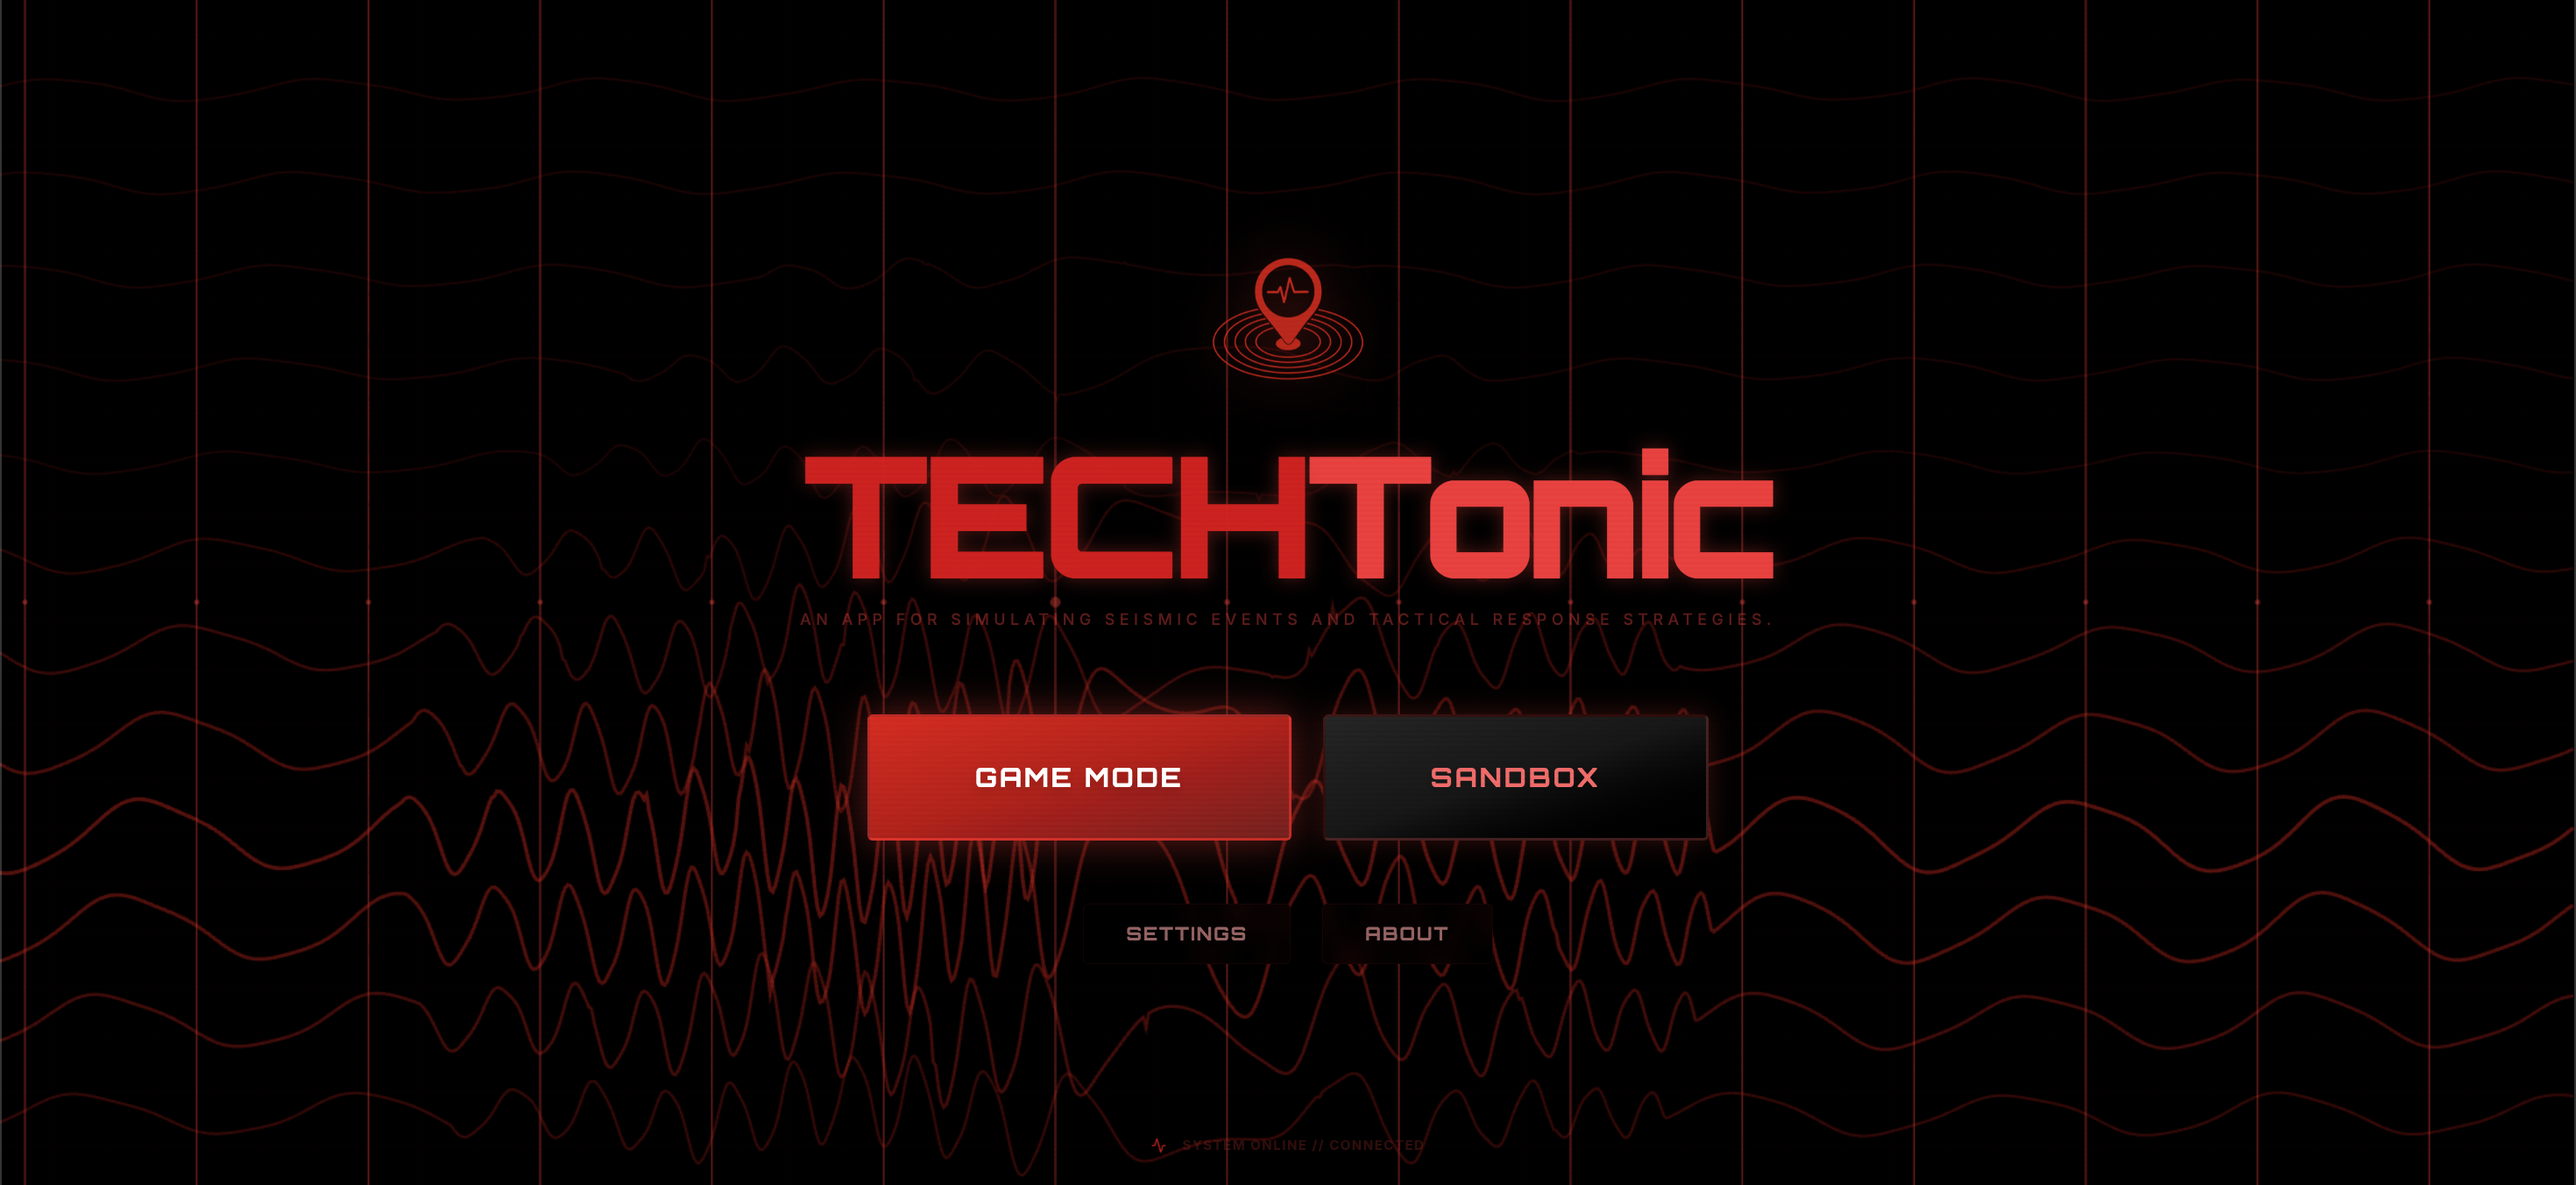
Interactive Launch Interface
-
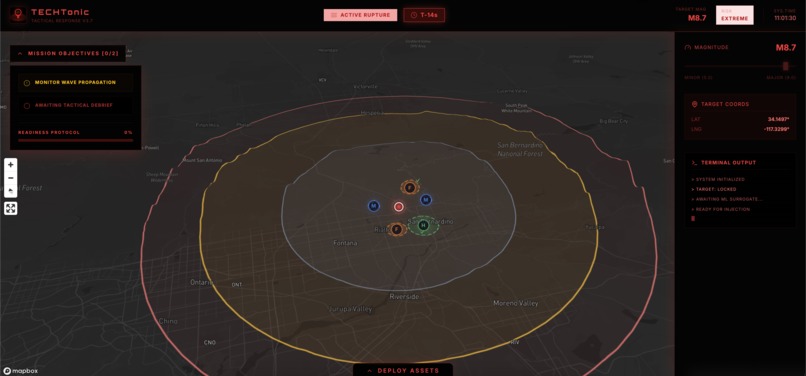
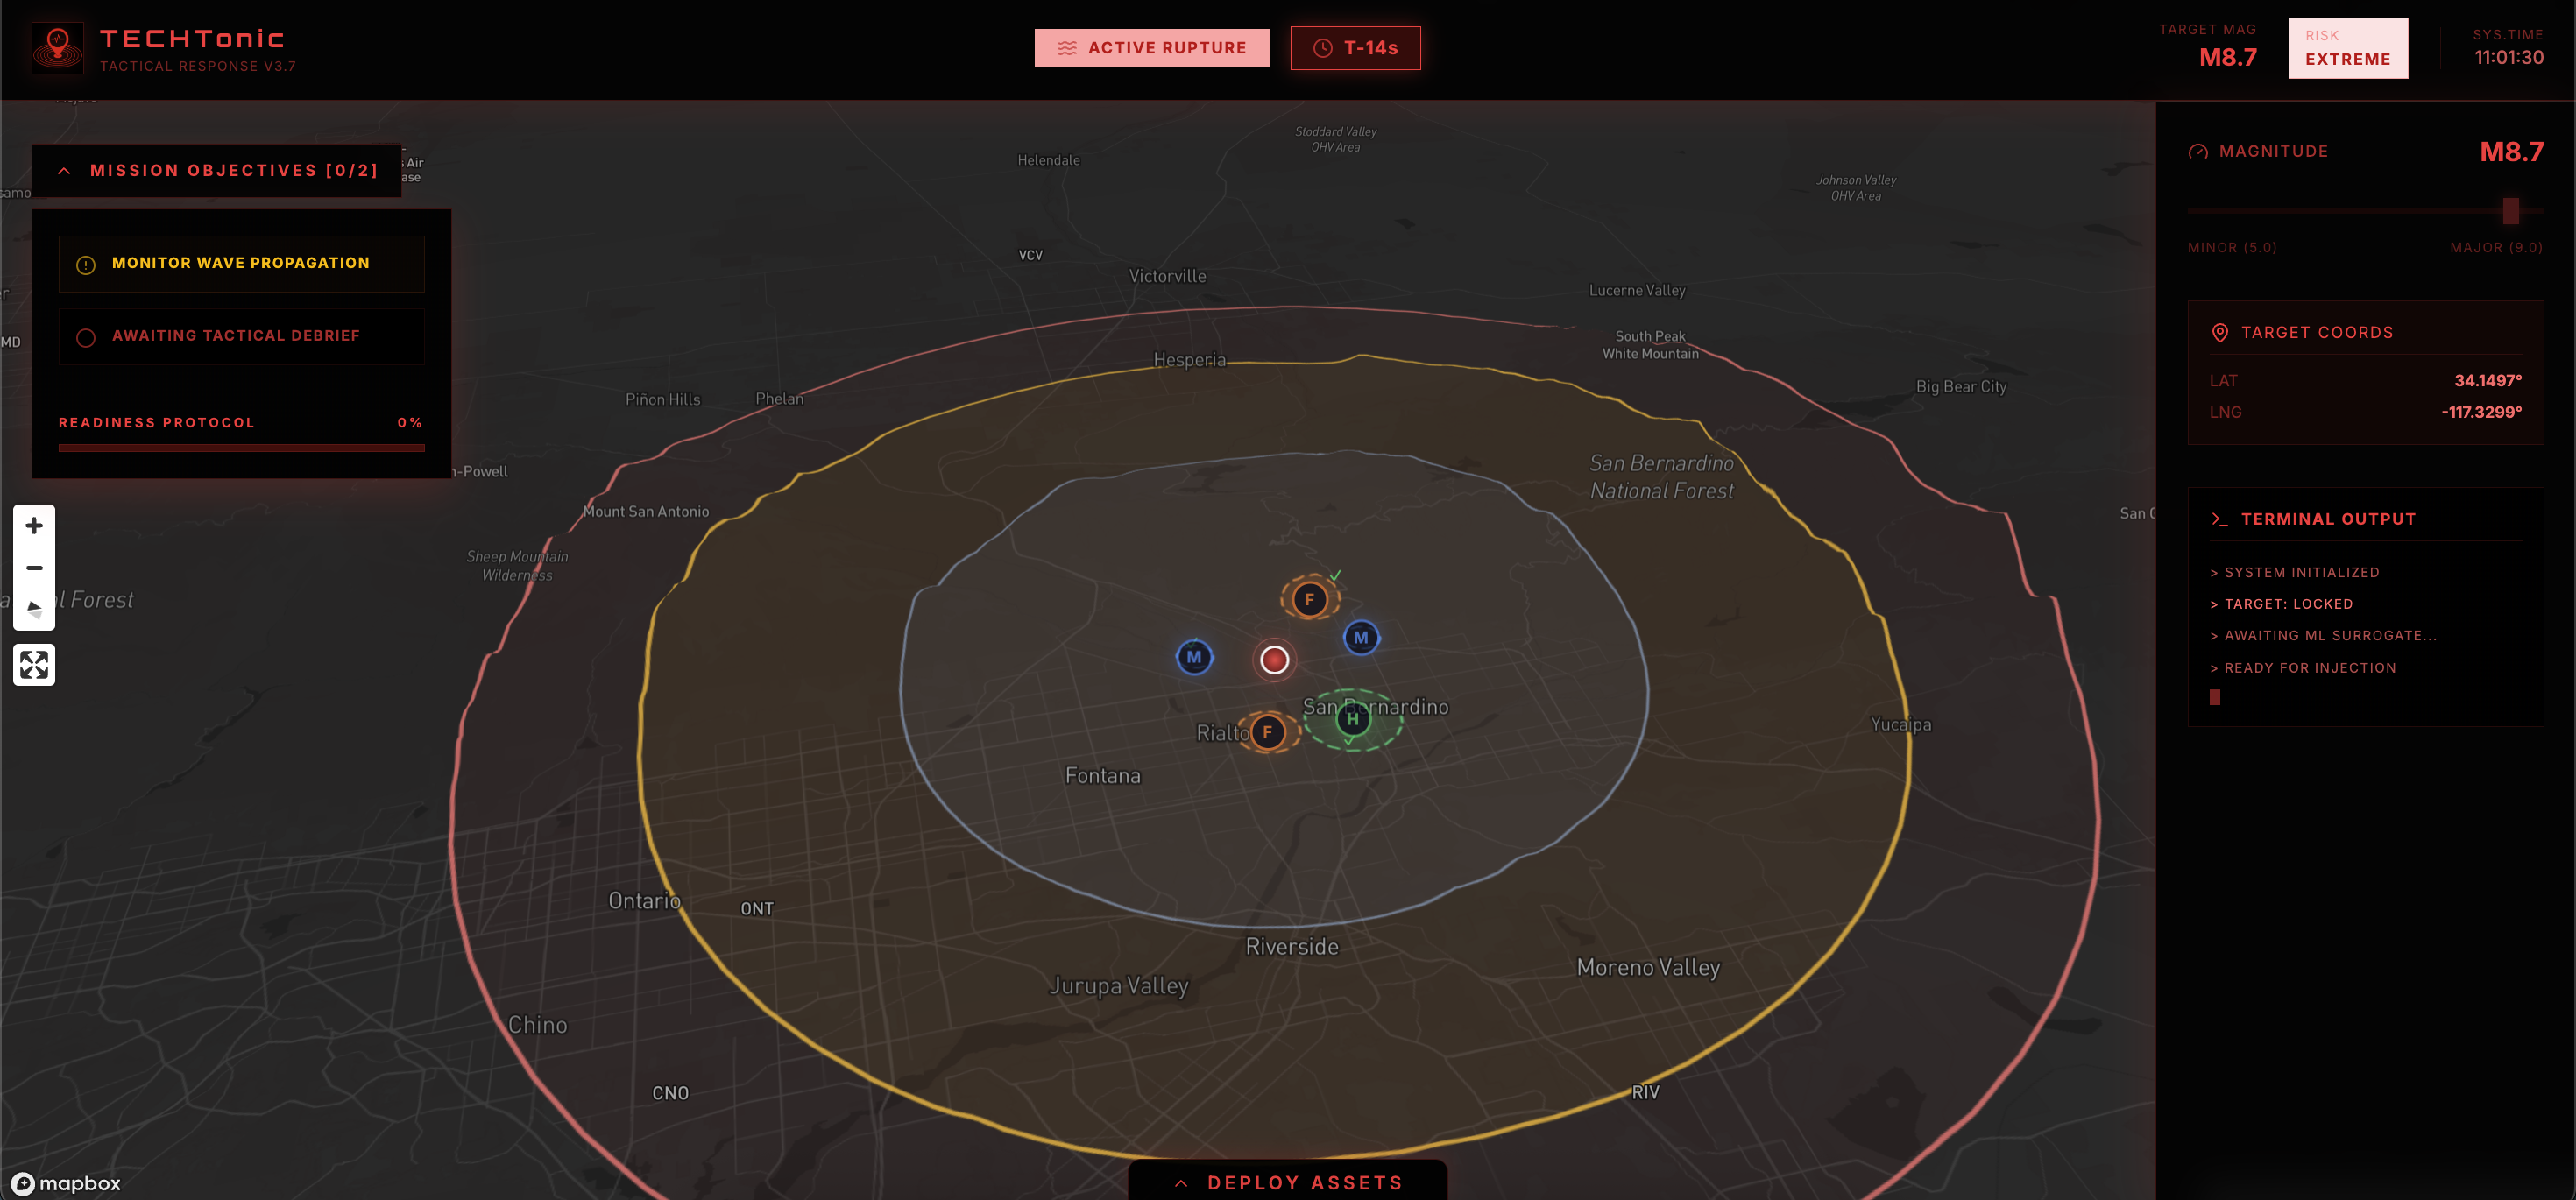
Real-Time Seismic Propagation Engine
-
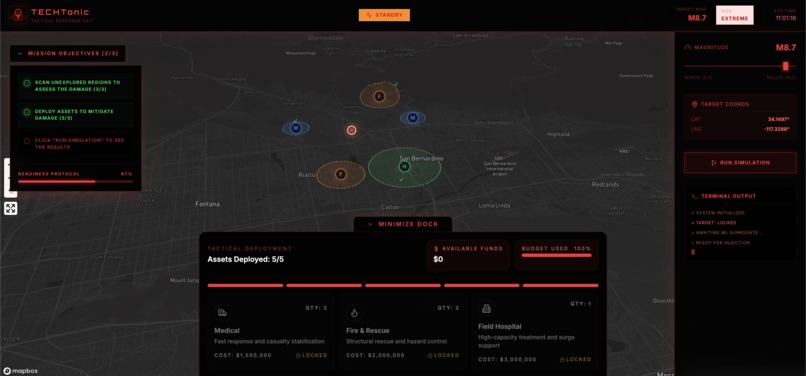
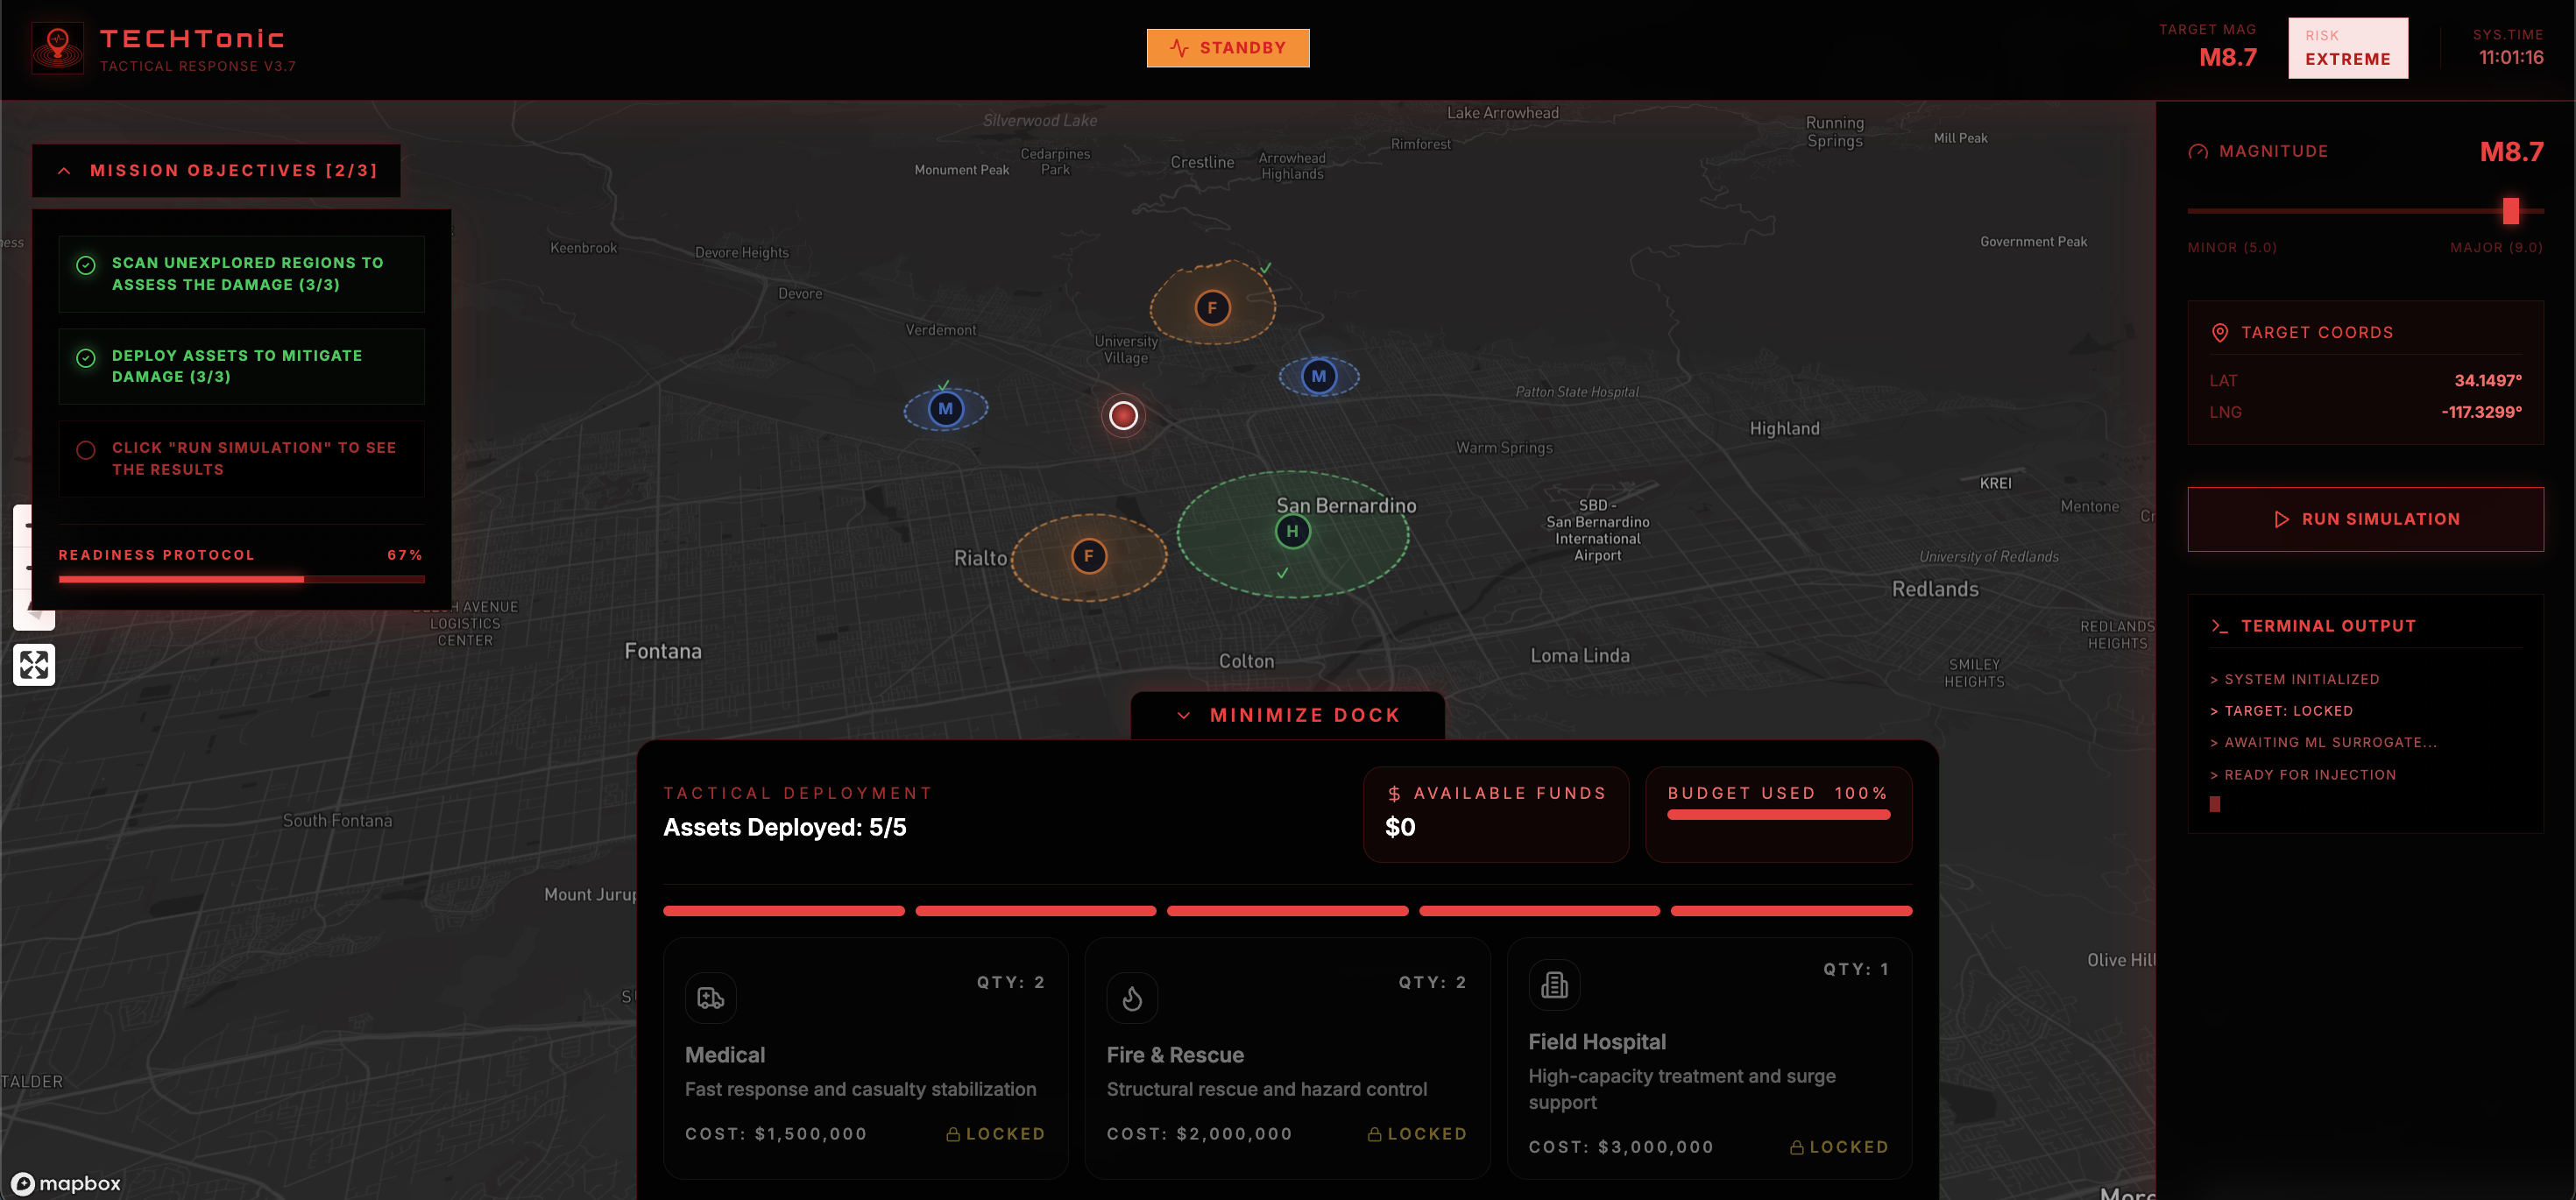
Tactical Resource Deployment System
-
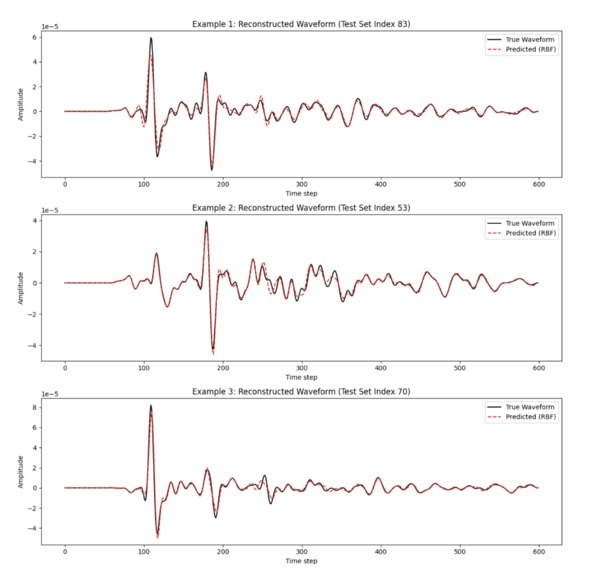
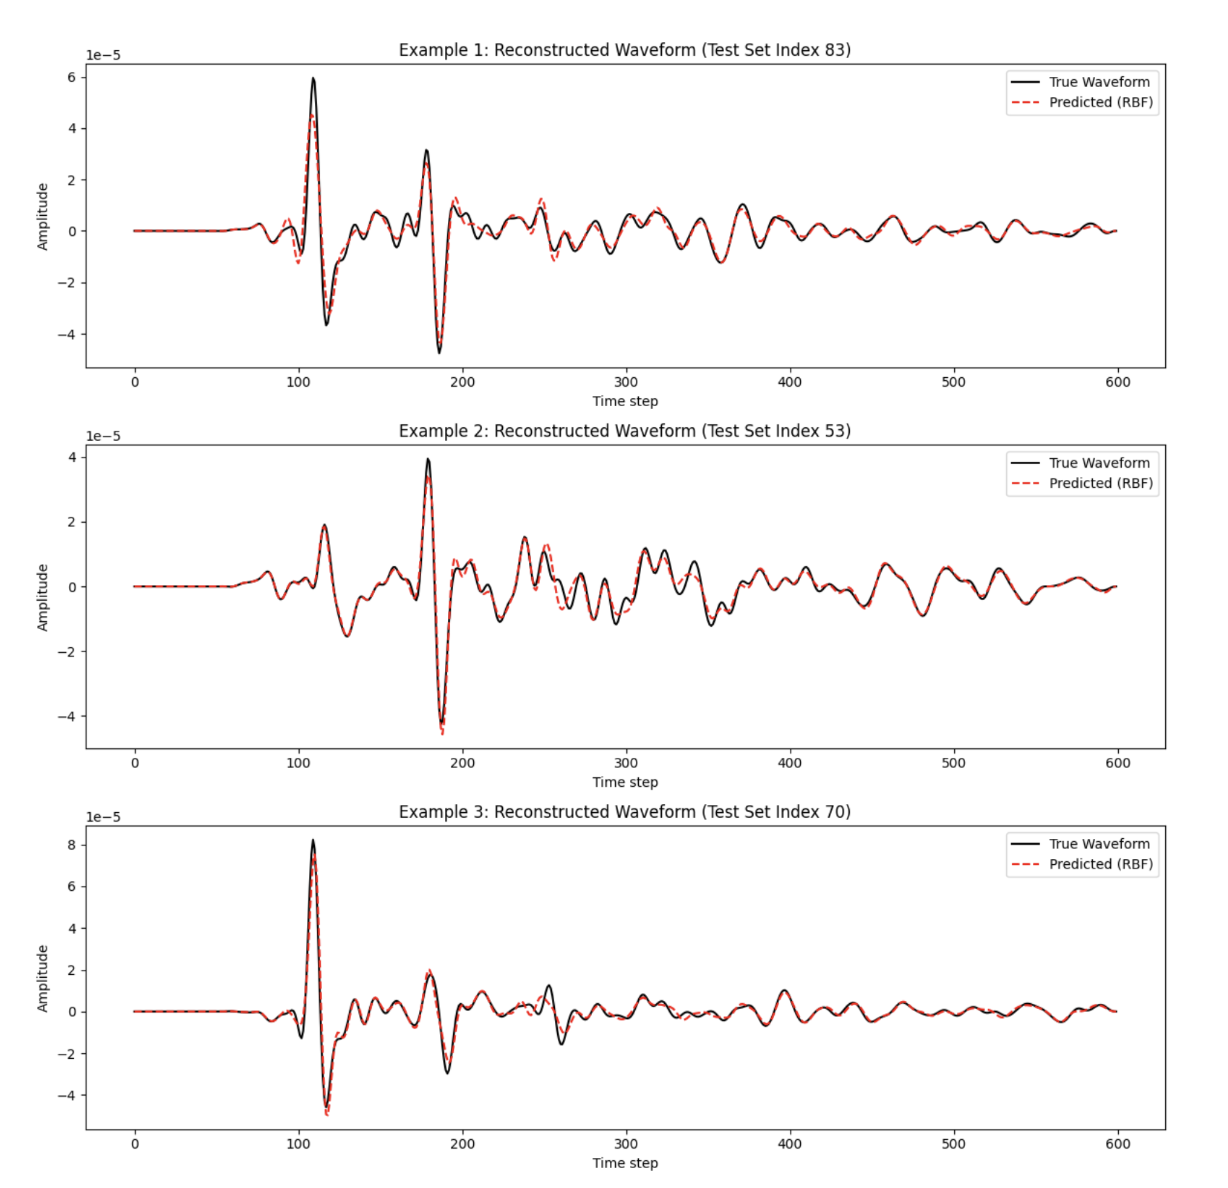
Model Validation & Waveform Reconstruction
Project Story: TECHTonic
Inspiration
Our team’s connection to earthquakes is personal. One of our members is from Indonesia, a region frequently impacted by seismic activity, while the rest of us are Californians, where earthquakes are always a possibility. We’ve all participated in drills like the Great ShakeOut, but there’s still a constant sense of uncertainty: are we actually prepared?
For some of us, this fear is rooted in real experiences. One teammate’s mom lived through a devastating earthquake in Mexico, where people didn’t even realize earthquakes were possible in their region. It made us think about how access to information, and the lack of it, can completely change outcomes.
We wanted to build something that transforms that uncertainty into understanding by turning invisible seismic processes into something users can see, explore, and respond to in real time.
What it does
TECHTonic is an interactive, gamified earthquake simulation platform that helps users understand seismic impact and make informed emergency response decisions.
- Users can place an epicenter anywhere in Southern California and simulate earthquakes ranging from - magnitude 5.0 to 9.0
- The system generates real-time seismic wave propagation using a data-driven surrogate model trained on Scripps Institution of Oceanography seismic waveform data
- Wave behavior dynamically adapts based on location, magnitude, and regional geophysical conditions, producing realistic variation in impact across terrain
- Users can strategically deploy emergency resources within a fixed budget to minimize damage
- Resource effectiveness decreases with distance from the epicenter, encouraging thoughtful and optimized decision-making
The simulation models wave intensity using normalized ground motion values:
$$ \text{Intensity} = \frac{\text{PGV}}{\max(\text{PGV})} $$
At the end of each simulation, users receive:
- Lives Saved
- Asset Efficiency
- Model Confidence Score
- Event Summary
- AI-generated insights (via Gemini)
Users can also explore different regions before deploying resources using AI-powered analysis, which surfaces contextual information such as population density, infrastructure exposure, and environmental risk factors.
How we built it
We built TECHTonic as a full-stack system combining machine learning, geospatial visualization, and generative AI:
- Frontend: React, TypeScript, Vite, and Mapbox GL JS for interactive 3D mapping and real-time visualization
- Backend: Python (FastAPI) to handle simulation logic and high-performance API requests
- Machine Learning: A reduced-order surrogate model trained on Scripps seismic waveform data, using dimensionality reduction (POD/SVD) and interpolation to approximate earthquake wave propagation in real time
- AI Integration: Google Gemini API for region analysis and post-simulation insights
- Audio & Immersion: ElevenLabs API for dynamic sound effects and enhanced realism
Rather than running computationally expensive physics simulations, we leverage the structure of the Scripps dataset to learn how seismic waves behave across space, and reconstruct realistic waveforms instantly for new epicenters. This enables real-time interaction while preserving physically grounded behavior.
We modeled wave expansion dynamically over time:
$$ r(t) = v \cdot t $$
where ( r(t) ) represents wave radius and ( v ) represents propagation speed.
The simulation also incorporates geophysical and socio-economic telemetry, including peak ground velocity, aftershock likelihood, estimated economic loss, and displacement impact.
Challenges we ran into
One of our biggest challenges was collaboration. With multiple team members working simultaneously, we encountered frequent Git merge conflicts. This forced us to improve communication and coordinate more effectively as a team.
We also faced technical challenges integrating the FastAPI backend with the React and Mapbox frontend in real time, ensuring that wave propagation and simulation outputs aligned correctly with the underlying models while maintaining smooth performance.
Balancing realism with speed was another major challenge, as we needed to transform high-dimensional seismic data into something that could be rendered and interacted with instantly.
Accomplishments that we're proud of
- We transformed real Scripps seismic data into an interactive system that users can explore and learn from
- We created a highly immersive and intuitive UI/UX that feels dynamic, responsive, and engaging
- We implemented real-time wave propagation with data-driven variation across geography
- We successfully combined machine learning, geospatial systems, and generative AI into a cohesive platform
- We built a tool that bridges the gap between complex seismic data and intuitive, actionable understanding
What we learned
This project pushed us beyond just coding:
- We learned how to collaborate effectively under pressure in a hackathon environment
- We improved our full-stack debugging and system integration skills
- We gained hands-on experience working with real scientific datasets and machine learning models
- We learned how to translate complex geophysical data into intuitive visual experiences
- We developed a deeper understanding of how to build user-centered tools with real-world impact
What's next for TECHTonic
We see this as just the beginning.
Next steps include:
- Expanding simulations beyond Southern California to other regions globally
- Improving ML surrogate accuracy using additional training data and validation
- Adding more advanced emergency response scenarios and resource types
- Integrating richer real-world datasets to further enhance realism
Our goal is to evolve TECHTonic into a platform that not only educates, but actively helps individuals and communities better understand and prepare for real-world disasters.


Log in or sign up for Devpost to join the conversation.