-
Edge Detection & Clustering
Inspiration
Data analytics most closely aligns with our team interests - theoretical computer science, machine learning, and lots of python!
What it does
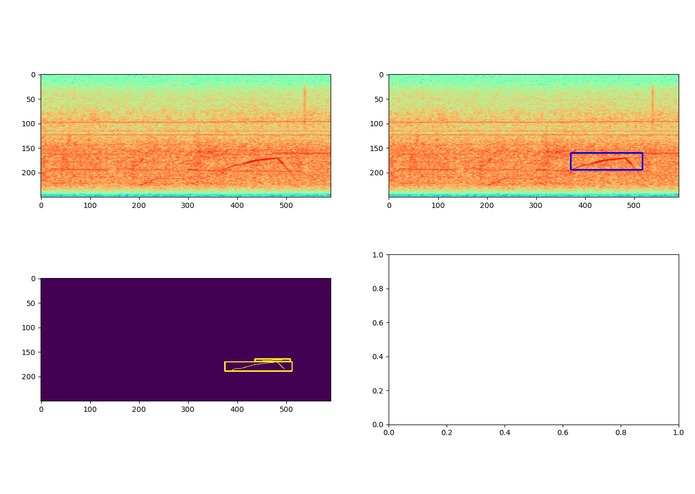
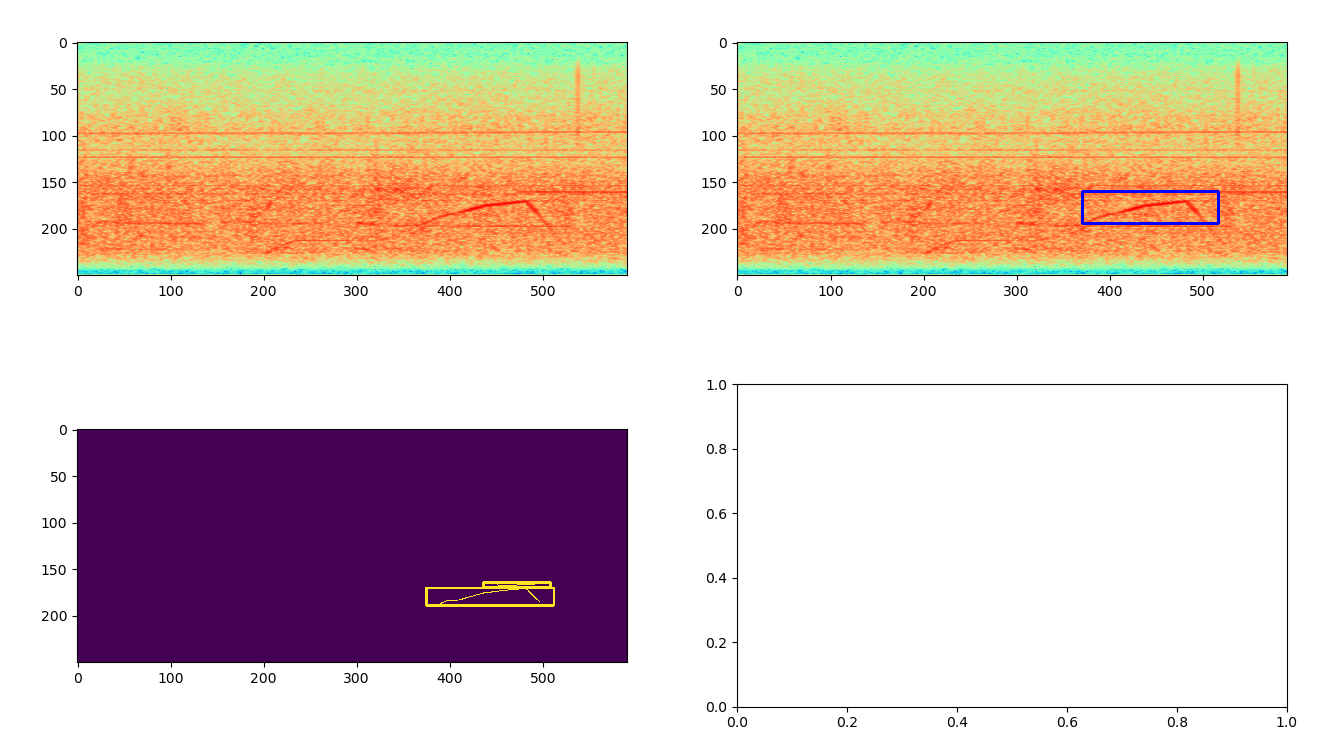
We use edge detection to identify seismic activity.
How we built it
The models we used include: Sobel, Canny, fast Fourier transform, K-means clustering, The packages we used: openCV, scikit learn,
Challenges we ran into
While the appropriate curves are easily detectable by eye, it was hard to get our algorithms to do the same. We encountered many false positives, specifically with horizontal lines (whereas the correct curves followed a more sinusoidal pattern).
Accomplishments that we're proud of
We sifted through many different computer vision models to see which detected curves the best. We ended up using a combination of a few filters.
What we learned
Various edge detection techniques and filters.
What's next for Seismic Sinusoids
Find a way to detect less sharp edges. Come up with better clustering techniques.

Log in or sign up for Devpost to join the conversation.