
Inspiration
Anyone who studies at Concordia or most other universities knows the struggle of finding a place to sit down and work, especially when you're with a group. It almost feels like a never-ending scavenger hunt, eventually just leading to you parking down at some subpar spot where you can barely even sit down, let alone spread out your work and study in an efficient manner. On a congested downtown campus shared not only by Concordia students but also by people from across the city and nearby schools, it's surprising how much time is wasted just wandering around.
This frustration got us thinking: what if students didn't have to guess anymore? What if there was a way to see, LIVE, which areas of campus were actually busy and which ones were quietly available at any given moment?
Campuses are already filled with infrastructure such as security cameras which are able to capture real time activity. Leveraging these live feeds, computer vision techniques can be used to analyze human traffic, allowing us to estimate congestion across different study spaces. This insight could be especially powerful in libraries and group study rooms, where reservations often go unused due to no-shows (freeing the room up to be used by everyone else after 15 mins of waiting), or people leaving their rooms early, wasting valuable empty space while many students continue searching.
That's why we built Concordia Vision, a campus monitoring platform designed to help students seamlessly find the best place to study. By turning real time data into actionable insights, our solution helps students spend less time searching, and more time focusing on what actually matters.
What it does
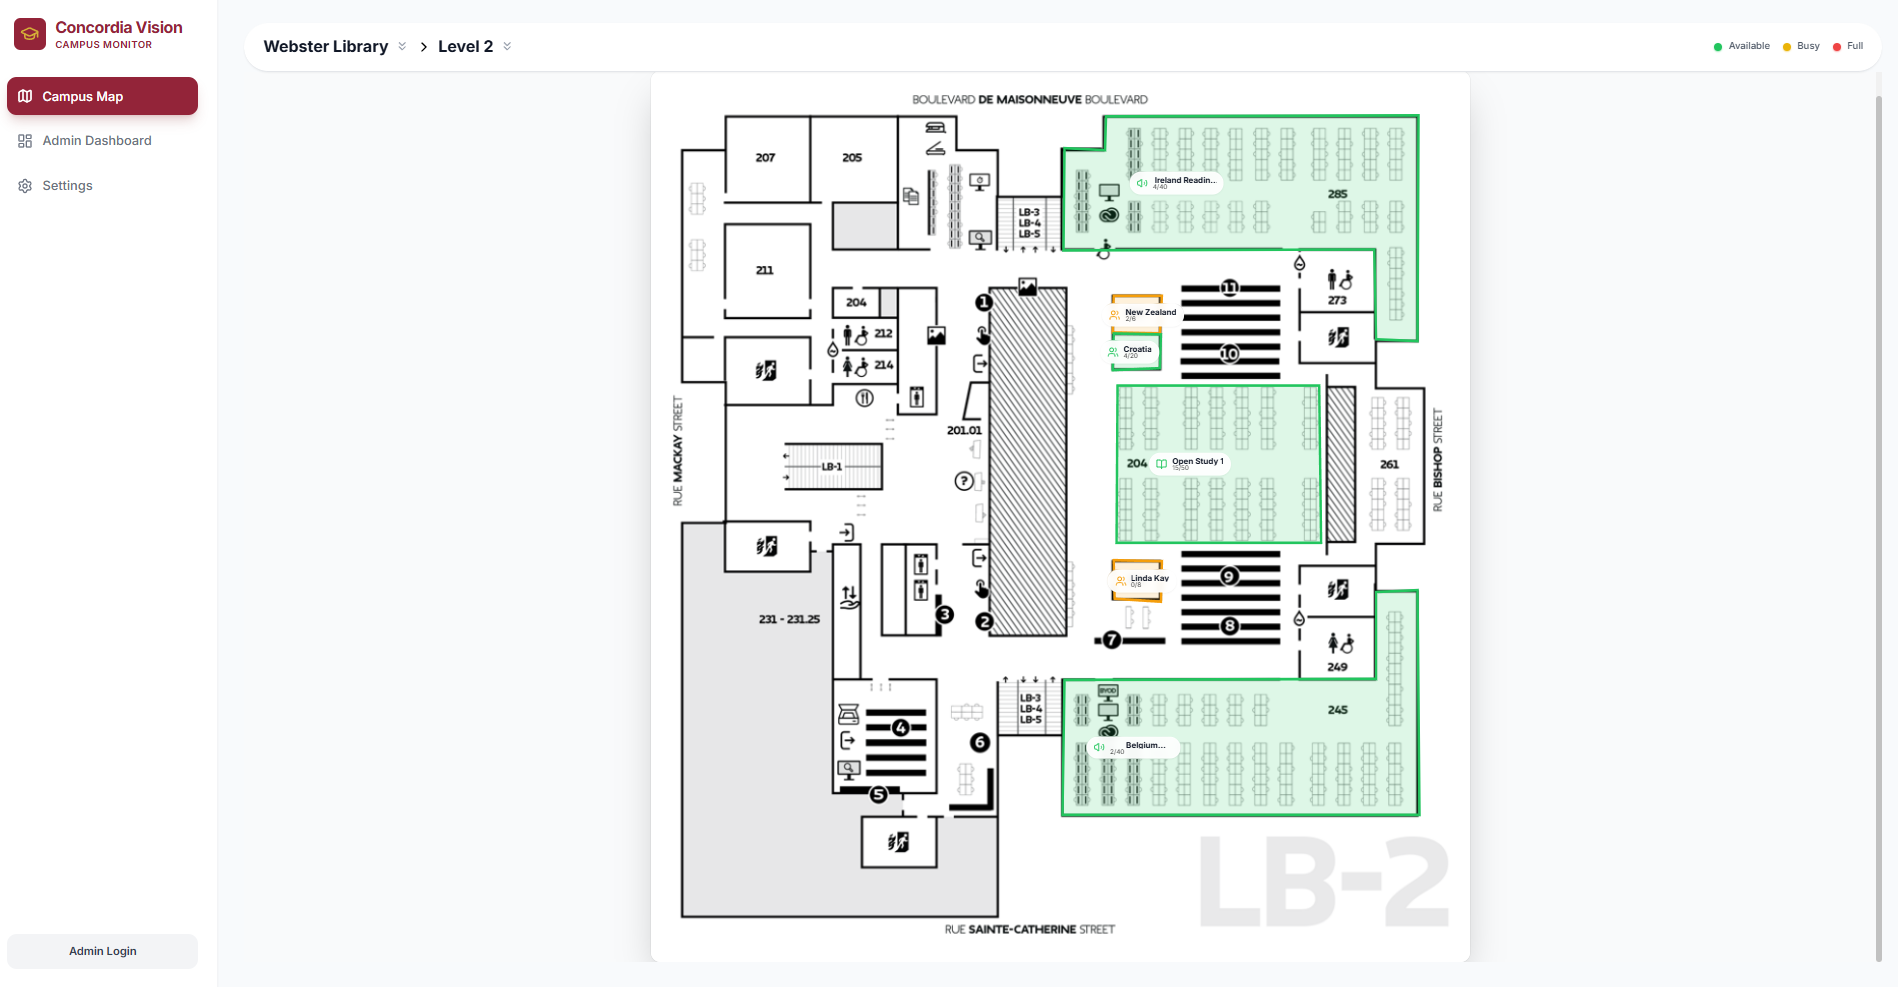
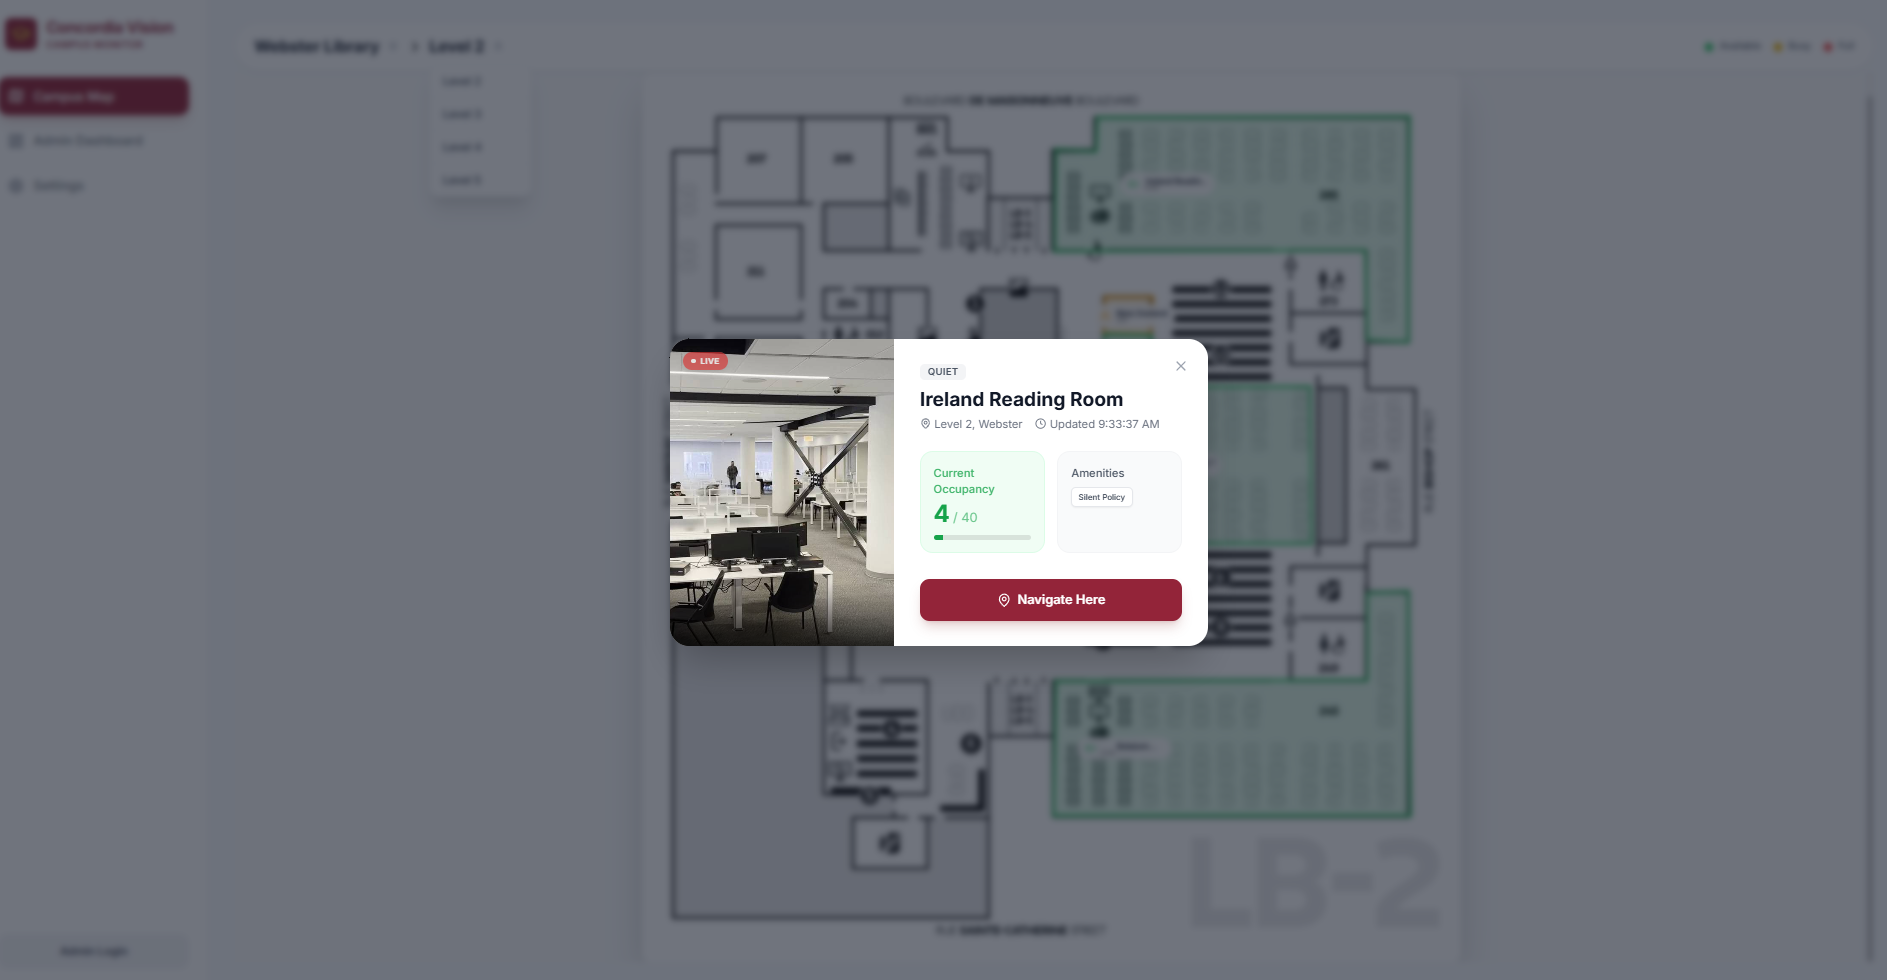
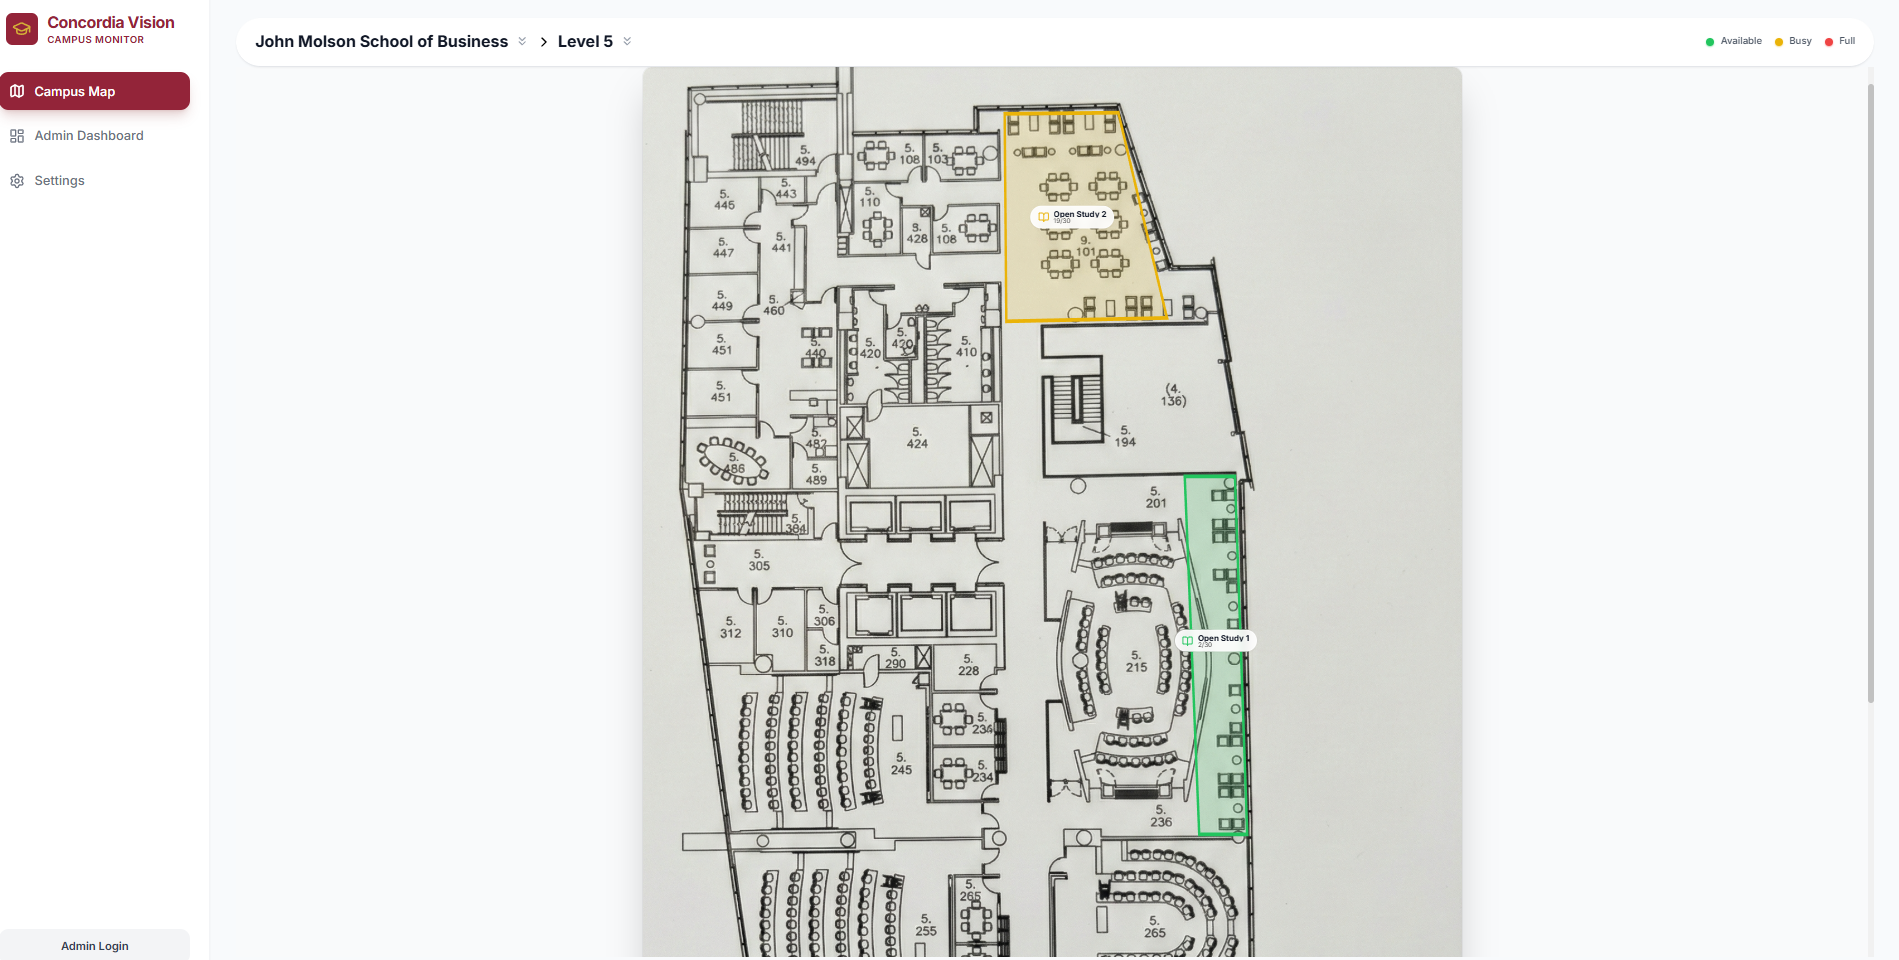
Concordia vision operates by aggregating various live feeds of study spaces from across the campus, including within JMSB, EV, Hall, and most importantly, the Webster Library. Users are greeted with a comprehensive and easy to use UI, allowing them to monitor the individual spaces across the floors of the buildings.
We felt that it was extremely important that users would be able to see how busy a floor is with just a few clicks. Users can navigate by selecting buildings and then floors, which provides them with a clean blueprint-style map with only the tracked study spaces highlighted. The system detects the occupancy level at these study spots by scanning for people and comparing that to the pre-set maximum capacity to display the room as either green, yellow, or red. These colours are intuitive for most; green means the area has lots of space left, yellow means it's filling up, and red means it's at near-capacity.
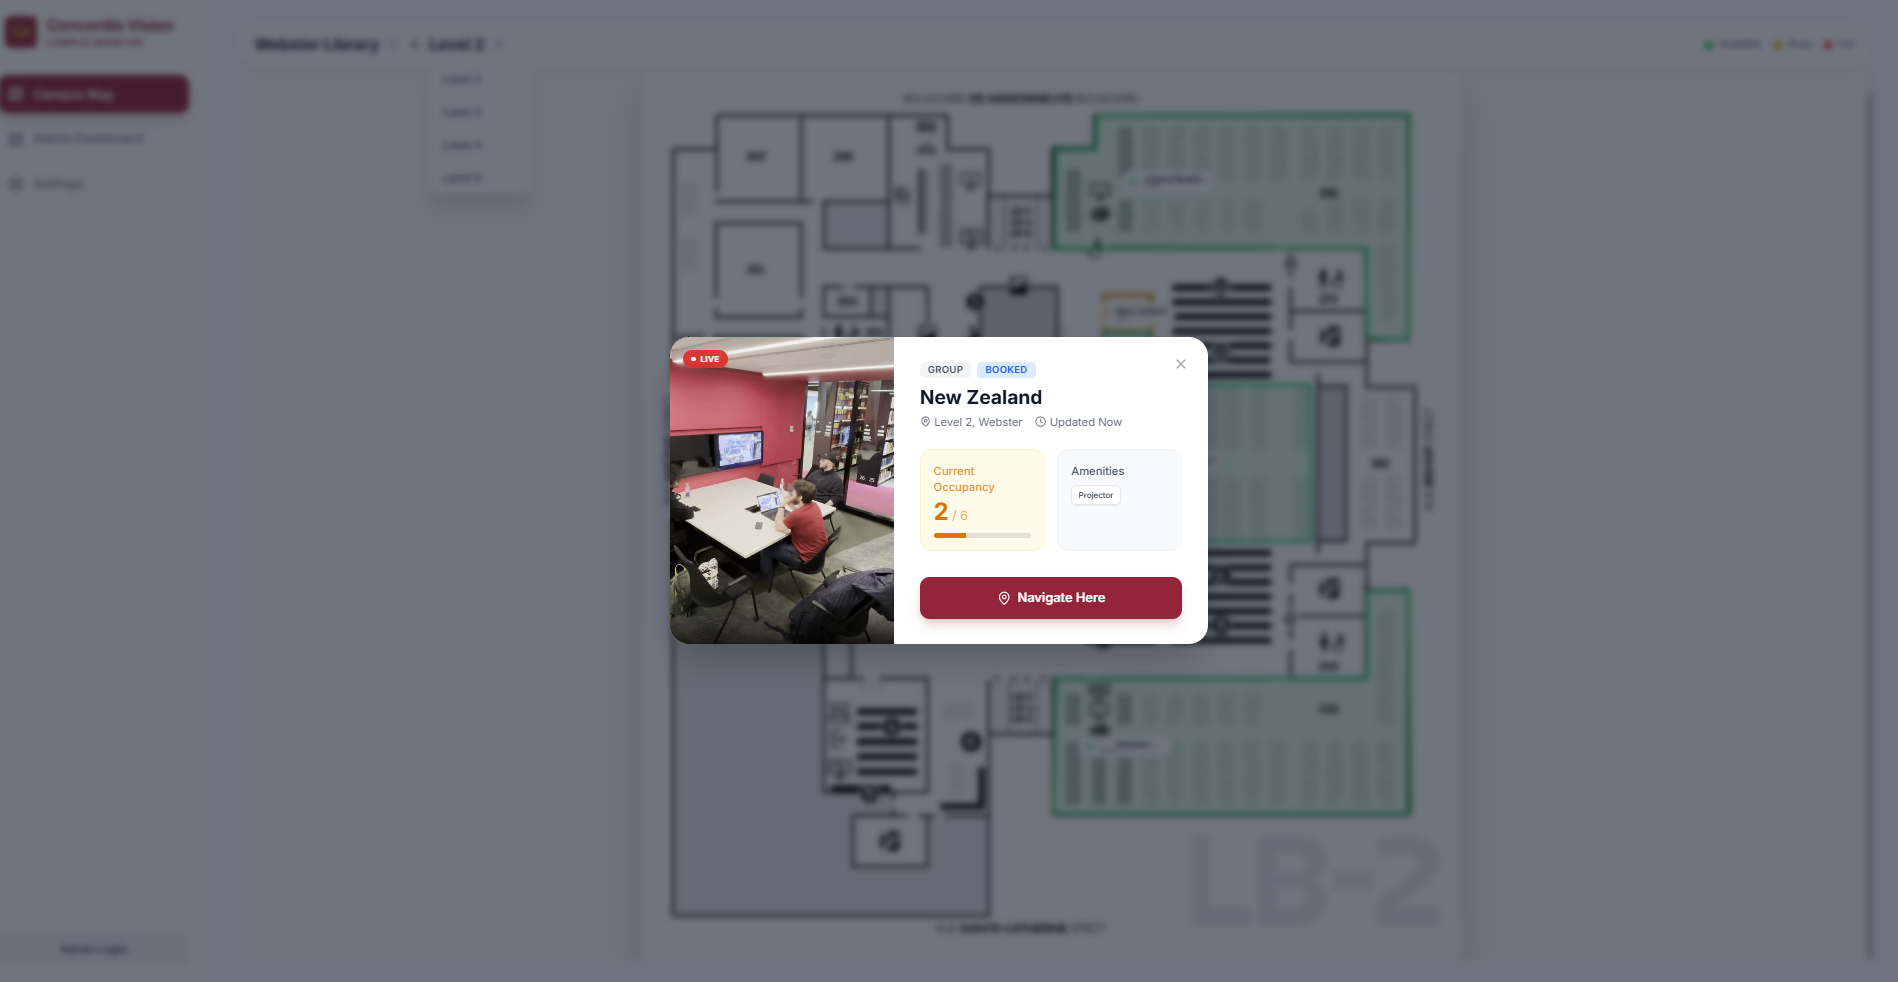
Of course, not all study spots are the same. The bookable group study rooms in the library cannot be displayed as having space left if three people booked it and are using it. The system would flag it as yellow because the max. capacity is actually 6, which is incorrect since the room is reserved. As such, bookable study rooms are special; if they are booked and in use before the 15 minute grace period runs out, they will be marked as in-use so long as more than one person is in the room, and if they leave the room early then it will become available in the system once again if they don't come back within a certain amount of time.
Additionally, since not everyone is comfortable with having their faces being recorded (even if it's just for recognizing that a person is there), we make sure to blur all detected faces before ever using the video feeds for detection.
Finally, we also have an admin page. This page hosted the main tooling that allowed us to build the maps that are seen throughout our application. Through placing points on the map in a square or any 4 sided polygon, it allows us to manually draw the locations of each of the study spaces across the campus, without needing to touch code or stylesheets whatsoever. This also makes it super easy to expand the school's network of study spaces, as any admin can simply go in and add study spaces to the map, adding a tremendous amount of scalability to the overall solution. Furthermore, the page is also home to many other admin like diagnostics, such as detailed views on the states of each of the rooms.
Overall, Concordia Vision is a tool that allows students to skip the wait and head straight to whichever study area is best at any given moment. Gone are the days of wandering up every flight of the library and looking into the group study rooms to see if there was a no-show but the system still shows it as reserved, or stopping at every floor in the Hall building to see if there is a free space. Just open the website, quickly check the buildings and floors nearest to you, and you know exactly where you can find a perfect study spot!
How we built it
Our project combines several tools to provide a working product. It is primarily split into two components: the frontend and the backend.
The frontend is what the users see; a clean UI, maps with study areas outlined and highlighted, and a simple and intuitive navigation between floors and buildings. To build the frontend, we utilized React. The frontend holds the different pages such as the admin page, login page, and popups that appear when you click on a room. It also encompassed the logic it needs to be able to capture data from the backend to update the individual room information. For live updates per room, the app takes in the current detected person count provided by the backend and compares that to the maximum capacity for a given room, which then results in a percentage. This percentage is compared to thresholds for each state (green, yellow, red), which is what decides the colour that each tracked area on the map has.
The backend is where everything else happens behind the scenes. It is made up of two main parts - the live video feed and the person detection software.
While we obviously do not have access to security cameras, we were able to come up with a very close alternative. Our team split up at the beginning of the hackathon, and two of us walked around the different buildings over the course of a few hours, while the other two worked on the foundation of the frontend and setting up Vultr. We managed to get over 70 videos, each matching up with a different study spot on the map, and each one of these videos is fed to a webpage through a live stream of frames via kubernetes to mirror what a live feed would act like. These videos are read from a google drive folder, but in a real world scenario camera feeds could be passed directly into the system.
In additon, almost all of the features are fully hosted on the vultr platform, allowing for maximum scalibility, while also providing a frames like interface just like any security system. In essence, the same kubernetes pods, and solution overall, could simply just be given the live feed of the security cameras, and the solution would function the exact same.
With the camera feeds available, we then process the videos using a pre-trained machine learning model called YOLO.
(It can be found in the following repository: YOLO GitHub page)
YOLO is trained to detect objects, and in our case we can use it to only detect people. It grabs a new frame from each video feed every few seconds and calculates how many people are in that frame, which saves massively on computational costs as opposed to recalculating every single frame. Since we save so much on the computational costs, we can sequentially check each one of the videos, providing a seamless loop of updated information. We then pass this bundled-up data onwards to a webpage, exposing it as an API for the frontend to use. The frontend matches up the different lists by room ID, ensuring that each piece of data goes where it's supposed to and doesn't accidentally get lost or used in another room.
Challenges we ran into
As is bound to happen with every project, not everything goes according to plan.
One problem we ran into was selecting a proper deep learning model to accurately detect people. Initially, we were using outdated models which we only gave images to a single time, meaning it struggled to detect people that were far away when there were also people standing close. Switching to YOLO immensely helped with solving this issue, as well as allowing for multi-scale detection at different input sizes which made the model detect both very small people in the background while simultaneously detecting closer people as well.
Another complication was deciding on how to best estimate the maximum capacity per video feed. We juggled with ideas such as running another object detection model to count chairs and tables and get an estimate from that, or passing the images into a LLM such as Gemini to provide an estimate for us, but none of these were as effective as simply scanning over the study spots manually and providing a rough estimate. In a real-world use case, we would have been able to either count all visible chairs more accurately or let the system run for a week and then select the overall highest number of detected people as the max. capacity (assuming that each of the study spots will have been at or near capacity at least once in that time frame). However, for the purposes of the Hackathon, we felt that our estimates would be sufficient and the time spent to get a different tool working for a one-time use case was not worth it.
We also faced some challenges initally when getting the open-cv engine deployed on vulture, but overcame them in the end!
Accomplishments that we're proud of
While we are proud of the project as a whole and how we were able to come together as a team and effectively distribute the workload, we do have some specific achievements that we want to highlight.
While pre-processing the pictures we took of the floorplans, we had to come up with a way to outline the study spots effectively. We came up with an additional little tab in the admin page of the site which essentially provided us with a custom tool built directly for our required purpose to easily draw the study area boundaries onto the maps to be used by the application. This is outside of the scope of the project itself, but immensely sped up the creation of the maps, and could be used in the future if the project were to be used on other campuses or public spaces, since the maps would have to be custom-made for those new locations.
Another thing we were proud of is that we got kubernetes working after some trial and error. It allowed us to mimic a real-world environment with a continuous stream of data being made available through the web to be used by the person detection system.
What we learned
All of us learned a lot over the course of the Hackathon. We realized that a concrete game plan is the most important thing to iron out before even starting development, as small changes that we randomly think of halfway through the project can cascade into massively wasted efforts. Maximizing efficiency is extremely important in a 24-hour hackathon, and we made sure to brainstorm heavily very early on to come up with a working start-to-finish idea.
We also learned how important it is to get some rest and not stay up all night, as lack of sleep can really catch up to you and lower the quality of your work. While we all rested for a shorter time than we normally would have, we still made sure to each get some downtime so that the quality of our work wouldn't suffer.
What's next for Segmentation Faults Reborn
Since we worked so well together as a team, we may be looking into joining future Hackathons together, or potentially further develop the project we made to be used in real life since we believe that it is a very valuable tool which many students would appreciate having access to.

Log in or sign up for Devpost to join the conversation.