-
-

Logo
-

Start Up Page
-

Air Quality Index Search
-

Tips!

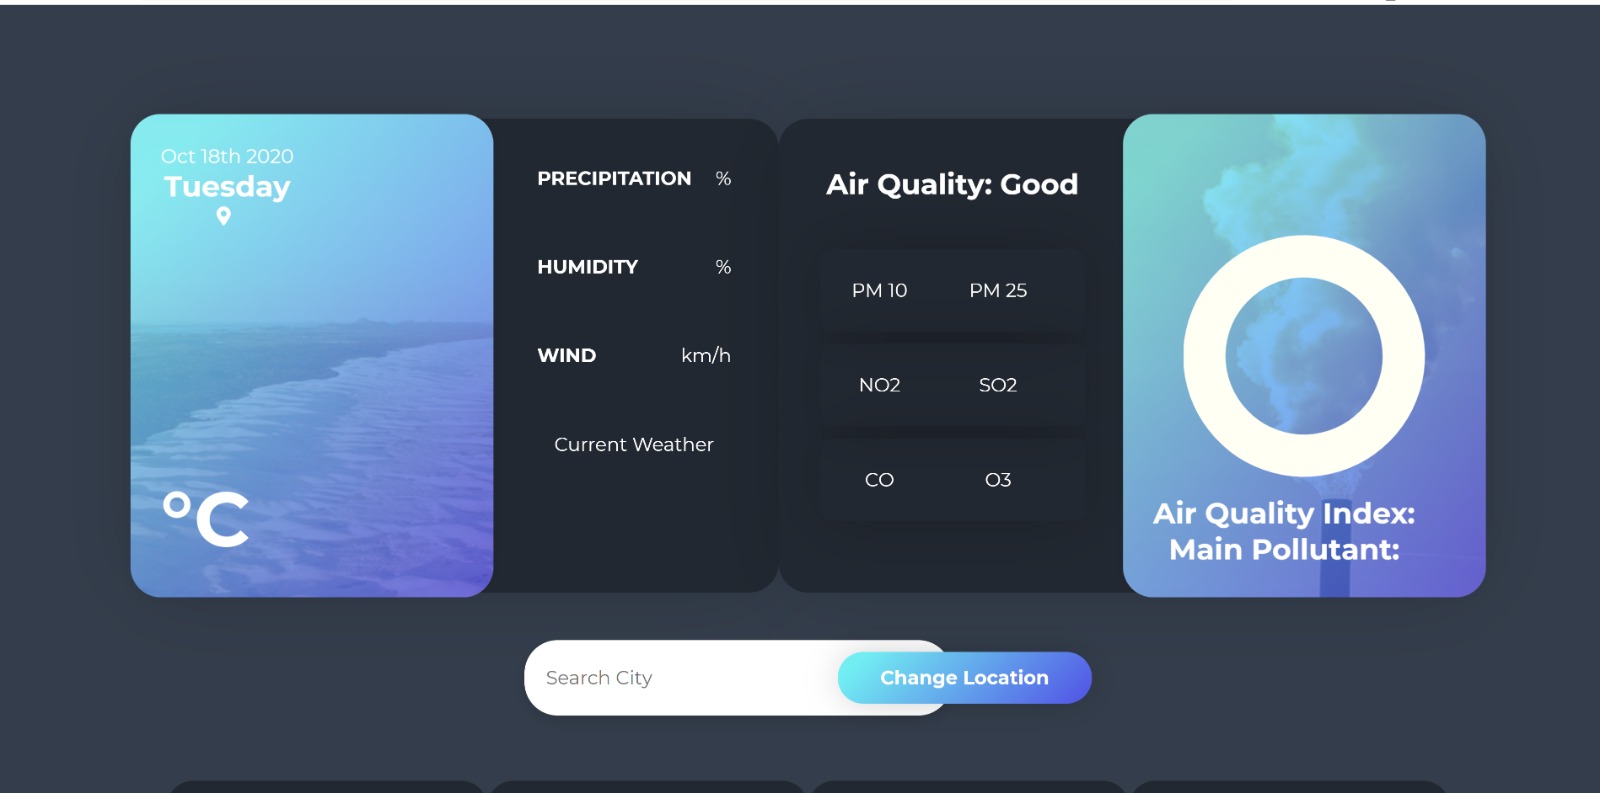


We wanted to create a web app to inform users of the air quality index, specifically in India. India suffers from the most deaths as a result of air pollution. We hope that with this webapp, users can become more aware of the air quality around them and take precautions as needed.
Users can easily look up the AQI and current weather data for any location in the world. Additionally, with the calendar tool and our own projection data, users in India can look at the AQI from the past, present, and future! The categorization/ threat of the AQI is displayed as well so users can better understand what the index means. They can also see the particle matter for particles less than 10 microns (PM10), less than 2.5 microns (PM2.5), and the concentrations of O3, NO2, SO2, and CO. We included a list of precautions that users can take to minimize the effects of air pollution on the environment and their health.
We used JavaScript, HTML, CSS, and React to build this webapp. We also used GitHub and Live Share to organize and collaborate on our code. We used the Ambee and OpenWeather APIs to receive the AQI data. Lastly, we used a dataset from Kaggle to construct our own AQI predictions based on previous date and location data.
Finding the right API was a challenge, because we wanted to use a single API to receive all our data. After much research, we realize we would have to split it up. For example, one API is used to retrieve current AQI (air quality index) data based on location (city, state, country), another is used for current weather data, and we created our own API to make a projection for future AQIs in India using historical data.
We accomplished a web application that successfully tracks and projects the air quality index in Indian metropolitan areas. We learned that utilizing data for projections can be messy and certainly a hard task for certain projections. API's and resources can be hard to come by as well! The future of SeeO2 can see a lot more than just India. We'd like to expand it to other 3rd-world countries and display even more data on particulate matter and not just the air quality index. Also, we would like to add more features--for example, plotting AQI trends and giving a recommendation of when to travel during the lowest AQI in the area.
Built With
- ambee
- css
- github
- html
- javascript
- kaggle
- openweathermap
- react


Log in or sign up for Devpost to join the conversation.