Inspiration
Two moments sparked this idea.
The first came from a personal frustration. As a software engineer, my knowledge is deep but narrow—I live inside the engineering world. When I try to read financial reports, geopolitical news, or economic data, I can understand the words, but I can’t connect the dots. The relationships between events across domains—how a conflict in the Middle East turns into rising gas prices in Vietnam—are invisible without years of cross-domain expertise.
I started wondering: what if there were a tool that could simply show the chain? Not more data, but data made visible and connected in a way that fits how my brain works. That’s where the name came from—See It.
The second inspiration came from Jarvis in Iron Man. JARVIS enables Tony Stark to operate beyond his domain knowledge by synthesizing news, data, and real-time signals into clear, actionable insights. We wanted to build something similar: a personal intelligence layer that filters noise, maps hidden connections, and delivers clarity at the moment you need it.
What It Does
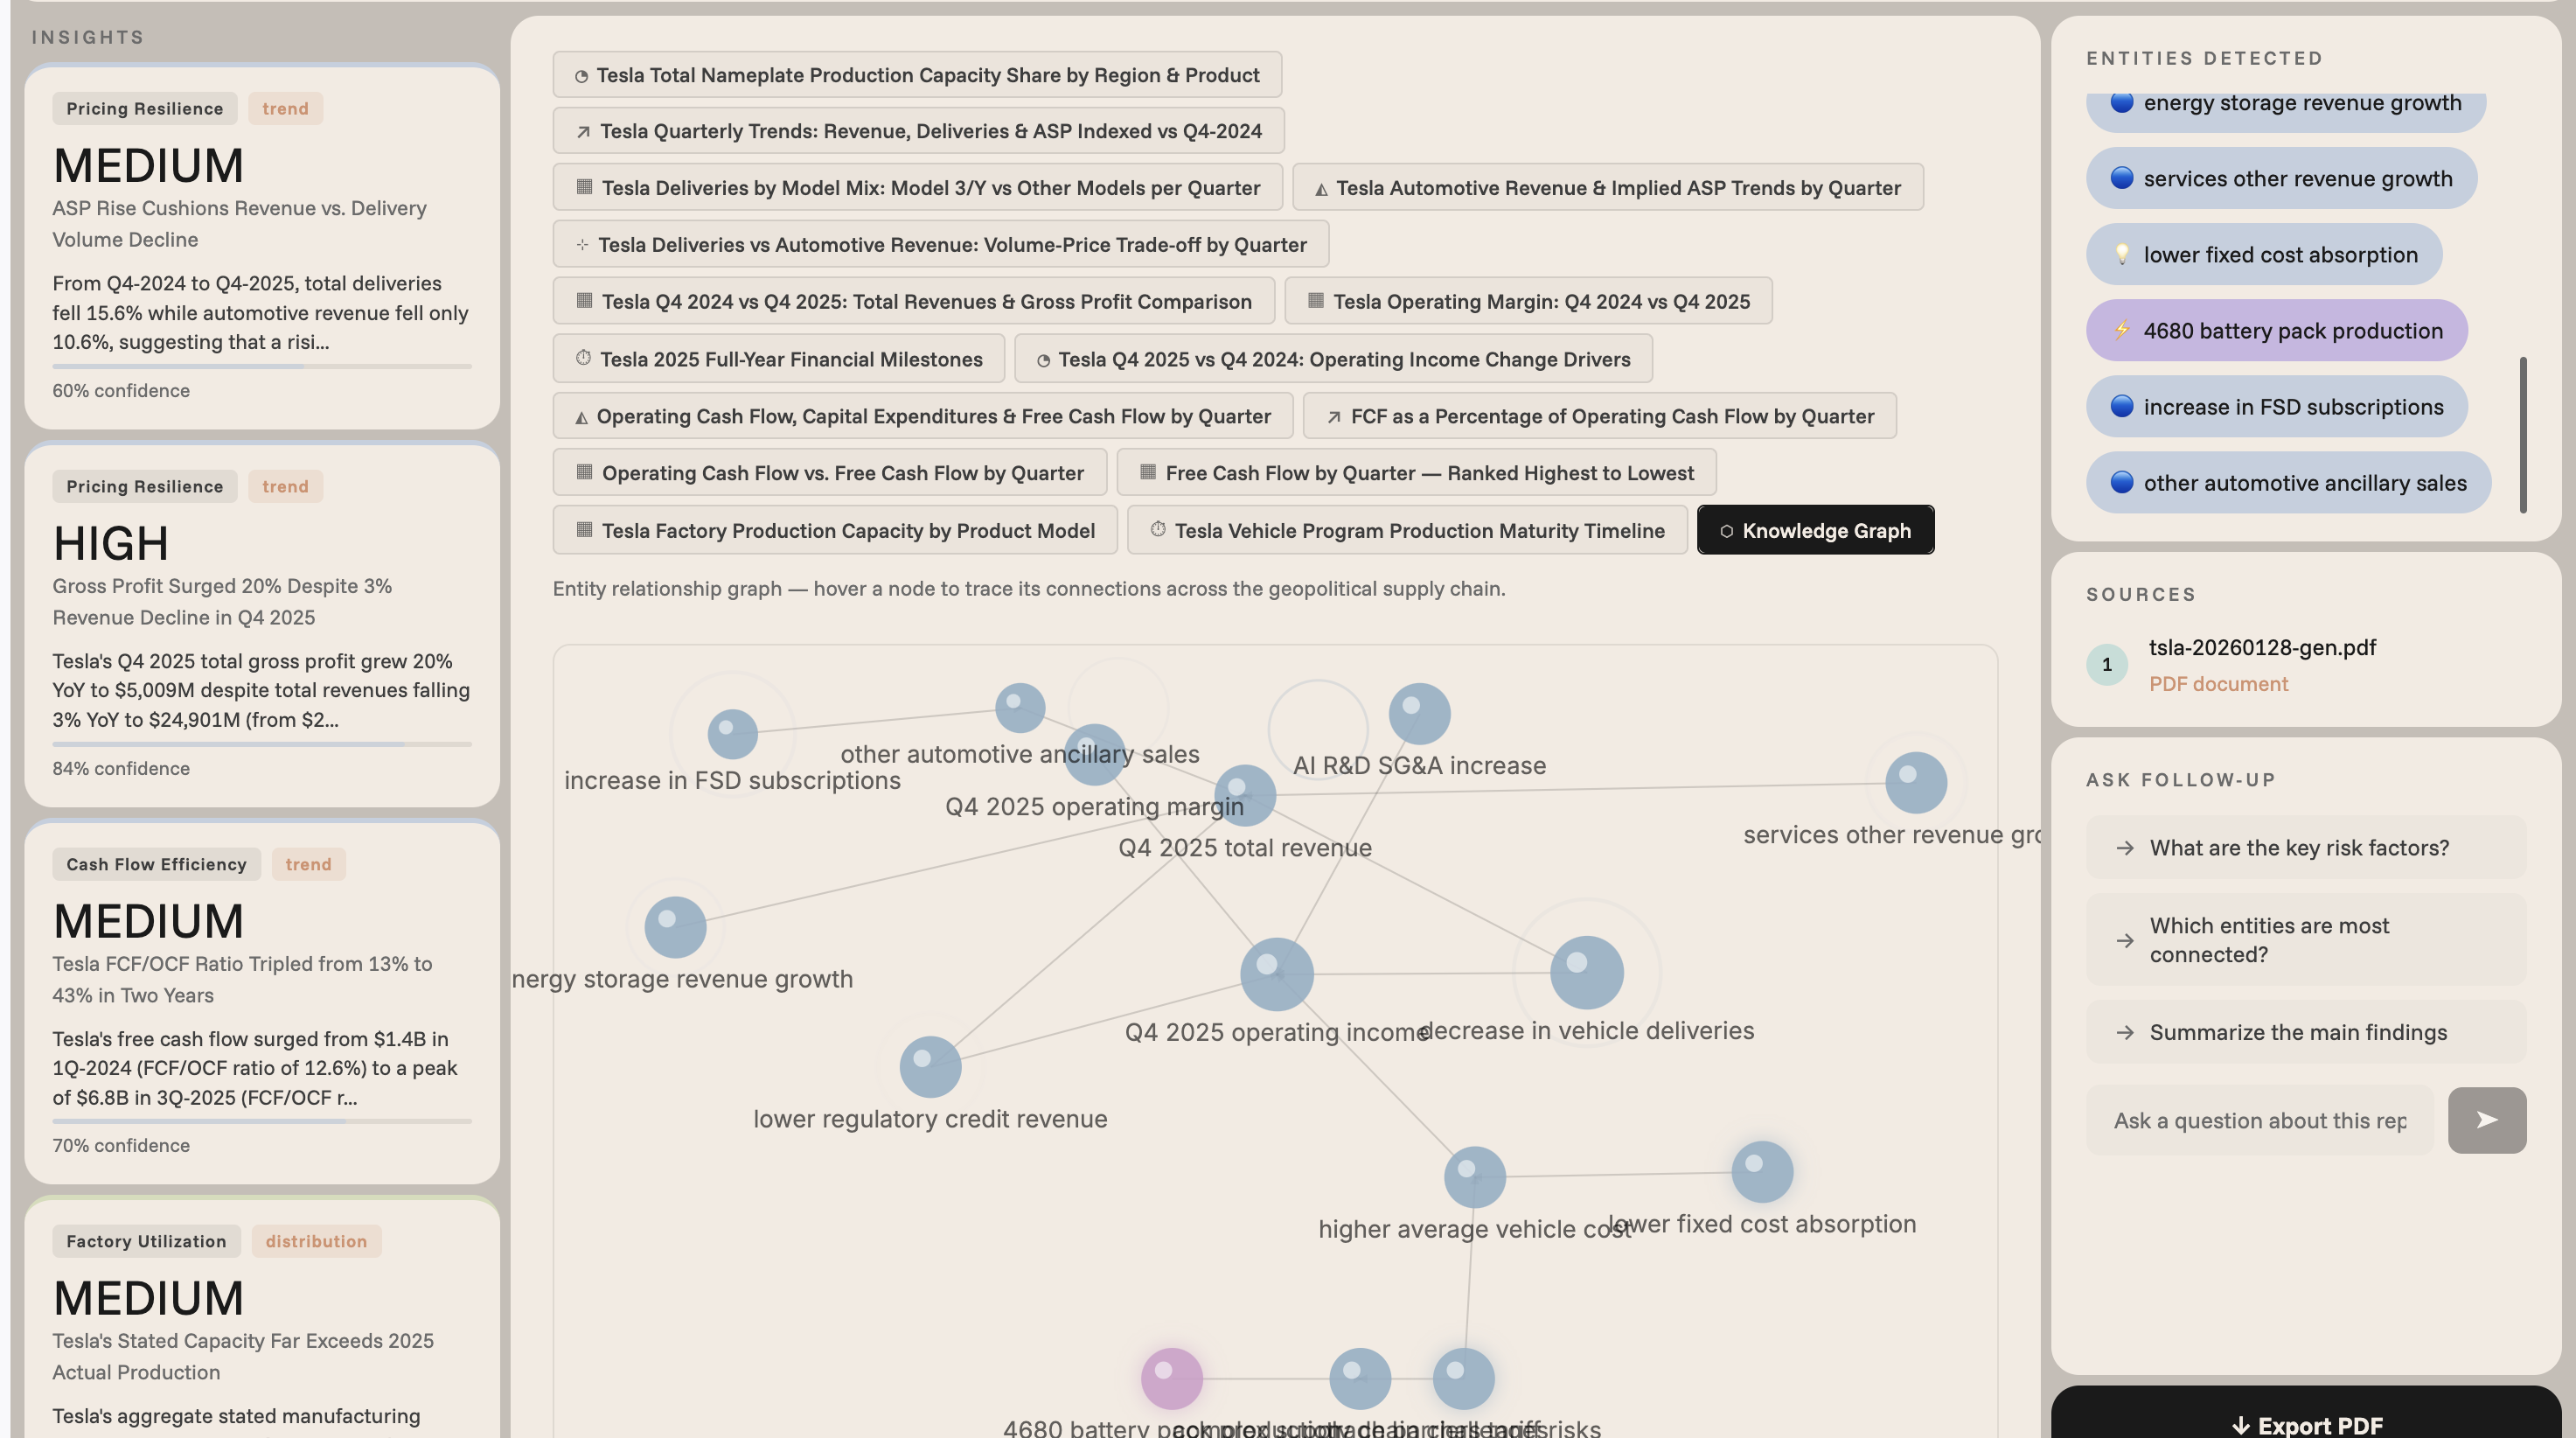
SeeIt is an intelligence graph platform that transforms raw, multi-source information into structured, visual intelligence reports—no domain expertise required.
Users configure sources (news URLs, RSS feeds, uploaded files, datasets), ask a question, and SeeIt’s agent processes everything. It builds an internal knowledge graph of entities and causal relationships, then delivers a clean report with:
- Written analysis
- Auto-generated charts
- Key entity cards
- Source citations with confidence scores
Users can ask follow-up questions grounded in the same dataset and export reports as PDFs or shareable links.
The graph runs silently underneath. What users see is clarity.
How We Built It
Input Layer
Users provide URLs, upload files (PDF/CSV/JSON), or connect RSS feeds. The system ingests, cleans, and normalizes all content.Extraction Layer
AI extracts entities, relationships, causality direction, sentiment, and confidence scores. The output is structured graph JSON with typed nodes and weighted edges.Graph Engine
An in-memory knowledge graph stores entities and relationships while detecting causal chains (A → B → C → D). Contradictions across sources are automatically flagged.Report Generator
The LLM synthesizes graph data into a structured intelligence report: Summary, Key Findings, Risk Signals, Timeline, and What to Watch—each with confidence indicators.Chart Engine
The system dynamically selects the most appropriate visualization types (line charts, Sankey diagrams, heat maps, timelines, mini knowledge graphs) based on insight structure.Frontend
Built with React, featuring a clean three-step flow: Source Configuration → Processing → Intelligence Report.
Challenges We Ran Into
Cross-domain relationship extraction
Accurately identifying causal chains across domains (geopolitics → commodities → logistics → local economy) without hallucinations was the hardest problem.Confidence scoring
Handling partial contradictions across sources required building a multi-source corroboration mechanism from scratch.Chart selection logic
Automatically matching insights to the most effective visualization required careful prompt design and mapping strategies.Making the graph invisible
Shifting from a graph-first UI to a report-first experience required rethinking the entire user journey while preserving power-user access.
Accomplishments We’re Proud Of
- Built a full pipeline from raw articles to structured, cited intelligence reports in a single click
- Successfully generated causal chains (e.g., geopolitical tension → regional fuel price impact)
- Enabled autonomous chart selection based on insight type, not templates
- Designed a transparent processing view that balances clarity and depth for different user types
What We Learned
- Most users don’t want to explore graphs—they want the conclusions those graphs produce
- Confidence scoring is as critical as the insight itself
- Causal chains are the highest-value output; connections matter more than individual data points
- LLMs excel at cross-domain synthesis when grounded in structured graph context—the real challenge is building the extraction pipeline
What’s Next for SeeIt – Insight Graph Platform
Live source monitoring
Automatically update intelligence as new data arrives via scheduled RSS ingestionCollaborative workspaces
Enable teams to co-analyze, add sources, and evolve insights togetherDecision nodes
Surface actionable recommendations derived from high-confidence causal chains, with interactive challenge/feedback loopsExpanded data integrations
Connect to APIs, financial feeds, and structured databases beyond unstructured textPersonalized intelligence
Adapt explanations based on user expertise—deep where needed, concise where familiar
Built With
- neo4j
- openai
- postgresql
- python
- react
- tinyfish


Log in or sign up for Devpost to join the conversation.