-
-
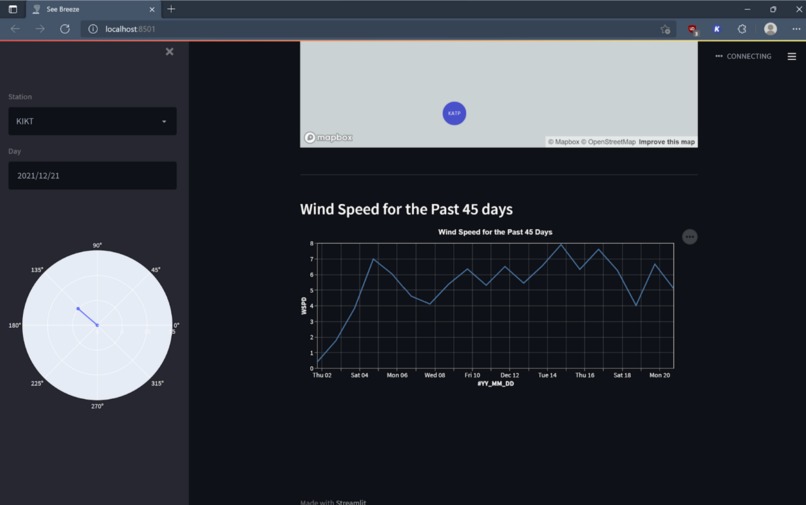
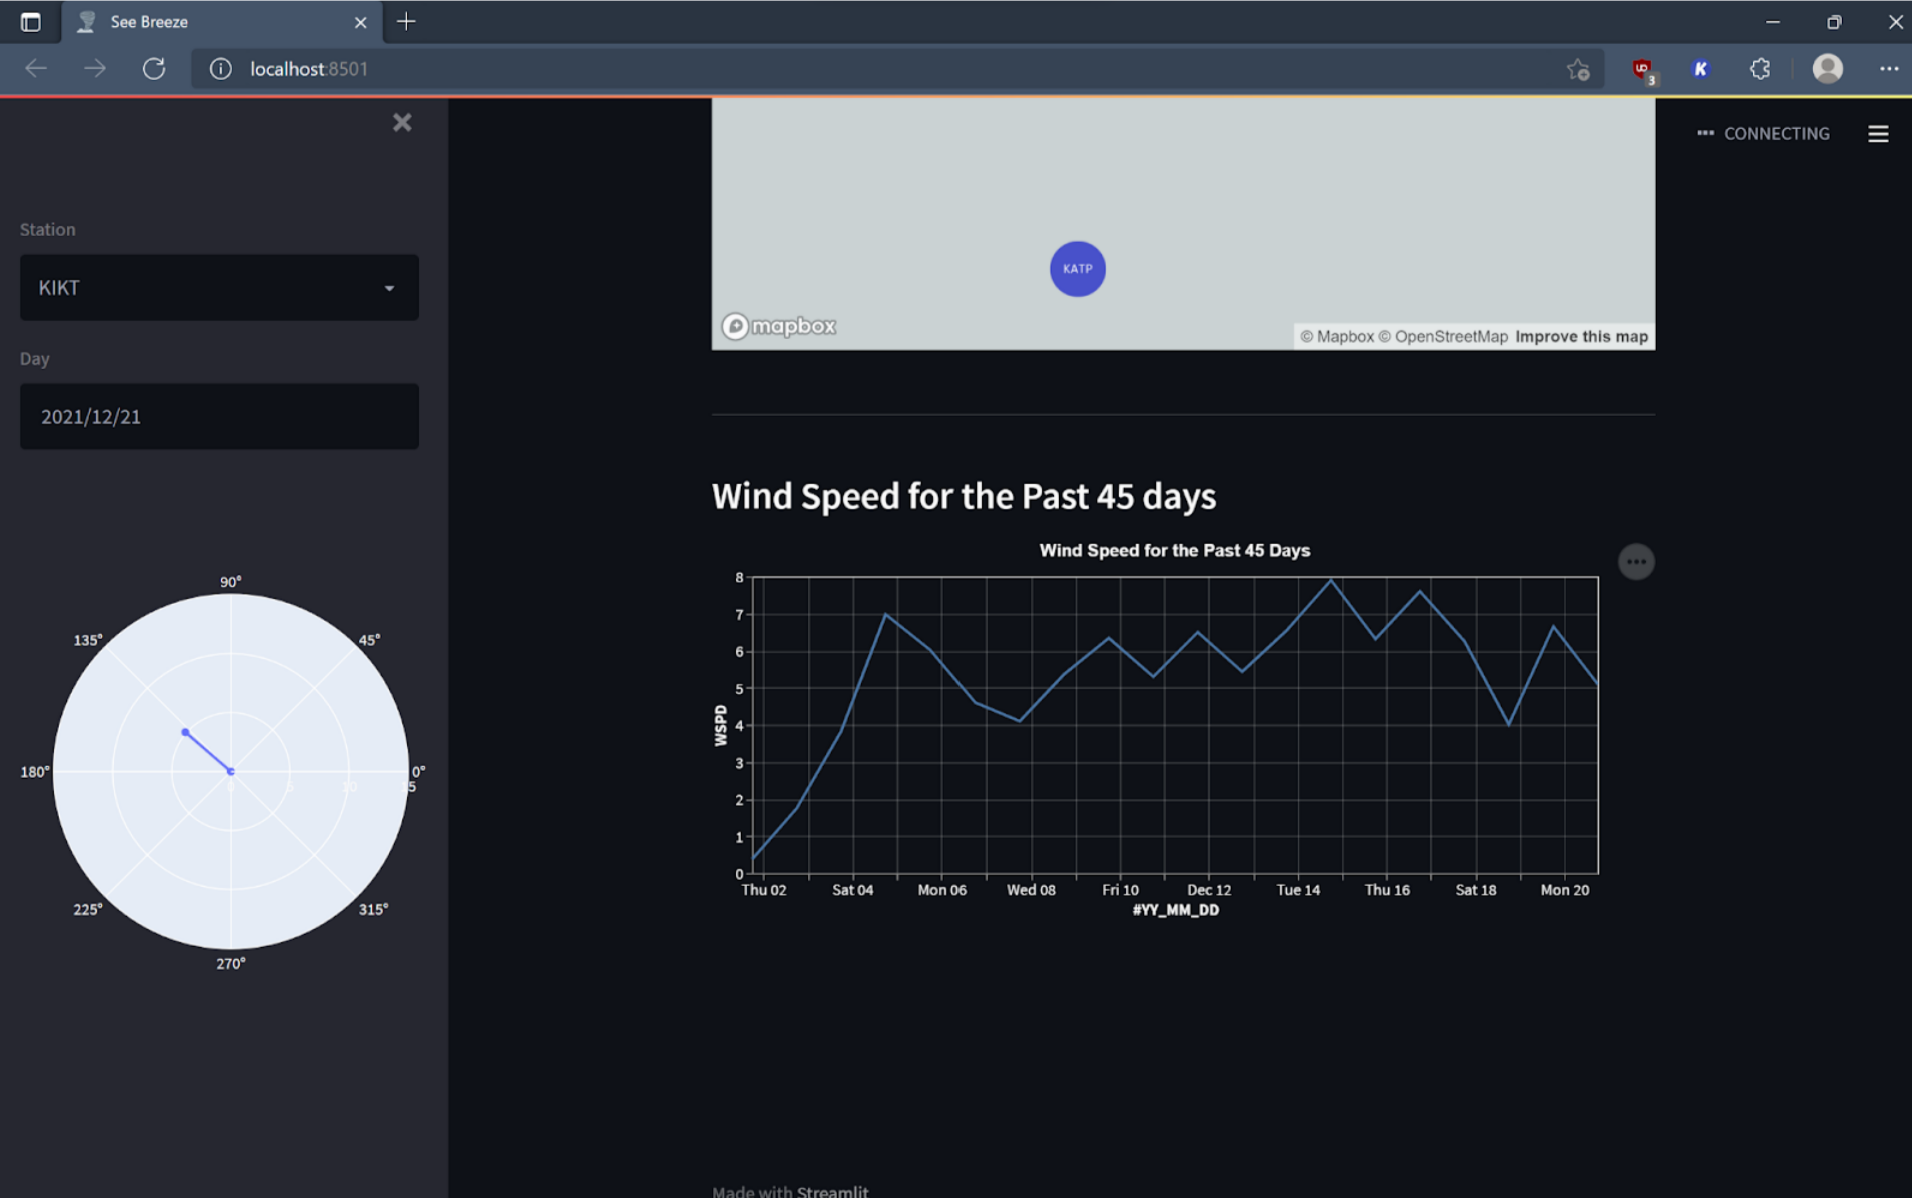
Station Wind Graph
-

Interactive Map
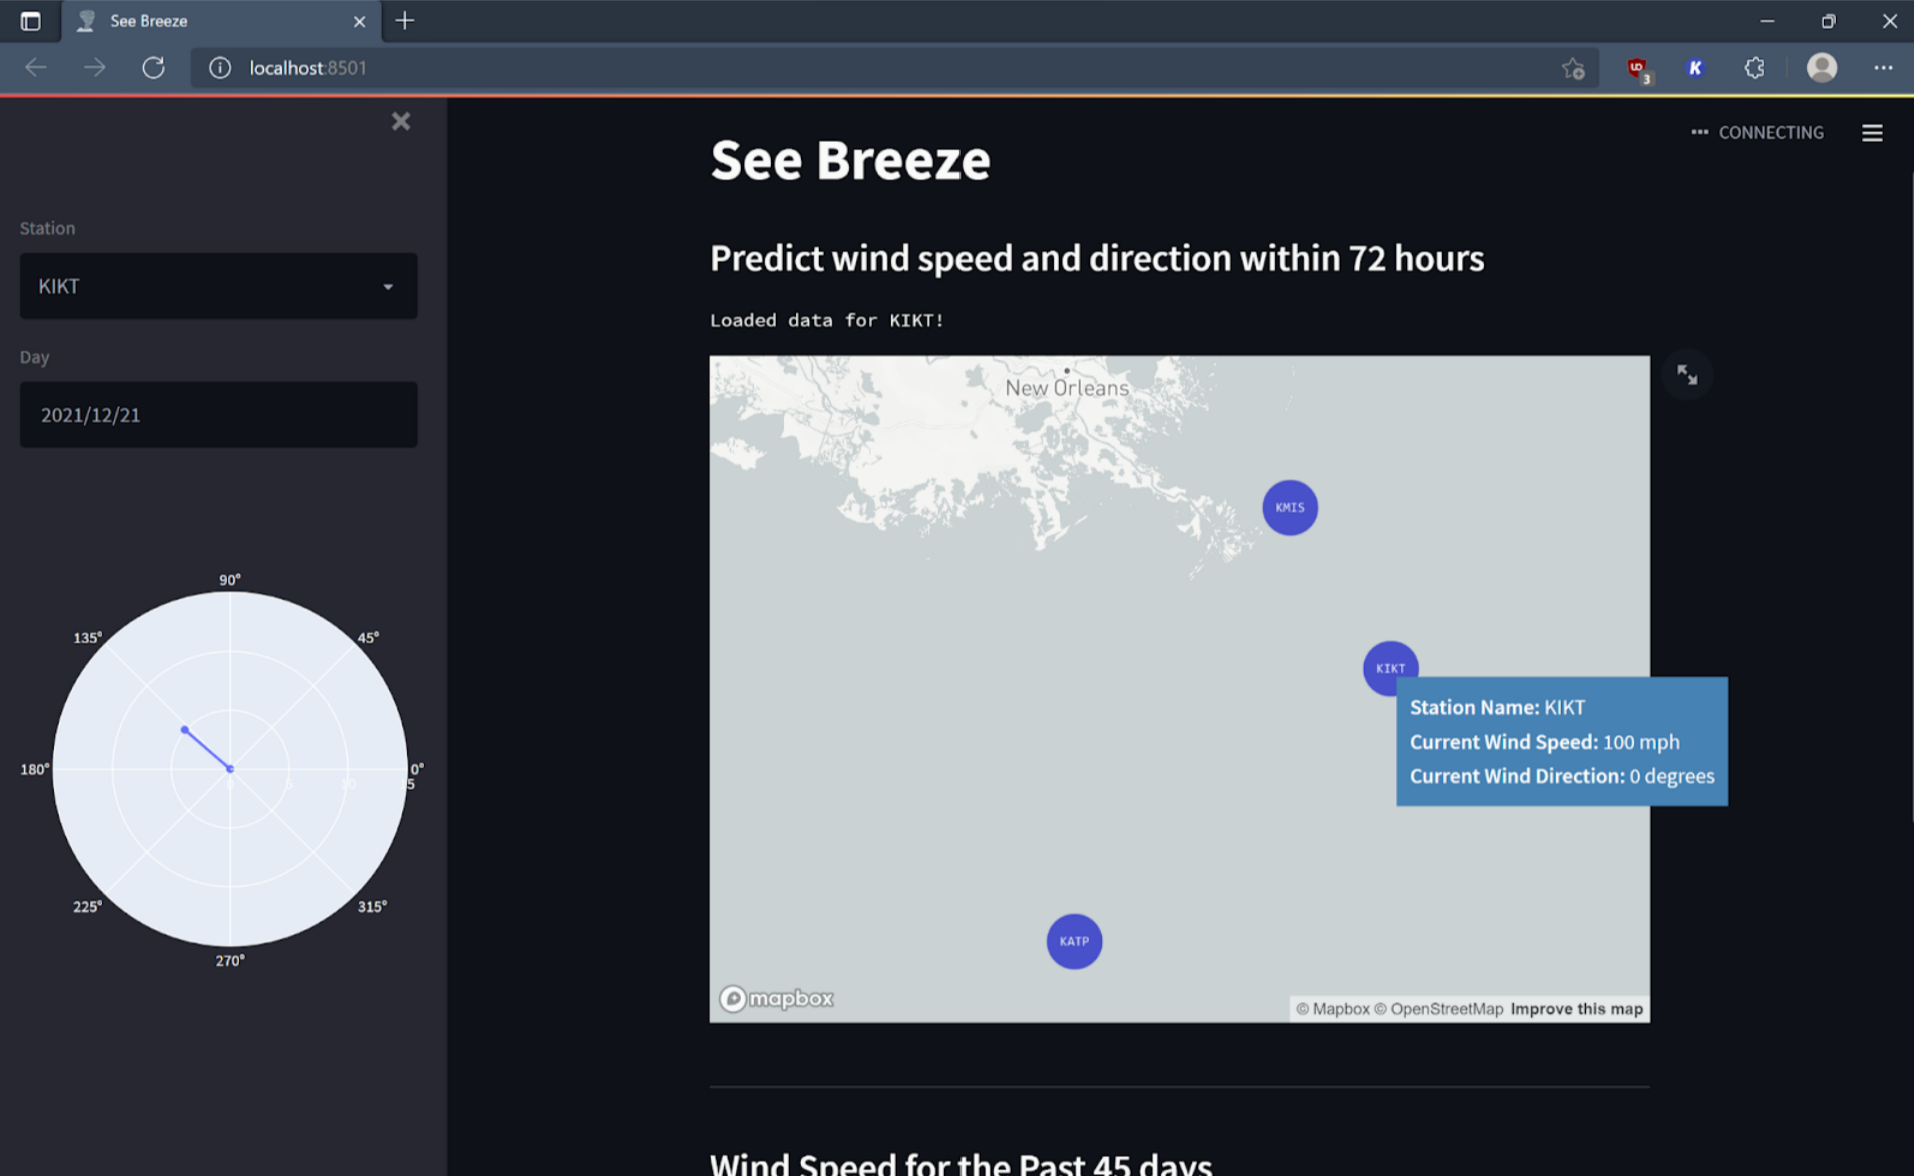
Project Purpose: To create an interactive dashboard that accomplishes two key objectives:
- To take LIVE wind data from NOAA stations in a historical time frame and use it to create a model to predict wind qualities in the future with the recent available data.
a. For this project, we used the three stations recommended by Cognite (KIKT, KAPT, KMIS), but it is simple to scale this up for more stations.
- To allow users to discover/interact with the wind speed and direction for a given station and a given date.
Challenges:
- Accounting for the high frequency of missing data in historical files (For example, look at this file, all of the missing data is denoted as 99.0 or 999.0)
- Taking live data from NOAA’s website
- Determining how best to train our model with existing data Integrating our machine learning model into our website
Next Steps:
- This code can easily be scaled up for other stations, and we could potentially add every NOAA monitoring station to the map.
- From the above step, this could be used to create a heat/gradient map of wind speeds across the world, predicting wind speeds in between stations.
- In addition, more historical data could improve the accuracy of the M.L. model, so it would be helpful to introduce that into our model.
Built by: William (Nat) Hill, Zachary Katz, Shreyas Minocha, and Michael Wong


Log in or sign up for Devpost to join the conversation.