Inspiration
The Autonomous Networks Research Group has built a secure data-transfer system by leveraging blockchain technologies and an MQTT pub/sub protocol. The desire for users to better understand such systems and the impact of parameter modification on message reliability/efficiency became apparent.
What it does
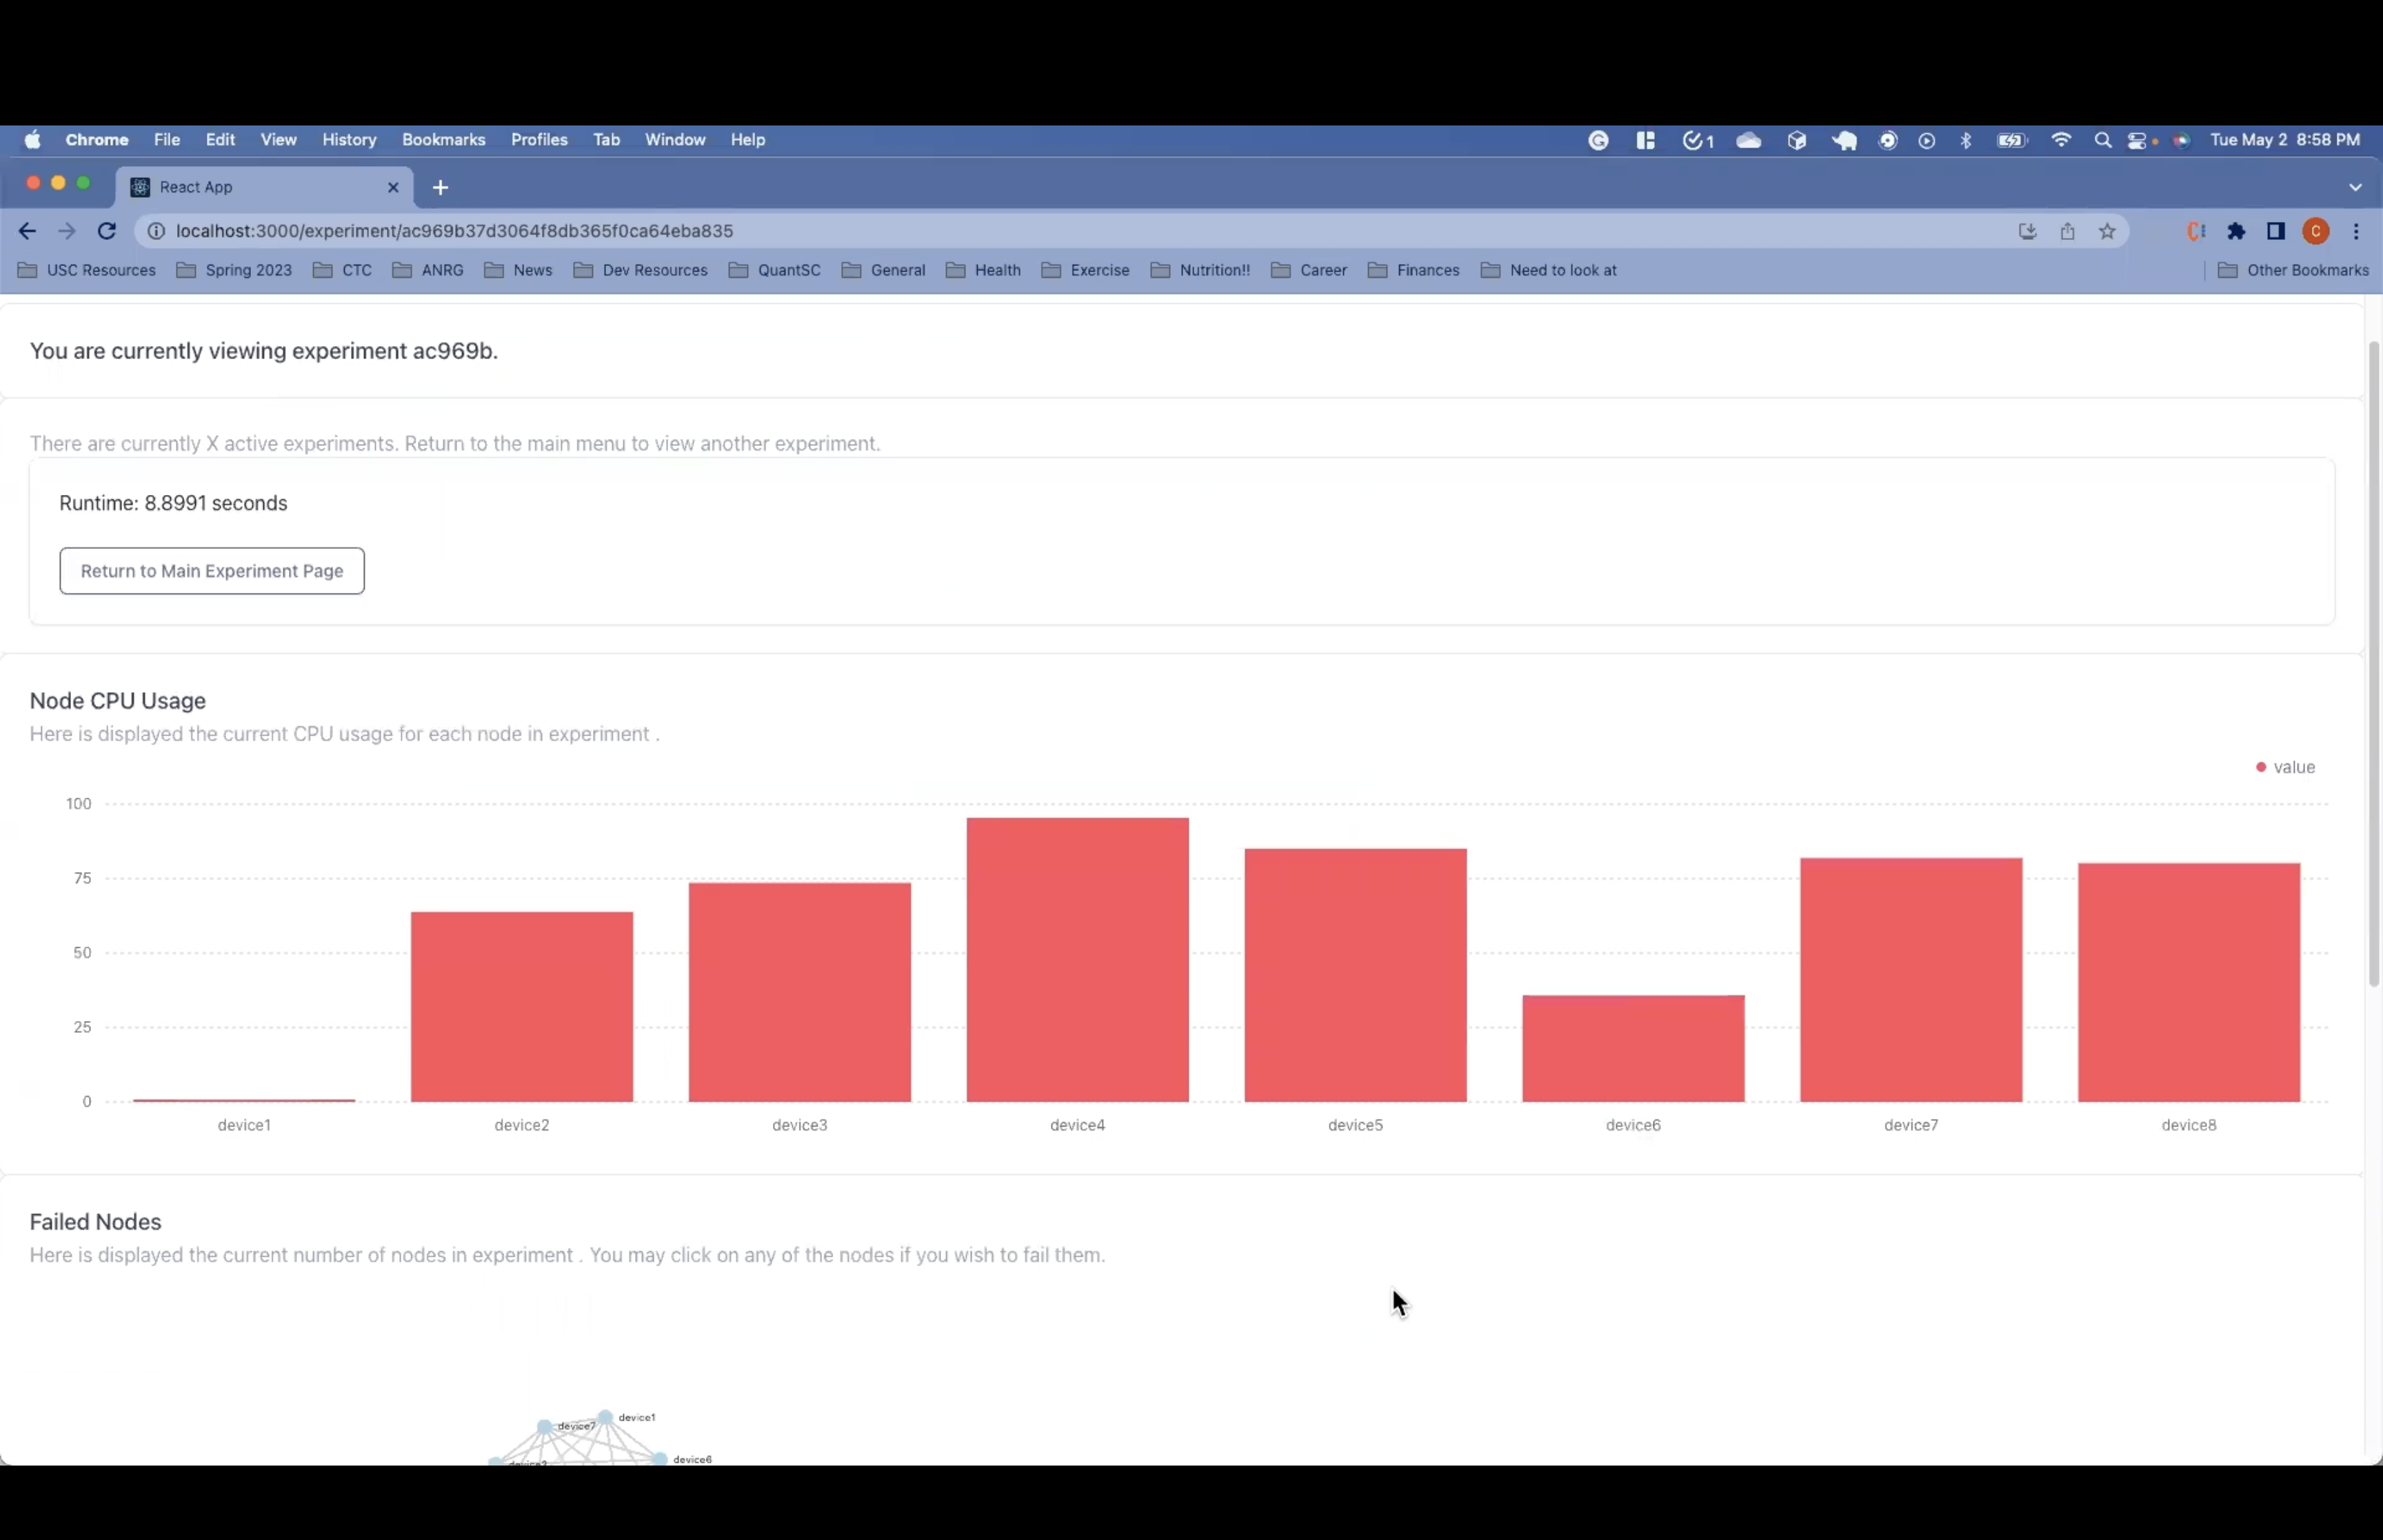
The Secure IIOT React GUI’s goal is to explore and demonstrate how blockchain technologies can enhance cybersecurity with respect to the bidirectional communications of data-transfer technology systems. This web interface allows users to run experiments and visualize how the communications system will be impacted by input specifications relating to node count, hub quorum %, failure specifications, and more. The user input is parsed, sent to the secure IIOT generator, which runs the experiment, and dynamically visualized to increase the user’s understanding of parameter modification impact.
How I built it
The interactive graphical user interface is a full-stack web application with a React frontend and a Flask Python server backend. React was chosen because of its efficiency at manipulating and updating the DOM (document object model) relative to other possible frontend choices. Along with React, libraries, including Tremor and react-d3-graph were leveraged to create the dynamic visualizations. Flask was chosen because of its flexibility in reference to updating project requirements.
Challenges I ran into
Being the first instance where I built a full-stack web application on my own, it was initially difficult to navigate the different technologies available. At first, this project’s backend was built with Node.js, which made the project easy to maintain with both a Javascript frontend and backend. However, because our project did not require handling high-concurrency tasks, we transitioned to Flask for its easy use and flexibility.
What's next for the Secure IIOT React GUI
The GUI can be extended to include an option for users to create an account and store their previous experiments. This will require the addition of a database to hold user data—MySQL being a possible option. In addition, the visualization page can be improved with further visuals indicating the communication success percentage between nodes and the ability to fail specific nodes within the experiment.
Built With
- flask
- javascript
- python
- react
- react-d3-graph
- tremor

Log in or sign up for Devpost to join the conversation.