Inspiration
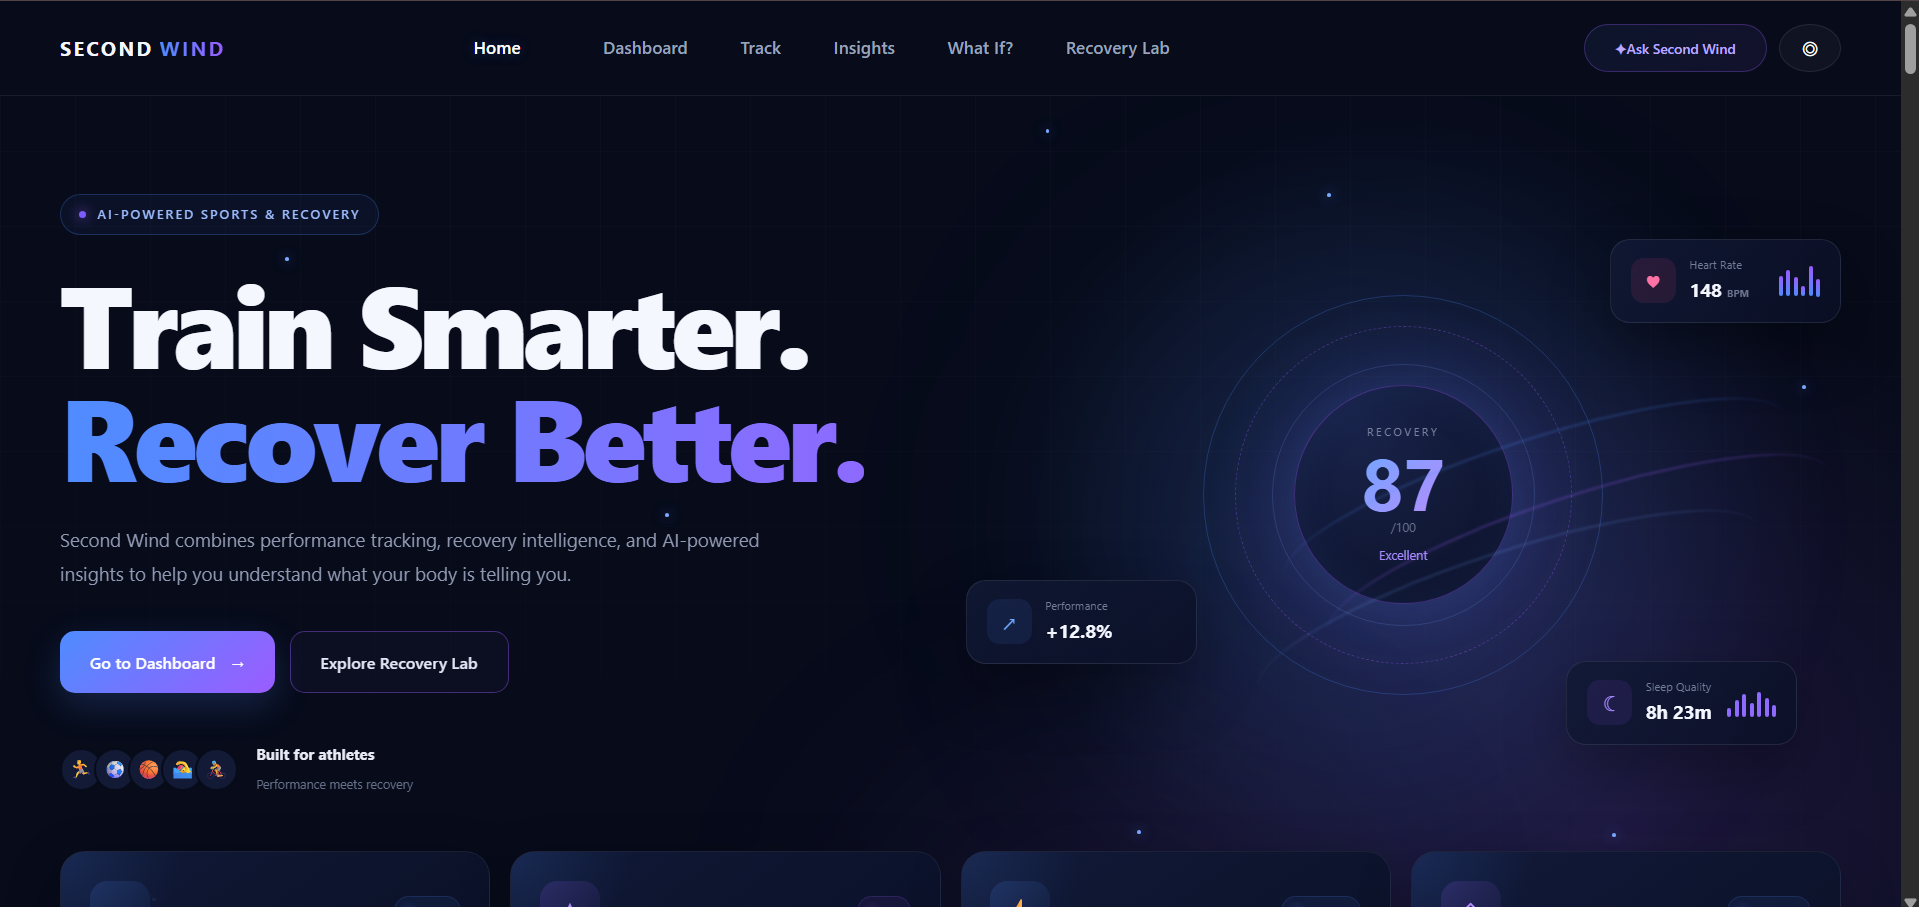
Second Wind was inspired by a simple problem: athletes often have plenty of fitness data, but turning that data into a clear decision about what to do next can be difficult. Training harder is not always better, and recovery is an important part of performance.
I wanted to create a dashboard that makes training and recovery feel connected rather than treating them as separate metrics. The goal was to build something that helps an athlete answer questions like: Should I train hard today? Should I recover? What might happen if I change my training or sleep?
What I Learned
Building Second Wind taught me how to connect multiple interactive systems into one cohesive web experience. I worked with JavaScript to create live workout state, timers, simulated workout metrics, interactive scenario controls, animated statistics, local profile storage, modal interfaces, and responsive UI interactions.
I also learned more about Three.js, using it to create the interactive 3D recovery visualization. Handling animation, mouse interaction, resizing, reduced-motion preferences, and cleanup helped me understand how important performance and accessibility are when building animated interfaces.
Another important lesson was that good dashboards are not just about displaying numbers. The information needs to be organized so that users can quickly understand what the numbers mean and what action they might take.
How I Built It
Second Wind was built as a front-end web application using:
- HTML for the dashboard structure
- CSS for the visual design, responsive layouts, animations, and component styling
- JavaScript for application logic and interactions
- Three.js for the interactive 3D recovery core
- LocalStorage for saving the athlete profile locally in the browser
The application is organized around several major experiences:
- Workout Tracking — Users can start, pause, resume, and finish a workout while seeing simulated time, distance, pace, heart rate, and calorie data update in real time.
- Recovery Lab — Recovery scores, recovery zones, and recovery actions provide a central view of recovery status.
- What If? Simulator — Users can compare different training and recovery scenarios and see projected changes in training load, recovery, readiness, and fatigue.
- Insights — Animated score rings and interactive readiness information make performance data easier to interpret.
- Athlete Profile — Users can save their name, discipline, and goal so the dashboard feels personalized.
- 3D Recovery Visualization — A Three.js visualization provides an interactive representation of the recovery system.
For example, the simulator models a simplified relationship between different performance factors. Conceptually, readiness can be thought of as a function of recovery and fatigue:
[ R = f(\text{recovery}, \text{fatigue}, \text{training load}) ]
The values in the current prototype are intentionally simulated rather than medical or physiological measurements.
Challenges
One of the biggest challenges was keeping many independent interactive components from interfering with each other. The application contains timers, modals, animated values, scenario switching, profile persistence, 3D rendering, and multiple event listeners, so clean state management became important.
Another challenge was making the workout tracker feel realistic without connecting it to an actual GPS or wearable device. I solved this by clearly treating the current workout metrics as simulated demo data. The architecture can later be extended to use real GPS, heart-rate, or wearable APIs.
The Three.js recovery visualization also introduced challenges around initialization and performance. I added protection against duplicate initialization, responsive resizing, pixel-ratio limits, reduced-motion handling, and cleanup for the renderer and animation loop.
Finally, I wanted the interface to feel polished without making it overwhelming. Balancing animations, data density, visual hierarchy, and usability was an important part of the design process.
What's Next
Second Wind is currently a front-end prototype, but it is designed with future expansion in mind. The next stage would be connecting real fitness data sources, replacing simulated metrics with actual workout data, improving the recommendation system, and eventually using more sophisticated models to personalize recovery and training suggestions.
The long-term vision is to turn Second Wind into a useful companion for athletes: not just showing what happened, but helping them understand what to do next.


Log in or sign up for Devpost to join the conversation.